Introduction
As the number of older adults increases worldwide, understanding the relationship between physical and psychological health is increasingly important. It is well established that the likelihood of physical limitations and multi-morbidity increase with age (Manton et al., Reference Manton, Corder and Stallard1997; Wister et al., Reference Wister, Coatta, Schuurman, Lear, Rosin and MacKey2016). Although lower levels of physical capability, that is the capacity to undertake the physical tasks of daily living (Cooper et al., Reference Cooper, Hardy, Sayer, Kuh, Kuh, Cooper, Hardy, Richards and Ben-Shlomo2014a), have been associated with lower levels of mental well-being (Cooper et al., Reference Cooper2014b), individuals in their age of 60s and 70s may also demonstrate high levels of mental well-being, a phenomenon often referred to as the “well-being paradox” (Windle et al., Reference Windle, Woods and Markland2010), or “disability paradox” (Albrecht and Devlieger, Reference Albrecht and Devlieger1999). These findings suggest that individuals’ emotional responses to poor physical capability vary from positive to negative (Antonovsky, Reference Antonovsky1996) and that responses exist on a continuum of resilience, i.e. having higher levels of well-being than would be expected given the level of physical capability, to vulnerability, i.e. having lower levels of well-being than would be expected given the level of physical capability.
Research into resilience and vulnerability has its roots in developmental psychology, examining how certain children managed to fare better than others despite experiencing similar levels of adversity (Masten, Reference Masten2001). These studies of early life have subsequently been expanded to later life (Ong et al., Reference Ong, Bergeman, Bisconti and Wallace2006), examining the ways in which older adults respond more positively to a circumstance than would be anticipated based on the level of adversity experienced. Previous methodological work by Miller-Lewis et al. (Reference Miller-Lewis, Searle, Sawyer, Baghurst and Hedley2013) suggests that this conceptual framework can be used to operationalize a continuum of resilience to vulnerability via residual values from linear regression models. This approach quantifies the difference between the observed and expected, or fitted, values. To help understand the disability paradox, it can be used to quantify how much higher (or lower) than expected is a person's mental well-being than would be expected given their observed level of physical capability. This salutogenic perspective on the aging process draws attention to processes distinct from pathogenic and disease-oriented pathways (Wister et al., Reference Wister, Coatta, Schuurman, Lear, Rosin and MacKey2016).
There are two possible theories that could explain the development of resilience. First, the ability of aging individuals to be resilient is hypothesized to be related to the resources available to them; specifically social, individual, and environmental resources (Wister et al., Reference Wister, Coatta, Schuurman, Lear, Rosin and MacKey2016). The “life course model of multi-morbidity resilience” theorizes that individuals who build up reserves, by invoking these three resource domains, are better able to accommodate adversity (Wister et al., Reference Wister, Coatta, Schuurman, Lear, Rosin and MacKey2016). Further, this model suggests a cumulative approach to the development of resilience, i.e. over time reserves are developed in these resource areas in order to foster more positive responses to adversity during the aging process. This suggests that individuals who have higher levels of these resources currently at their disposal will have greater resilience; therefore, we hypothesize that individuals of higher socioeconomic position (SEP) will have greater resilience, as they have greater social and economic resources available to them when compared to individuals of lower SEP. It is well established that health is socioeconomically pattern (Marmot, Reference Marmot2005). Those in socioeconomically disadvantaged groups have been shown to have greater risk of a host of negative physical and psychological outcomes when compared with socioeconomically advantaged groups (Marmot, Reference Marmot2005). Less clear, however, is whether greater socioeconomic advantage in childhood as well as adulthood yields resources that promote resilience. The second theory proposes a different association between childhood SEP and later life resilience. In contrast to the “life course model of multi-morbidity resilience,” the theory of “steeling” suggests that resilience may be developed through inoculation by exposure to mild adversity in early life (Cohen et al., Reference Cohen, Mermelstein, Kamarck, Hoberman, Sarason and Sarason1985). Therefore, according to the theory of steeling, we hypothesize that, for a given level of adult SEP, those who had a more socioeconomically disadvantaged childhood will have greater resilience. In other words, we hypothesize that low childhood SEP followed by high adult SEP (i.e. upward intergenerational social mobility) will be associated with greater resilience compared to those who have high SEP in childhood and adulthood.
Key resources that are potentially amenable to change and may promote resilience include lifestyle and social factors (Wister et al., Reference Wister, Coatta, Schuurman, Lear, Rosin and MacKey2016). In particular, leisure time physical activity (LTPA) (Sacker and Cable, Reference Sacker and Cable2006) and social support (Kim and Nesselroade, Reference Kim and Nesselroade2003; Golden et al., Reference Golden2009) are related to both physical capability and mental well-being. There is evidence that these are socioeconomically patterned (Turner and Marino, Reference Turner and Marino1994; Elhakeem et al., Reference Elhakeem, Cooper, Bann and Hardy2015) and may therefore be on the explanatory pathways from SEP to resilience/vulnerability. We hypothesize that those with greater levels of LTPA and social support will have higher levels of resilience and that these resources will partly mediate any relationship between SEP and resilience.
Methods
Sample
The Medical Research Council National Survey of Health and Development (NSHD) is based on a social class stratified sample of 5,362 singleton births on mainland Britain in March 1946 (Wadsworth et al., Reference Wadsworth, Kuh, Richards and Hardy2006). Data to operationalize resilience were collected at age 60–64 years (Kuh et al., Reference Kuh2011). The 60–64 years data collection consisted of a postal questionnaire followed by an invitation to attend an assessment in a clinical research facility or in the study member's home. Of the 3,163 people in the target sample, information was obtained from the postal questionnaire and/or visits from 2,662 (84.1%). No attempt was made to contact the remaining 2,199 study members: 718 (13.4%) had already died, 594 (11.1%) had previously withdrawn from the study, 567 (10.6%) lived abroad, and 320 (5.9%) had been untraceable for more than ten years (Stafford et al., Reference Stafford2013). Ethical approval for this data collection was obtained from the Greater Manchester Local Research Ethics Committee and the Scotland A Research Ethics Committee.
Resilience
Physical capability
Standardized protocols were used by trained research nurses to assess grip strength, chair rise, standing balance, and timed-up-and-go, described elsewhere (Kuh et al., Reference Kuh, Bassey, Butterworth, Hardy and Wadsworth2005; Guralnik et al., Reference Guralnik, Butterworth, Wadsworth and Kuh2006) and summarized below. Grip strength was assessed isometrically using an electronic handgrip dynamometer (Kuh et al., Reference Kuh2006). Three measurements were taken in each hand, with the highest value (in kilograms) recorded used in analyses. Standing balance time was measured by timing how long (up to a maximum of 30 sec) participants could maintain a one-legged stance with his/her eyes closed. Due to the positive skew of these data, natural logarithm transformation (ln(seconds + 1)) was used to normalize the distribution. Chair rise time was measured as the time taken to rise from a sitting position to a standing position (with straight back and legs) and back to a sitting position ten complete times. Chair rise speed was calculated as repetitions/minute (10/time) for use in these analyses. The timed-up-and-go test involved recording the time taken for participants to rise from an armless chair, walk 3 m at a normal pace, turn around, return to the chair, and sit back down (Podsiadlo and Richardson, Reference Podsiadlo and Richardson1991). The test was performed a single time. Participants were allowed to use walking aids in the timed-up-and-go test (n = 24). In instances where participants could not complete the tests for health reasons (n = 49 for grip strength, n = 136 for chair rise, n = 89 for standing balance, and n = 34 for timed-up-and-go), participants were assigned a value of 0. As per the method devised by Guralnik et al. (Reference Guralnik, Butterworth, Wadsworth and Kuh2006) scores on each measure were rescaled (0 (low) to 1 (high)) and summed to create a composite continuous score of physical capability with a range from 0 (unable to perform all 4 tests) to 4 (high performance on all 4 tests). This score has a demonstrated relationship with mortality; further, the use of a composite score demonstrated greater predictive value than any one test (Cooper et al., Reference Cooper, Strand, Hardy, Patel and Kuh2014c).
Mental well-being
Prior to the assessment of physical capability, participants self-completed the 14-item Warwick-Edinburgh Mental Well-being Scale (WEMWBS) (Tennant et al., Reference Tennant2007) in the postal questionnaire. The WEMWBS was developed to capture both eudemonic and hedonic aspects of mental well-being, and includes items on positive affect, satisfying interpersonal relationships, and positive mental functioning (Tennant et al., Reference Tennant2007). Respondents are asked to indicate the frequency, on a five-point scale, with which they have experienced each positively worded statement in the last two weeks. Statements include “I've been feeling good about myself,” “I've been feeling close to other people,” “I've been interested in new things,” and “I've been feeling optimistic about the future.” Higher scores indicate greater well-being. Validation studies indicate good construct validity for a single factor structure as well as good criterion validity and test–retest reliability, and support the use of the WEMWBS in general population samples (Repetti et al., Reference Repetti, Taylor and Seeman2002).
Operationalizing resilience
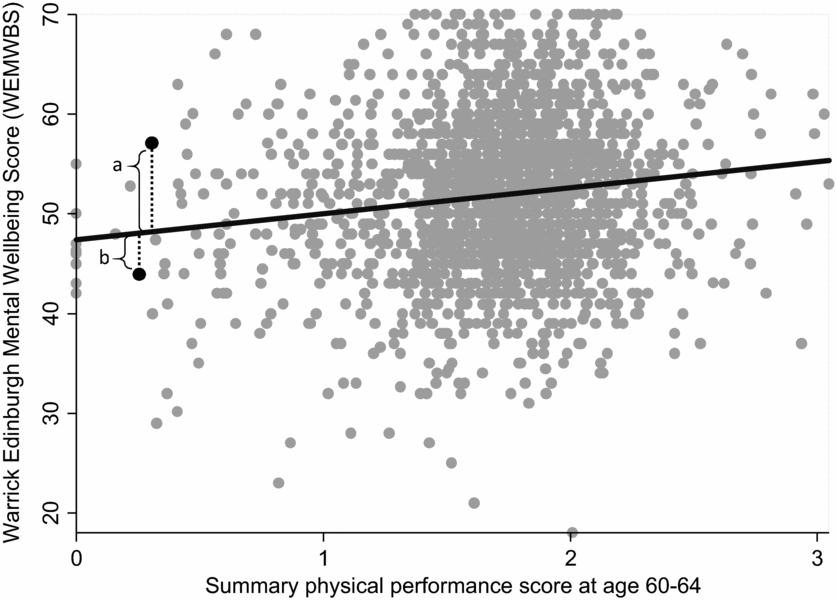
The residual approach to operationalizing resilience quantifies the degree to which an individual responds more or less positively to a circumstance than would be predicted by the level of adversity experienced (Miller-Lewis et al., Reference Miller-Lewis, Searle, Sawyer, Baghurst and Hedley2013). In the present study, the WEMWBS score quantified a participant's level of well-being, and the composite physical capability score quantified the degree of adversity. Resilience was modeled as the difference between observed and predicted WEMWBS score, i.e. residual values, for the physical capability composite score in a linear regression model. The distance between the fitted regression line, i.e. expected WEMWBS score, and the participant's observed WEMWBS score was used as a continuous metric of an individual's level of resilience (Figure 1). The greater the size of the positive residual the greater, the resilience the individual demonstrated. Conversely, more negative residual scores indicated greater vulnerability.
Well-being linearly regressed on summary objective physical performance at age 60–64 years (standardized regression coefficient β = 2.68, p < 0.001, 95% Cl 1.82, 3.54). (a) Positive residual value indicating greater observed well-being score than would be expected by the fitted regression line; (b) Negative residual value indicating lower observed well-being score than would be expected by the fitted regression line.

Exposures
Indicators of socioeconomic position
Occupation-based social class was coded using the UK Registrar General's Social Class scheme in six categories. Professional, managerial, and technical/skilled non-manual occupations were categorized as non-manual and skilled manual, partly skilled and unskilled as manual occupations. Data for adult head of household social class were collected from the participant at age 53 years (or age 43 years if missing at 53 (n = 85) and 36 if missing at 53 and 43 (n = 16)). Study member's educational attainment by age 26 years was categorized as “No education or Sub-GCE,” “O-Level or equivalent,” (typically obtained at age 16) “A-Level or equivalent” (typically obtained at age 18 years), and “Degree or higher.” Indicators of childhood SEP were based on father's social class, collected in 1950, i.e. participant age four years, and on parental education, collected in 1952, i.e. participant age six years. Father's and mother's educational level was classified as “primary only,” “primary and further education (no qualifications attained),” “secondary only or primary and further education or higher,” or “secondary and higher.”
Social mobility
Intergenerational social mobility was based on childhood and adult social class and classified into four groups (childhood social class/adult social class): manual/manual; manual/non-manual (upward); non-manual/manual (downward); non-manual/non-manual.
Leisure time physical activity (LTPA)
LTPA was captured at ages 53 years and 60–64 years. In these waves of data collection study members self-reported the number of times they had participated in any sports, vigorous leisure activities or exercises in their spare time, not including getting to and from work, in the past four weeks coded as : 0 times (coded 0), 1–4 times (1), or 5 or more times (2). As in previous work (Cooper et al., Reference Cooper, Mishra and Kuh2011), a cumulative score was calculated ranging from 0, i.e. inactive at both ages, to 4, i.e. LTPA reported 5 or more times at both ages. The validity of these LTPA measures has been considered previously (Cooper et al., Reference Cooper, Mishra and Kuh2011) and they have been shown to correlate with monitored levels of daily activity at age 60–64 years (Golubic et al., Reference Golubic2014).
Social support
In the social relationships and health literature, studies have typically distinguished structural (capturing the quantity and breadth of a person's social contacts) and functional aspects (capturing the support derived from relationships (Cohen et al., Reference Cohen, Mermelstein, Kamarck, Hoberman, Sarason and Sarason1985)). Some have also distinguished between positive and negative aspects of functional support. Study members reported the quantity of social contact, perceived social support, and marital status based on 13-items at ages 53 years and 60– 64 years (Supplementary table).
To combine social support items to calculate a cumulative score, an indexing procedure was employed, i.e. putting ordinal values on a scale of 0 (lowest) to 10 (highest level of support), for each of the 13 social support variables. Scores from the 13 social support items at age 53 years and at age 60–64 years were then summed to create a cumulative score ranging from 0 (lowest) to 260 (highest). These scores were then standardized and are reported as z-scores.
Statistical analysis
Individuals’ resilience scores, i.e. residual values from a linear regression of WEMWBS on physical capability, were used as the outcome variable. Residuals were approximately normally distributed indicating a linear association between well-being and physical capability. Linear regression models were used to examine the relationship between own and childhood socioeconomic indicators and resilience. The four levels of social mobility were dummy coded, first using downward social mobility as the reference group then using upward social mobility as the reference group to examine differences between different mobility patterns, notably between non-manual/non-manual and upward trajectories. Interactions between sex and each socioeconomic indicator were examined but we found no evidence of modification by sex and so sex-adjusted analyses are presented throughout.
Structural equation models, i.e. path analyses, were employed to examine mediation of the associations identified between specific indicators of SEP and resilience through cumulative PA scores and cumulative social support scores. This partitions the total association between SEP and resilience into an indirect association (through the mediators) and a direct association (not explained by included variables). Root means square error approximation (RMSEA), comparative fit index (CFI), and Tucker–Lewis Index (TLI) fit indices were used to assess model fit. Models with RMSEA values lower than 0.05, CFI values greater than 0.9, and TLI values greater than 0.95 are deemed to have adequate fit (Hu and Bentler, Reference Hu and Bentler1999).
Analytical sample
A total of 1,978 participants provided complete well-being data and of these 1,756 had complete data on all four physical capability measures, resulting in an analytical sample of 1,756 for these analyses. Missing data were handled using full information maximum likelihood (FIML), based on the missing at random assumption. Sensitivity analyses were conducted with complete cases as well as with FIML estimation to accommodate for missing data; however, no differences were revealed therefore these results are not presented (data are available on request from the authors).
Results
Sample
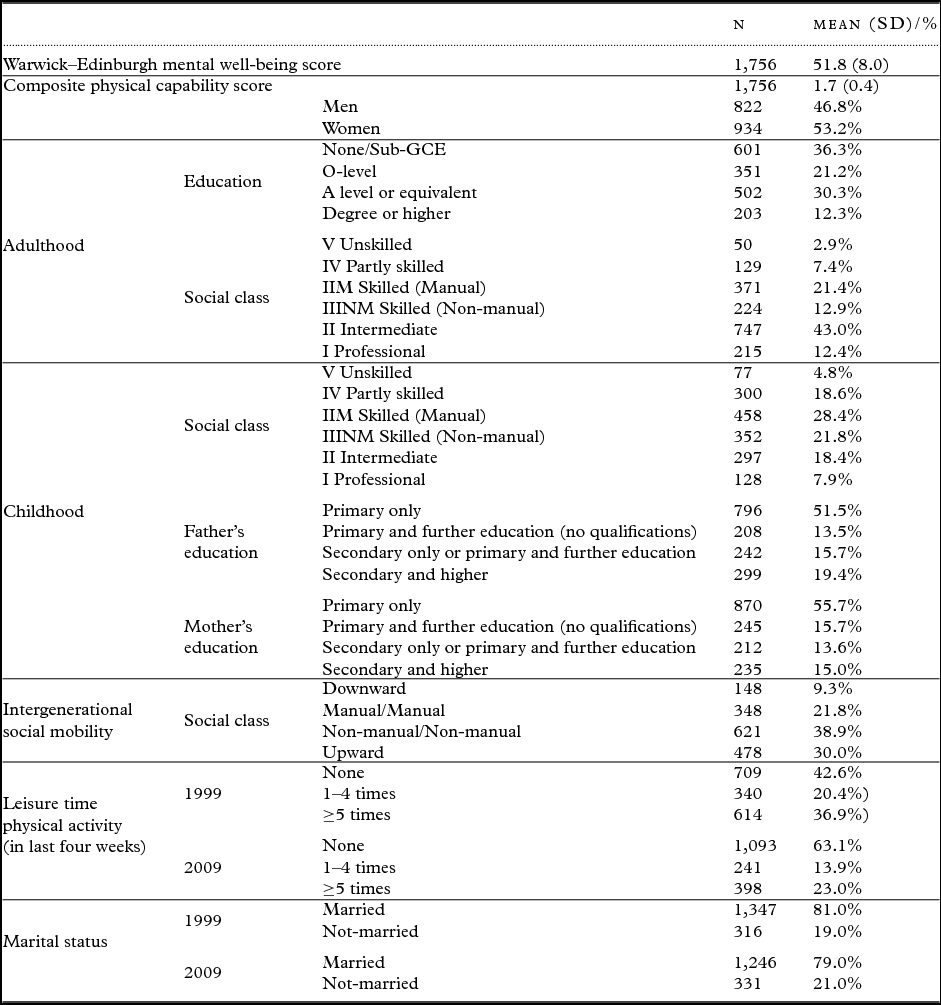
The sample consisted of 53% women, with 58% having educational levels of O-level or lower, and 68% in non-manual occupations (Table 1). Almost 39% of study members were in the non-manual/non-manual social mobility group and 30% were in the upward mobility group.
Characteristics of the MRC NSHD (sample restricted to those with complete data on well-being and physical capability at age 60–64 years)

Resilience analysis
There was a positive relationship between higher physical capability and higher WEMWBS scores in a sex-adjusted model (standardized regression coefficient β = 2.68, p < 0.001, 95% CI 1.82, 3.54) (Figure 1).
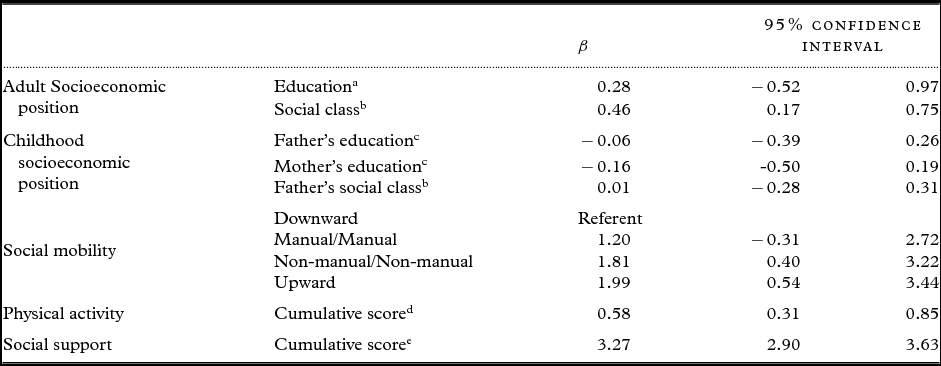
There was a trend toward higher resilience in those with higher own and parental educational attainment though these associations did not attain statistical significance (Table 2).
Resilience linearly regressed on socioeconomic indicators in sex-adjusted models

Regression coefficients represent the standardized difference in mean residual scores per 1 category/unit change in specified socioeconomic indicator.
a Categorized as: 0 “No education or Sub-GCE”; 1 “O-Level or equivalent” (typically obtained at age 16 years); 2 “A-Level or equivalent” (typically obtained at age 18 years); 3 “Degree or higher”.
b Categorized as: 0 “Unskilled”; 1 “Partly skilled”; 2 “Skilled (Manual)”; 3 “Skilled (Non-manual)”; 4 “Intermediate”; 5 “Professional.”
c Categorized as: 0 “Primary only”; 1 “Primary and further education (no qualifications attained)”; 2 “Secondary only or primary and further education or higher”; 3 “Secondary and higher.”
d Higher scores indicate greater physical activity.
e Higher scores indicate greater social support.
Higher adult social class was associated with higher resilience scores in sex-adjusted models (Table 2). Those in the highest social class had resilience scores on average 2.3 units (or 0.29 standard deviations) higher than those in the lowest social class. Childhood social class and parental education were not associated with resilience. Upward and non-manual/non-manual social mobility were associated with greater resilience when compared with downward social mobility; however, when upward social mobility was used as the reference category only an association between upward and downward mobility was observed. Based on this, the mediation analysis focused on explanatory pathways linking adult social class to resilience.
Higher levels of social support (β = 3.27, p < 0.001, 95% CI 2.90, 3.63) and greater participation in LTPA (β = 0.58, p < 0.001, 95% CI 0.31, 0.85) were associated with greater resilience–vulnerability scores in sex-adjusted linear regression models. In a sex-adjusted ordinal logistic regression model higher participant social class was associated with higher levels of LTPA (OR = 1.36, p < 0.001, 95% CI 1.27, 1.44). A sex-adjusted linear regression model revealed no association between higher participant social class and social support (β = 0.59, p = 0.21, 95% CI −0.33 1.51); therefore, analysis of the mediation of participant social class and resilience by social support was not conducted.
In a mediation model of SEP and resilience by LTPA, the model demonstrated adequate fit (RMSEA = 0.00 (90% CI 0.00–0.04); CFI = 1.00; TFI = 1.00). The total effect of adult SEP on resilience was 0.46 (95% CI 0.17, 0.75) and the indirect effect through LTPA was 0.11 (95% CI 0.04, 0.17), i.e. LTPA accounted for 23.4% of the variance in the relationship between SEP and resilience.
Discussion
Adult social class was positively associated with a level of mental well-being greater than expected for the level of physical capability observed, i.e. greater resilience (or lower vulnerability). Here, we operationalized resilience on a continuum from resilient to vulnerable and found a linear association with adult social class indicating that those in the most advantaged social class were most resilient and those in the most disadvantaged social class were most vulnerable. There was no evidence that this type of resilience in adulthood was associated with childhood SEP, based on father's social class or parental education, or with intergenerational social mobility.
Since we found no evidence of differences in levels of resilience between the upward and non-manual/non-manual trajectories, these analyses provide no support for the theory of “steeling,” i.e. developing resilience through inoculation to adversity and exposure to stress in early life. This theory has been supported by positive results in animal models (Lyons et al., Reference Lyons, Parker, Katz and Schatzberg2009), but evidence has been much weaker in humans (Rutter, Reference Rutter2012). Our results suggest that current SEP is more closely associated with this type of adult resilience than prior SEP. These findings align with the “life course model of multi-morbidity resilience theory,” in which access to and accumulation of resources is suggested to foster greater resilience (Wister et al., Reference Wister, Coatta, Schuurman, Lear, Rosin and MacKey2016). Regardless of their childhood SEP, individuals with high adult SEP were more likely to demonstrate greater resilience. Accumulation of resources is more closely associated with resilience than perseverance in the absence of resources.
Our findings supported our hypothesis that individuals who had greater LTPA, and social support would demonstrate greater levels of resilience and lower levels of vulnerability. In addition, the cumulative scores of LTPA and social support at age 53 years and 60–64 years were associated with greater resilience, supporting the accumulation of resources component of the “life course model of multi-morbidity resilience” (Wister et al., Reference Wister, Coatta, Schuurman, Lear, Rosin and MacKey2016). While a relationship was observed between higher LTPA and higher adult social class, no relationship was observed for our composite measure of structural and functional social support and social class leading us to conclude that social support is not on the explanatory pathway between adult social class and resilience in this setting. LTPA, however, was shown to mediate part of the relationship between SEP and resilience. These results suggest that socioeconomic inequalities in resilience in terms of maintaining well-being given low levels of physical capability may be reduced through the fostering of health behaviors, such as LTPA. However, the relationship between LTPA and physical capability is likely bidirectional. To some extent, those with greater physical capability may be more able to be physically active. We are unable to tell from these analyses whether increasing LTPA would lead to greater resilience or whether greater participation in LTPA is a marker of greater physical capability, which is not captured by the performance measures we have considered.
These results must be interpreted with the following limitations in mind. As with any longitudinal study, attrition via death and dropout may introduce bias and/or compromise the generalizability of the findings. To address missing covariate and exposure data, FIML estimation was conducted in linear regression models under a missing at random assumption. However, we did not include those missing data on physical capability and well-being. We know from earlier work that non-responders at age 60–64 years had lower lifetime SEP and had lower physical capability at the previous sweep (age 53 years), though they did not differ from responders in mental health (Stafford et al., Reference Stafford2013). We have examined LTPA and social support as mediators of SEP and resilience; however, many factors beyond these variables, e.g. diet and smoking status, may also have had an impact on individuals’ resilience–vulnerability. LTPA is just one domain of physical activity that is socioeconomically patterned (Elhakeem et al., Reference Elhakeem, Cooper, Bann and Hardy2015), other domains, e.g. active transport and occupational activity, were not included in these analyses; further investigations are required to examine physical activity beyond LTPA. Participants in the present study were aged 60–64 years; therefore, findings from this study may not be generalizable to other age groups. Additionally, we have examined only one form of resilience, i.e. the relationship between physical capability and mental well-being. There are many other forms of resilience that use different adversity and outcome dyads, to which the findings from the present study may not be generalizable. Further investigation is required to examine the relationship between resources in other resilience operationalizations.
The MRC National Survey of Health and Development is a socially stratified population-representative study of aging, providing longitudinal data on resilience, socioeconomic indicators, and socio-behavioral measures. A strength of these analyses is the prospective collection of data from birth to age 60–64 years; recall bias is, therefore, minimized. Through the examination of mediators that are the potentially modifiable, there is opportunity for intervention; for example, LTPA is a form of physical activity that is amenable to change.
The current study suggests that modifiable aspects of lifestyle, i.e. LTPA, may play a role in the mediation of socioeconomic (dis)advantage in the fostering of resilience. Age-related declines in physical capability have been associated with increased risk of disability (Manton et al., Reference Manton, Corder and Stallard1997; Wister et al., Reference Wister, Coatta, Schuurman, Lear, Rosin and MacKey2016). However, although some “vulnerable” individuals experience low well-being when facing limited capability undertaking the physical tasks of daily living, other “resilient” individuals have relatively high well-being for their level of physical capability. Socioeconomic advantage, LTPA, and social support are positively correlated with this resilience. Lower SEP is associated with poorer physical capability (Pierce et al., Reference Pierce, Kuh and Hardy2012; Cooper et al., Reference Cooper, Hardy, Sayer, Kuh, Kuh, Cooper, Hardy, Richards and Ben-Shlomo2014a; Reference Cooper2014b) but these findings provide some preliminary evidence that interventions to raise LTPA levels among those who are more socioeconomically disadvantaged may help promote well-being in the face of this kind of adversity. Through individual- and policy-level interventions to increase LTPA, it may be possible to offset the negative implications of lower SEP, which has the potential to facilitate more positive aging trajectories and greater well-being across the life course.
Conflict of interest
All authors declare no conflict of interest.
Description of authors’ roles
TDC, MS, RC, and DK conceived the study. TDC conducted the analysis and wrote the first draft. MS, RC, and DK aided in the analysis and interpretation of the results. All authors contributed to editing and revising the manuscript.
Acknowledgments
The authors thank the study participants for their continuing participation in the MRC NSHD. They also thank members of the NSHD scientific and data collection teams who have been involved in the NSHD data collections.
This study and RC, DK, and MS are funded by the UK MRC (programme codes MC_UU_12019/1;MC_UU_12019/4; MC_UU_12019/5).
TDC is supported by a Canadian Institutes of Health Research Postdoctoral Fellowship (MFE-146676).
Supplementary material
To view supplementary material for this article, please visit https://doi.org/10.1017/S1041610217002198