Introduction
The primate flicker electroretinogram (ERG) has been attributed to activity in the bipolar cells (Bush & Sieving, Reference Bush and Sieving1996). Typically, the flicker ERG employs frequencies around 30 Hz, but it has been proposed that, at around 12 Hz, the ERG to red–green chromatic modulation reflects activity of the red–green chromatic channel, possibly through midget bipolar cells (Kremers & Link, Reference Kremers and Link2008; Kremers et al., Reference Kremers, Rodrigues, Silveira and da Silva-Filho2010). In contrast, when measured at high temporal frequencies (30 Hz and higher), the flicker ERG has a spectral sensitivity that closely resembles the spectral-luminosity function (V λ), suggesting that diffuse bipolar cells are the main contributors (Padmos & van Norren, Reference Padmos and van Norren1971; Jacobs et al., Reference Jacobs, Deegan and Moran1996a,Reference Jacobs, Neitz and Kroghb). The ratio of L- to M-cone driven signal strengths in the psychophysical luminance channel and in the 30 Hz flicker ERG displays a large interindividual variability, probably related to interindividual variability in L- and M-cone densities. The two ratios measured in different individuals are highly correlated, providing additional evidence for the link between the flicker ERG and activity of the luminance channel (Jacobs & Neitz, Reference Jacobs, Neitz and Drum1993; Brainard et al., Reference Brainard, Roorda, Yamauchi, Calderone, Metha, Neitz, Neitz, Williams and Jacobs2000; Kremers et al., Reference Kremers, Scholl, Knau, Berendschot, Usui and Sharpe2000). Finally, indirect measures of L:M ratios can be changed by cone-specific adaptation (Kremers et al., Reference Kremers, Stepien, Scholl and Saito2003), although of course the underlying cone numbers remain unchanged. Thus, electrophysiologically and psychophysically measured L:M ratios are not only determined by cone numbers but also by postreceptoral factors. We should therefore be careful to distinguish between the numerical L:M ratio, obtained for example, by physically counting cones using an adaptive optics system, and that measured indirectly by various psychophysical and electrophysiological techniques. There is no reason why the numerical L:M ratio should change with state of adaptation. However, if the L- or the M-cones are recruited disproportionally (due to postreceptoral mechanisms), or if their relative phase changes as the state of adaptation changes, then the psychophysical and electrophysiological techniques may yield L:M ratios that differ from their numerical equivalent.
While the effect of luminance adaptation on ERG measures of L:M ratio is unknown, there have been extensive psychophysical studies. When measured with heterochromatic flicker photometry (HFP), increasing luminance leads to a narrowing of the spectral luminosity function with a particular loss of sensitivity at the long-wavelength end of the spectrum (Ives, Reference Ives1912; de Vries, Reference de Vries1947; Ingling et al., Reference Ingling, Tsou, Gast, Burns, Emerick and Riesenberg1978; Pokorny et al., Reference Pokorny, Jin and Smith1993) causing an apparent decrease of the L:M ratio with increasing luminance. However, as Pokorny et al. (Reference Pokorny, Jin and Smith1993) argue, this effect may be caused by the HFP procedure, in which a test and a reference light are modulated in counter phase. The mean luminance of the test light is varied until the perception of flicker is minimal. By changing the mean luminance of the test light, the time-averaged chromaticity is also varied, thereby causing cone-selective adaptation.
An alternative procedure is heterochromatic modulation photometry (HMP; Pokorny et al., Reference Pokorny, Smith and Lutze1989). In HMP, the contrast of the test light is varied instead of its mean luminance. Thus, an estimate of isoluminance between test and reference stimuli can be obtained without changing the mean chromaticity. Using HMP, Pokorny et al. (Reference Pokorny, Jin and Smith1993) found that the L:M ratio does not vary with mean luminance when the mean chromaticity is metameric to 570 nm, thereby producing little cone-selective adaptation. However, luminance has a strong influence on the L:M ratio when the mean chromaticity is metameric to 605 nm, causing substantial cone-selective adaptation (adapting the L-cones more strongly than the M cones). Pokorny et al. (Reference Pokorny, Jin and Smith1993) concluded that luminance per se does not influence the L:M ratio in the spectral-luminosity function.
Because of the close correlation between the high temporal frequency flicker ERG and the psychophysical luminance channel, the above mentioned psychophysical data lead to the hypothesis that mean luminance has little influence on the electrophysiological L:M ratio when there is little cone-selective adaptation. This means that the ERG can be used to study the relationship between luminance and L:M ratio accurately with an objective electrophysiological method. The ERG offers the additional benefit of providing information about phase, which is not readily available with standard psychophysical HFP and HMP methods. We therefore performed flicker ERG recordings to L- and M-cone isolating stimuli in normal trichromats, using the technique of silent substitution (Estévez & Spekreijse, Reference Estévez and Spekreijse1974, Reference Estévez and Spekreijse1982). We employed a wide range of mean luminance levels, to study the possible influence of luminance on the amplitude and phase of L- and M-cone driven ERGs and on the resultant L:M ratio. These data may provide insights into postreceptoral processes in the luminance channel, as reflected in the flicker ERG.
We also performed measurements in dichromats. The results of these measurements can be used to verify that the silent substitution conditions were correct at all adaptation conditions, and that intrusion of responses of rods and S-cones are negligible. Finally, the L-cone driven responses in a deuteranope and the M-cone responses in a protanope can be compared with the L- and M-cone driven responses in the trichromats, to study whether the cone-driven responses are similarly processed in dichromats and trichromats.
Methods
Subjects
The experiments were performed in agreement with the tenets of the Declaration of Helsinki and were approved by the local ethics committee.
Five color normal individuals, one deuteranope, and one protanope participated in this study. One of the normal subjects (CD) was female. The presence of dichromacy or normal trichromacy was established with Ishihara charts, Nagel Anomaloscope model I (Schmidt & Haensch, Berlin, Germany), and Farnsworth–Munsell 100-Hue tests. In each subject, the pupil of the right eye was dilated with Tropicamide 1%. The resulting pupil size was used to calculate retinal illuminance. Upper and lower lid positions were carefully monitored using a camera built in to the stimulus equipment, to ensure the pupil remained fully exposed during each ERG sweep and that pupil diameter remained constant throughout a recording session.
Visual stimuli
The stimuli were presented using a commercially available Ganzfeld stimulator (ColorDome; Diagnosys LLC, Lowell, MA) containing four differently colored LED light sources. Only three of the four types of LED were used in the present experiments, in order to maximize available L- and M-cone contrast (see below). The LEDs had the following peak wavelengths (±half bandwidth at half height): 635 ± 10 nm, 514 ± 20 nm, and 465 ± 10 nm. The temporal frequency of the stimuli was 30 Hz, and modulation was sinusoidal.
The stimuli were partially described before (Murray et al., Reference Murray, Kremers and Parry2008). They are based on those used on a CRT by Kremers et al. (Reference Kremers, Usui, Scholl and Sharpe1999, Reference Kremers, Scholl, Knau, Berendschot, Usui and Sharpe2000), modified to account for the spectral characteristics of the LEDs. Briefly, the ratio of mean R:G:B LED luminance output was kept constant at 10:20:3. As a result, the mean chromaticity, and therefore also the ratio of mean cone excitations, did not change with mean luminance. At a mean luminance of 66 cd/m2 (resulting in about 3300 td retinal illuminance with an 8-mm diameter pupil), the estimated averaged L-, M-, and S-cone excitations were 4040, 3450, and 2010 cone td, respectively. The cone-specific retinal illuminance was calculated in the same manner as the overall retinal illuminance, again assuming a pupil diameter of 8 mm, but replacing the V λ by the cone fundamentals (Stockman et al., Reference Stockman, MacLeod and Johnson1993), which were normalized to a maximal sensitivity of 1.0. The responses were measured at eight different mean luminances, 20, 30, 45, 66, 98, 145, 215, and 319 cd/m2. At these luminances, it can be expected that the 30 Hz rod-driven responses are small, although they might not be completely negligible, especially at the lower end of the scale (Kremers et al., Reference Kremers, Czop and Link2009). Although we did not expect the cone excitation ratio to change with mean luminance, a subtle adaptation of the L-cones was expected, because the L-cone retinal illuminance was higher than the M-cone retinal illuminance.
Silent substitution was used to isolate the responses of single cone types. In all cases, the S-cones were not stimulated (i.e., silent substitution of the S-cones). The responses to selective stimulation of either the L-cones (thus an additional silent substitution for the M-cones) or the M-cones (in which case, the stimuli involved an additional L-cone silent substitution) were measured. Finally, L- and M-cones were stimulated simultaneously with equal cone contrasts and with equal phase. By using only three of the four types of LED, we were able to obtain relatively high cone contrast (34% in all conditions). However, we were not able to control rod stimulation, which was 24.4% for L + M stimulation, −6.9% for L only (the minus sign indicates a counter-phase modulation between rods and L-cones), and 31.3% for M only. This stimulator is able to additionally silence the rods by using the fourth (amber) LED as well as the other three. However, the maximal available cone contrast would only be about 7%. The recordings performed in the dichromats enabled us to estimate whether there was a measurable rod-driven response from the uncontrolled rod contrast.
ERG recordings
ERGs were recorded using a corneal silver/nylon thread (DTLplus; Diagnosys LLC, Lowell, MA) draped across the limbus. Reference was a 9 mm Ag/AgCl EEG electrode (Biosense Medical, Chelmsford, UK) mounted at the ipsilateral outer canthus, and a similar earth electrode was placed on the forehead. Electrode impedance was maintained below 5 kΩ. Signals were amplified using a Grass 15A94 (Astro-med Inc, West Warwick, RI) amplifier with gain of 20,000 and bandwidth of 3–100 Hz. Data were recorded using a CED1401 plus interface running Signal 2 acquisition software (Cambridge Electronic Design, Cambridge, UK). Signals were acquired at 1024 Hz in epochs of 4 s. Five sweeps were recorded for each condition. The data were subjected to a discrete Fourier transform to extract the first harmonic (30 Hz), together with the 29 Hz response as a measure of noise. The data presented are vector averages of the five recordings.
Results
Trichromats
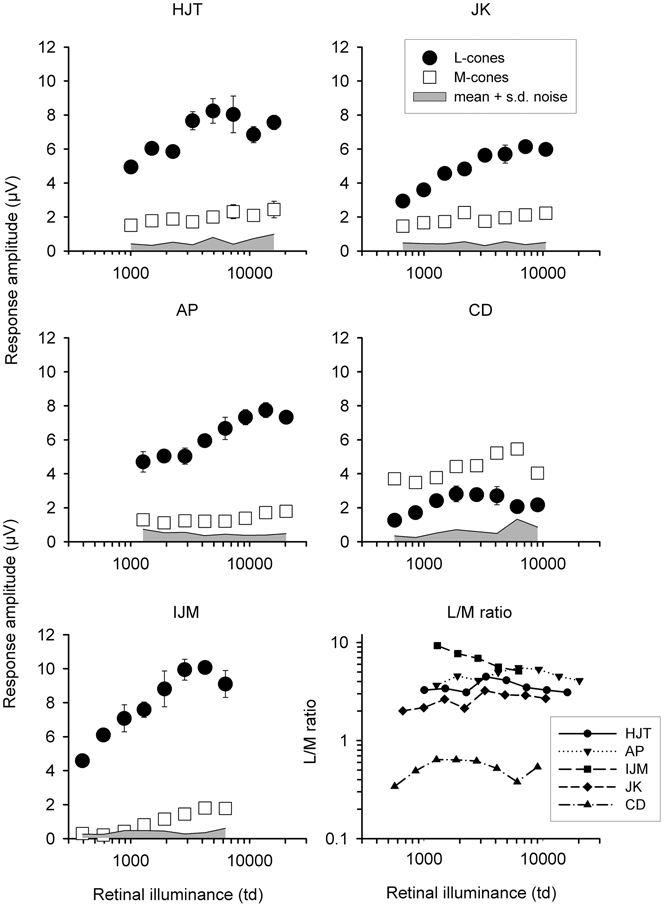
Amplitude and phase of the first harmonic (fundamental) component were computed using discrete Fourier transform of the raw ERG responses. Amplitudes for the five normal trichromats are plotted as a function of retinal illuminance in Fig. 1, together with the ERG-based L:M ratio. The shaded area gives an indication of the noise, showing the upper limit of the mean 29 Hz signal + 1 s.d. Trial-by-trial variability was low, as shown by the error bars. We have also tested between-session variability and find that this is also low, giving us high confidence in the reliability of the data. The L:M ratio is shown only when the signal-to-noise ratio was above 1.5 for both L- and M-cone driven responses. For all subjects, amplitude increases with retinal illuminance. However, the amplitude dependency is different for L- and M-cone driven responses: the amplitudes of the M-cone driven responses generally increase monotonically (with the exception of CD’s highest illuminance), whereas the L-cone driven response amplitude appears to saturate or even decrease at high retinal illuminances. As a result, the L:M ratio starts to increase with increasing retinal illuminance but then decreases again. L:M ratios could not be estimated at lower illuminances for subject IJM because the M-cone driven responses were too small. The absolute ratio varied substantially between subjects: observer IJM displayed much larger responses to L-cone than to M-cone isolating stimuli, and thus, the ERG estimate of L:M ratios were much greater than 1. In contrast, subject CD showed larger responses for M-cone stimuli and L:M ratios smaller than unity. Individual differences in L:M ratios have been described before (Brainard et al., Reference Brainard, Calderone, Nugent and Jacobs1999, Reference Brainard, Roorda, Yamauchi, Calderone, Metha, Neitz, Neitz, Williams and Jacobs2000; Kremers et al., Reference Kremers, Usui, Scholl and Sharpe1999, Reference Kremers, Scholl, Knau, Berendschot, Usui and Sharpe2000).
Response amplitude for L- (•) and M-cone (□) driven 30 Hz ERG responses plotted as a function of retinal illuminance for five trichromats. Error bars are ±1 s.d. The upper boundary of the shaded area is mean noise + 1 s.d., obtained at 29 Hz. The lower right plot shows L:M ERG amplitude ratios for the five subjects.

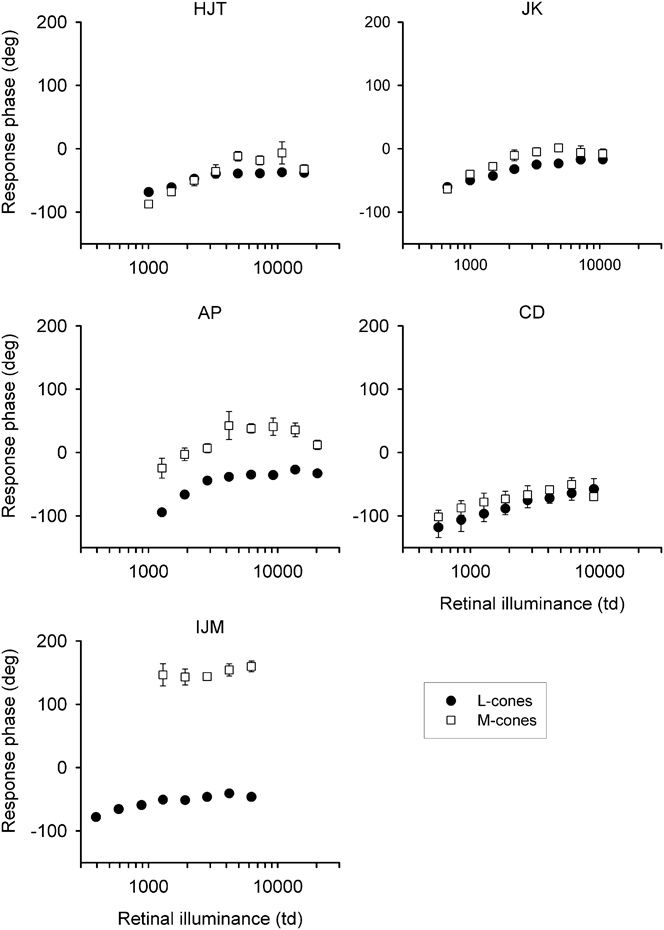
Fig. 2 presents the phase of the L- and M-cone driven responses as a function of retinal illuminance for the trichromats. Both L- and M-cone driven responses become more phase advanced as retinal illuminance increases. In most subjects, the L-cone driven response phase tends to plateau at the higher illuminances, whereas the M-cone response phase becomes more retarded again in this range, suggesting that L- and M-cone driven responses depend differently on retinal illuminance. In all subjects, the M-cone driven responses tend to be phase advanced in comparison with the L-cone driven response, especially at high retinal illuminances. But, in agreement with previous observations using CRT screens (Usui et al., Reference Usui, Kremers, Sharpe and Zrenner1998; Kremers et al., Reference Kremers, Usui, Scholl and Sharpe1999), there is an interindividual variability, so that the phase difference between L- and M-cone driven responses can be large. In fact, in subject IJM, the phase difference is close to 180 deg, so that it is not possible to conclude with certainty which response is leading and which is lagging without testing a range of temporal frequencies.
ERG phase ± 1 s.d. in five normal subjects as a function of retinal illumination for L- (•) and M-cone (□) stimulation. The phase increases with increasing retinal illuminance. The phase difference between L- and M-cone driven responses varies between subjects.

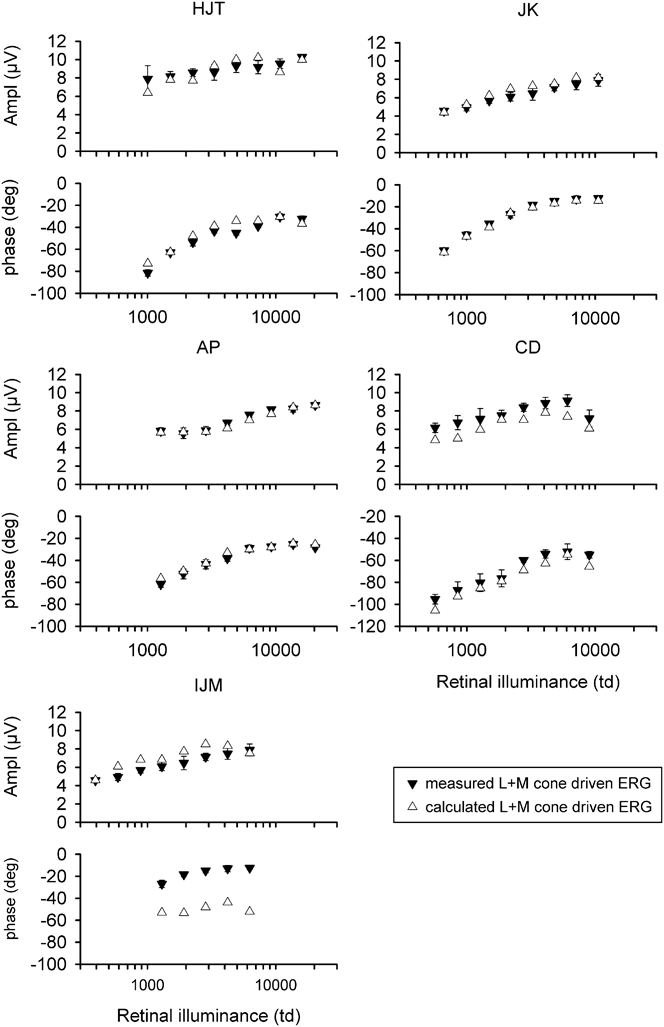
The amplitude and phase of responses to simultaneous in-phase stimulation of L- and M-cones (referred to as L + M), measured at 34% contrast for each cone class, are illustrated in Fig. 3. They exhibit the same characteristics as the responses to cone isolating stimuli: amplitude increases and phase advances with increasing retinal illuminance. We previously proposed that a simple linear vector addition of isolated L- and M-cone driven responses can describe the data for simultaneous L + M stimulation at about 3000 td (Kremers et al., Reference Kremers, Usui, Scholl and Sharpe1999; Kremers, Reference Kremers2003). To verify whether vector addition can also describe the combined L- and M-cone driven responses at other retinal illuminances, we calculated the L + M cone driven responses from the responses to L- and M-cone isolating stimuli. These are shown in Fig. 3 as calculated L- + M-driven responses. In the main, they show that the individual L- and M-driven responses account for the combined response in a simple additive way at all retinal illuminances. Some subjects (notably here, IJM) have a large difference between L- and M-cone driven response phase. As we argue later, this may be related to the presence of high L:M ratios. There is a marked difference between calculated and measured phase, suggesting that additivity may not be complete in such subjects.
Response amplitude (upper plots) and phase (lower plots) measured in the trichromatic observers to in-phase modulation of L- and M-cones (each stimulated with 34% cone contrast) as a function of retinal illuminance (▾). Open triangles (Δ) represent the calculated responses to the stimuli assuming a vector addition of the individual L- and M-cone driven responses shown in Fig. 1.

Dichromats
We recorded responses to L- and M-cone stimuli in two dichromats. As mentioned in the “Introduction,” these experiments served as a control to check whether adequate cone isolation was obtained for a wide range of retinal illuminance. Furthermore, the dichromatic data can be compared with those of the trichromats. Similarities between the two sets of data would indicate a fundamental property of the cone-driven responses, whereas any difference could possibly be attributed to the more heterogeneous cone arrangement in trichromats.
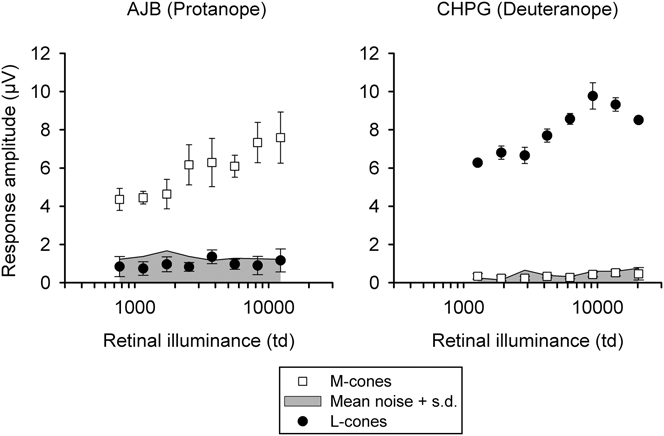
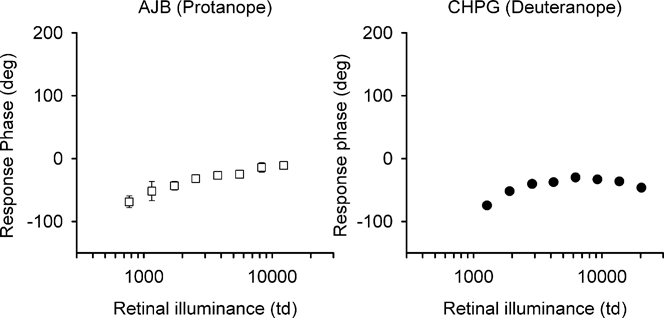
Fig. 4 illustrates the response amplitude to L- and M-cone stimuli in the protanope (AJB) and the deuteranope (CHPG), and Fig. 5 shows the response phase. The responses to stimuli that are meant to stimulate the absent cone type are small and fall within the noise range. This is strong evidence that the employed stimuli were indeed L- and M-cone selective. Furthermore, the absence of a residual ERG when there was only contrast in the rods means that there was also no significant rod intrusion at any retinal illuminance.
ERG amplitude (mean + 1 s.d.) for a protanopic (left plot) and a deuteranopic (right plot) observer plotted as a function of retinal illuminance. Note how the responses to stimulation of the absent photoreceptor do not emerge from the noise, while the remaining photoreceptor generates a large response. The upper boundary of the shaded area is mean noise + 1 s.d., obtained at 29 Hz.

ERG phase for the stimulation of the remaining cone class in a protanopic (left) and a deuteranopic (right) observer. As with the trichromats, phase increases with increasing retinal illuminance. Phase characteristics are similar to those seen in most trichromats.

Many of the characteristics observed in the trichromatic responses were also present in the dichromats. For example, response amplitude increased and phase advanced with increasing retinal illuminance. In addition, the M-cone driven responses in the protanope increased in amplitude steadily over the whole range of retinal illuminances, whereas the L-cone driven responses in the deuteranope showed a saturation effect at the highest retinal illuminances, as is evident in Fig. 1 for the trichromats.
Despite the fact that some trichromatic subjects exhibit large phase differences between L- and M-cone driven responses, the dichromats’ phases were very similar to each other.
Discussion
Response amplitude and phase versus retinal illuminance
As mentioned in the “Introduction,” the high temporal frequency flicker ERG can be used to obtain objective noninvasive electrophysiological estimates of amplitude and phase of cone-driven responses in the luminance channel. From these data, L:M ratios can be calculated in trichromatic observers that are comparable with those obtained in psychophysical experiments (see Brainard et al., Reference Brainard, Roorda, Yamauchi, Calderone, Metha, Neitz, Neitz, Williams and Jacobs2000; Kremers et al., Reference Kremers, Scholl, Knau, Berendschot, Usui and Sharpe2000).
Most trichromatic subjects display a larger L-cone driven response at all retinal illuminances. This agrees with psychophysical observations in which trichromats were generally more sensitive to L-cone isolating stimuli at high temporal frequency where the luminance channel mediates detection (Brainard et al., Reference Brainard, Roorda, Yamauchi, Calderone, Metha, Neitz, Neitz, Williams and Jacobs2000; Kremers et al., Reference Kremers, Scholl, Knau, Berendschot, Usui and Sharpe2000). For chromatic-mediated detection, the sensitivities for L- and M-cone isolating stimuli are generally equal (Krauskopf, Reference Krauskopf2000; Kremers et al., Reference Kremers, Scholl, Knau, Berendschot, Usui and Sharpe2000). In line with this finding, most subjects reported greater discomfort when observing the flickering L-cone stimulus at higher luminances.
A change is also seen in phase, the responses becoming more phase advanced with increasing retinal illuminance. This suggests the presence of a nonlinearity. The origin of this is still unclear. Possibly, there is an illuminance-dependent gain control mechanism in the pathway leading to an ERG response. Such gain control mechanisms are known to be active in the retina and can be observed in the responses of horizontal cells (Smith et al., Reference Smith, Pokorny, Lee and Dacey2001) and retinal ganglion cells (Lee et al., Reference Lee, Pokorny, Smith, Martin and Valberg1990; Purpura et al., Reference Purpura, Tranchina, Kaplan and Shapley1990).
Additivity
Despite the illuminance-dependent changes in response amplitude and phase, the interaction between the two signals does not alter because it can be described by a vector addition model at all illuminances. This suggests that the L- and M-cone driven signals are altered by the mean illuminance before they merge. The one case where the vector additivity model fails is IJM. In this subject only, the (very weak) M-cone response is virtually in antiphase with the L-cone response. It is difficult to speculate why the model fails here, but this subject has an extreme L:M ratio, which might play a role.
Amplitude ratio and phase difference versus illuminance
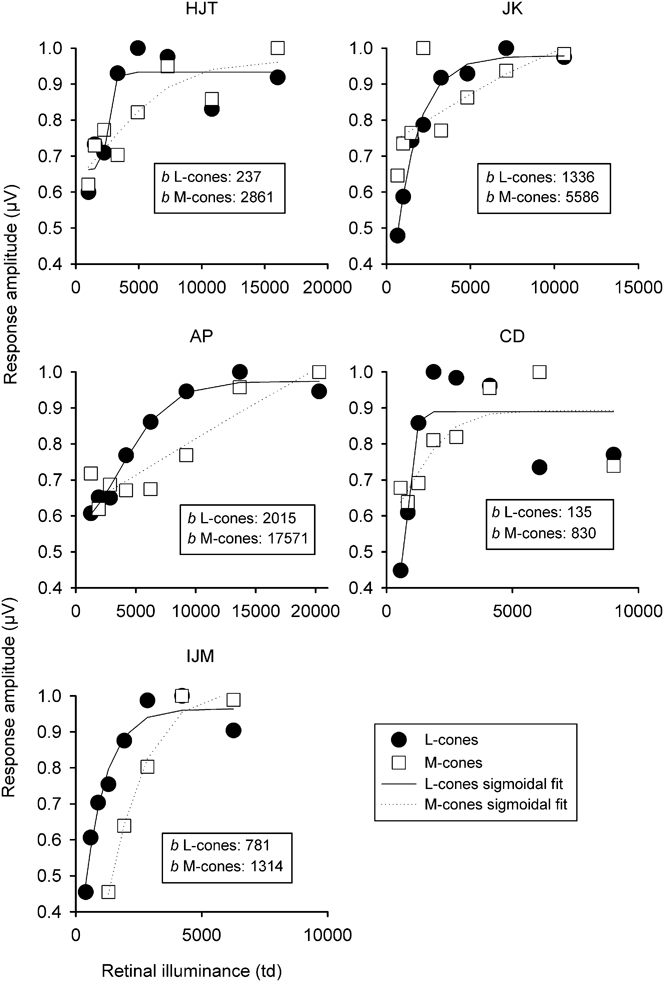
The amplitudes of the L- and M-cone driven responses in trichromats depend differently on retinal illuminance. To show this difference more clearly, we fitted the data with sigmoid functions. Firstly, each subject’s measured L- and M-cone driven responses were normalized to his or her maximum. The normalized response amplitudes (R) as a function of retinal illuminance (I) were then fitted with the following function:

This has four free parameters (R 0: the normalized response at the lowest retinal illuminance; ΔR: the maximal change in normalized amplitude; I 50: the retinal illuminance for a half-maximal normalized response change; b: the rate of change in amplitude). The sigmoid function was used as an empirical description of the data without an underlying physiological model. A faster illuminance-dependent increase is quantified by smaller values of b. The normalized responses with the fitted sigmoid functions are shown in Fig. 6. The estimates for b are given for the L- and M-cone driven responses for each observer. For each observer, the values of b were smaller for normalized L-cone responses, indicating a faster illuminance-dependent increase.
Normalized amplitudes of L- and M-cone driven ERGs as a function of retinal illuminance. The normalized amplitudes are fitted with sigmoid functions, using solid (L-cones) and dotted (M-cones) lines. The values of b, given in the insets, are estimates obtained from the fits. The parameter b quantifies the steepness of the sigmoid function, where smaller values indicate a steeper function. The fits show that the amplitudes of the L-cone driven ERGs increase more steeply with retinal illuminance than the M-cone driven ERGs.

The different illuminance dependence of L- and M-cone responses means that the ERG-based L:M ratio changes, particularly for those observers with extreme values (IJM and CD). These data are in agreement with psychophysical data (Pokorny et al., Reference Pokorny, Jin and Smith1993). Clearly, the numerosity of the photoreceptors does not change with illuminance. One possibility is that postreceptoral mechanisms influence the ERG-based L:M ratio in a manner not seen with anatomical estimates (for instance using adaptive optics).
The change in estimated L:M ratio is probably not caused by intrusion of rod-driven signals. Evidence for this comes from the dichromats’ data, showing no measurable contamination from rods.
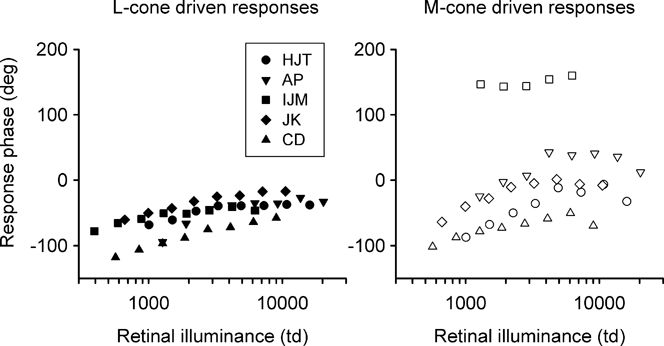
Another interesting finding is that, in addition to L:M ratio, there is substantial interindividual variability in the phase difference between L- and M-cone driven responses. In accordance with previous data (Kremers et al., Reference Kremers, Usui, Scholl and Sharpe1999; Kremers & Scholl, Reference Kremers and Scholl2001), M-cone driven responses lead L-cone driven responses in most subjects. It would be interesting to see whether there might be a correlation between individual values of amplitude ratios on the one hand and phase differences of L- and M-cone driven responses on the other. This might give a clue about the basic processing of the ERG signal. The measurements presented here yielded extremely reliable results and are therefore suited to study such a correlation.
L- (left) and M-cone (right) phase for all five trichromats, replotted from the data shown in Fig. 2. There is more interindividual variability in the M-cone driven ERG phase.

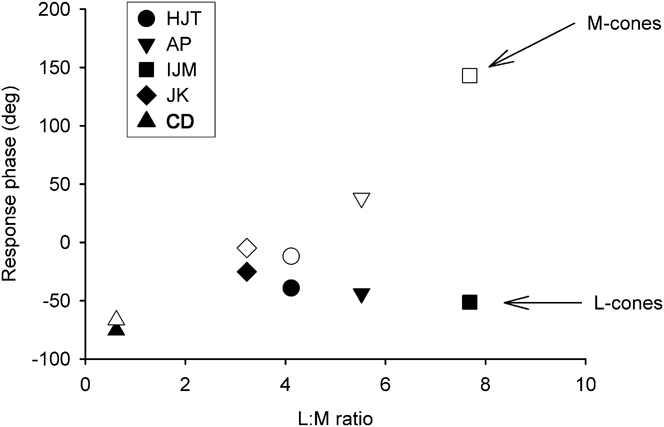
Fig. 7 shows that the between-subject variation in phase is greater in the M-cone than in the L-cone ERG. This could be related to the fact that this group of five observers includes a wide range of ERG-based L:M ratios, from slightly less than 1 to around 8. To test this idea, we have plotted in Fig. 8 the L- and M-cone phase as a function of L:M ratio for one luminance condition, 98 cd/m2. The data show that, as the L:M ratio increases, M-cones become more phase advanced, whereas L-cone phase is relatively stable. This observation may be due to the low M-cone numbers in the observers with high L:M ratios. There may be an M-cone count threshold below which their response phase is advanced. Above that threshold, the M-cone phase is relatively stable and resembles the L-cone phase. This notion is supported by other experiments in which we find that M-cone driven phase is advanced as we stimulate the more peripheral retina, where cone density is lower (Challa et al., Reference Challa, McKeefry, Parry, Kremers, Murray and Panorgias2010). The dichromats’ data give further support to this idea. In these two observers, the absent cone is replaced by the remaining cone type. Fig. 5 shows the dichromats’ L- and M-cone phase to be almost identical.
Individual response phase of L- (closed symbols) and M-cone (open symbols) driven ERGs as a function of amplitude-based L:M ratio in the five trichromatic subjects measured at 98 cd/m2. A correlation is evident between L:M ratio and phase for M-cones but not for L-cones.

Acknowledgments
This work was supported by German Research Council (DFG) Grant KR1317/9-1 to J.K. J.K. was supported by a fellowship in the excellence program of the Hertie foundation. N.R.A.P. is supported by the National Institute for Health Research (NIHR) Manchester Biomedical Research Centre. A.P. is supported by a stipend from the Visual Sciences Fund (Manchester, UK). The authors are very grateful to all the volunteer observers. Disclosure of commercial interest: all authors: None.