I. INTRODUCTION
Active devices based on piezoelectric films have been widely investigated for microelectromechanical system (MEMS) applications.Reference Qiu, Lei, Yang, Yin, Zhang, Bian, Ji, Liu, Zhao, Luo and Hu1–Reference Newns, Elmegreen, Liu and Martyna4 Pb(ZrxTi1−x)O3 films have been widely used in this field due to their excellent piezoelectric properties, especially the morphotropic phase boundary composition at x = 0.5.Reference Shrout and Zhang5–Reference Jaffe, Roth and Marzullo7 However, alternative Pb-free piezoelectric materials have been highly sought after as a replacement for this material due to the toxicity of Pb.Reference Leontsev and Eitel8
Pb-free piezoelectric materials based on the alkaline niobate structure have attracted a lot of attention in research,Reference Li, Eang, Zhu, Cheng and Yao9 particularly (KxNa1−x)NbO3, a solid solution between KNbO3 and NaNbO3. This material is considered to be one of the most promising candidates because (KxNa1−x)NbO3 also possesses a phase boundary for compositions around x = 0.5, and may exhibit a maximum piezoelectric response comparable to Pb(Zr0.5Ti0.5)O3; to date, it has been shown to be one of the best performing Pb-free piezoelectric materials.Reference Liu, Liu, Li, Shen, Dang, Liu, Xue and Wang10,Reference Saito, Takao, Tani, Nonoyama, Takatori, Homma, Nagaya and Nakamura11 Therefore, it can be expected that (KxNa1−x)NbO3 films would make an excellent candidate for high performance, environmentally friendly piezoelectric MEMS devices.
Various preparation methods for (KxNa1−x)NbO3 films have been studied, such as sputtering,Reference Kanno, Mino, Kuwajima, Suzuki, Kotera and Wasa12 pulsed-laser deposition,Reference Cho and Grishin13 sol–gel,Reference Tanaka, Hayashi, Kakimoto, Ohsato and Iijima14 and chemical solution deposition.Reference Nakashima, Sakamoto, Shimura and Yogo15 The hydrothermal method is one type of chemical solution deposition, a wet process previously shown to successfully prepare the various piezoelectric films at temperatures below 300 °C. The main advantage of this method in the preparation of (KxNa1−x)NbO3 films is that it minimizes the vaporization of K and Na from the deposited films that may occur when processing the material at higher temperatures.Reference Hicks16 Moreover, epitaxial KNbO3 and NaNbO3 films have been prepared by this method, with the resulting films exhibiting excellent electrical properties compared with the films prepared by other means.Reference Ishikawa, Yazawa, Fujisawa, Yasui, Yamada, Hasegawa, Morita, Kurosawa and Funakubo17–Reference Goh, Levi, Choi and Lange21
On the other hand, there are few reports of hydrothermally synthesized (KxNa1−x)NbO3 films.Reference Handoko and Goh22,Reference Handoko and Goh23 Recently, we demonstrated epitaxial growth at 240 °C of (KxNa1−x)NbO3 films on (100)SrTiO3 substrates for various compositions over the range 0 < x < 1 by controlling the molar fraction of KOH and NaOH in source materials.Reference Shiraishi, Einishi, Yasui, Ishikawa, Hasegawa, Kurosawa, Uchida, Sakashita and Funakubo24 Good piezoelectric properties with d 33 = 69 pm/V were observed in the composition x = 0.51,Reference Shiraishi, Einishi, Yasui, Ishikawa, Hasegawa, Kurosawa, Uchida, Sakashita and Funakubo25 a value comparable to the (K0.5Na0.5)NbO3 films prepared by other techniques. Other studies reporting synthesis of (KxNa1−x)NbO3 by different methods have also shown that the best piezoelectric properties of this material tend to occur at this composition.Reference Ishikawa, Yazawa, Fujisawa, Yasui, Yamada, Hasegawa, Morita, Kurosawa and Funakubo17–Reference Cheng, Ozawa, Osada, Miyazaki and Kimura20 However, hydrothermally grown films possessing good piezoelectric properties were found to consist of two separate perovskite phases, one being K-rich and the other Na-rich.Reference Shiraishi, Kaneko, Einishi, Shimizu, Kurosawa, Uchida, Kobayashi, Kiguchi, Konno and Funakubo26 Similar coexistence of two perovskite phases has also been reported, not only in thin-films of this material, but also for hydrothermally grown (K0.5Na0.5)NbO3 powder; in fact, preparation of a single-phase material by this synthetic route is yet to be achieved.Reference Sun, Xing, Chen, Deng, Li, Yu, Qiao and Liu27,Reference Wang, Gu, Hu, Yang, Hu, Zhou and Guan28 This material growth behavior appears to be a phenomenon unique to the hydrothermal method: single-phase films with this composition have been successfully prepared by other methods.Reference Kanno, Mino, Kuwajima, Suzuki, Kotera and Wasa12–Reference Nakashima, Sakamoto, Shimura and Yogo15 However, to this point a detailed analysis of the two coexisting structural compositions has not been undertaken: as such, this study was carried out to investigate the distribution and origins of these two phases in hydrothermally synthesized epitaxial (K0.5Na0.5)NbO3 films.
II. EXPERIMENTAL
(KxNa1−x)NbO3 films were hydrothermally grown on (100)Nb-doped SrTiO3 single crystal substrates at 240 °C. The growth solution was prepared by mixing KOH and NaOH with a molar ratio of [KOH]/{[NaOH] + [KOH]} = 0.85 at a concentration of 7.0 mol/L, followed by the addition of 9.4 × 10⁻⁴ mol of Nb2O5 powder. Material growth was carried out by immersing a substrate in a Teflon bottle containing the solution, sealed in an autoclave, placed in an oven which was maintained at 240 °C. The deposition time was varied between 1 and 6 h: the initial deposition time (corresponding to 0 h) was defined as the time at which the autoclave was placed in the oven, and therefore the stated deposition time in this study includes the time taken for the autoclave to reach the desired setpoint. The temperature of the autoclave was recorded during the deposition time and reached 240 °C in about 2 h. After the desired deposition time, the autoclave was removed from the oven and cooled for 15 min in water. The films were subsequently washed and dried at 150 °C for 1 h.
The film thickness was measured by surface profilometry (DEKTAK 3ST, Veeco, Tokyo, Japan). The overall bulk film composition was measured by x-ray fluorescence spectroscopy (XRF) using a PW2404 (PANalytical, Osaka, Japan) and calibrated using standard samples. The crystal structure was investigated by x-ray diffraction (XRD) using a Philips X'Pert MRD system with Cu–Kα1 radiation (PANalytical) and Bruker D8 DISCOVER x-ray diffractometer with Cu–Kα1 and Kα2 radiation (Bruker Corporation, Yokohama, Japan). Pseudocubic index denoted as (hkl)pc was used. Cross-sectional images were observed using high-angle annular dark field-scanning transmission electron microscopy (HAADF-STEM) on a JEM-ARM200F (JEOL Ltd., Tokyo, Japan); in addition, energy dispersive x-ray spectroscopy (EDS) and selected area electron diffraction analysis were carried out to investigate the spatial distribution of these two phases using a JEOL JED-2300T.
III. RESULTS
A. Composition and crystal structure analysis
Figure 1(a) presents the relationship between the deposition time and the overall deposition amount for each of the elements K, Na, and Nb: this was estimated from the intensity for each elements measured by XRF. Film growth was not observed for substrates heated for times shorter than 1 h, presumably because of the incubation time for the reaction of the starting materials coupled with the time taken for the autoclave to reach 240 °C. The deposition amount for all of these elements was observed to increase rapidly between 1.5 and 3 h, before leveling off and reaching saturation after 5 h: this is tentatively ascribed to decreases in the concentration of Nb ions in solution, limiting further film growth. Notably, the results show that a greater amount of K than Na was deposited for film growth times between 1.5 and 2 h, but the values were comparable after 3 h. Figure 1(b) shows the deposition time dependence of the overall bulk film composition for the ratios x = K/(K + Na) and (K + Na)/Nb: the latter remained at almost unity for all deposition times, as would be expected for a film solely containing phases of (KxNa1−x)NbO3 (deviation from this would potentially indicate the formation of secondary phases). However, the ratio between K and Na was not constant over the growth time, starting at around x = 0.75 at 1.5 h, followed by a sharp decrease to x = 0.56 at 3 h, after which the ratio remained constant. This behavior is consistent with the results in Fig. 1(a). Consequently, it can be ascertained that the distribution of K and Na elements is nonuniform in the direction normal to the substrate and is indicative of formation of two separate phases, as has previously been reported for growth of these films by this method.
Deposition time dependences of (a) deposition amount of Nb (closed circles), Na (closed squares), and K (closed squares) and (b) x = K/(K + Na) (closed circles) and (K + Na)/Nb (open circles).

Figure 2(a) shows the XRD θ–2θ patterns of films deposited for various growth times. The deposited films were identified as the {100}pc-oriented perovskite phase and there were no indications of the presence of impurity phases for any of the films: this result was expected from the composition analysis in Fig. 1(b) as the ratio (K + Na)/Nb = 1.00 for all films. From the x-ray pole figure measurement, the following epitaxial relationship between the films and substrate was ascertained: {100}pc(K, Na)NbO3//(100)Nb-doped SrTiO3.Reference Goh, Levi, Choi and Lange21
(a) XRD θ–2θ patterns of KxNa1−xNbO3 films deposited for various growth times and (b) enlarged view for the range 2θ = 44–47°. P1 and P2 indicate the {200}pc orientation of the deposited films.
Figure 2(b) shows the enlarged XRD θ–2θ patterns between 2θ = 44 and 47°. A single peak, labeled P1, located at around 45° was observed for the film deposited for 2 h; for films grown at times of 3 h and above, an additional peak was observed, at located around 46°—this is labeled as P2. From this, it was found that the peak positon of P1 shifted minutely to a high 2θ angle with increasing deposition time.
Figure 3(a) summarizes the deposition time dependence of the peak intensities of P1 and P2 integrated along the χ axis, the azimuth angle of the films, obtained from XRD θ–2θ patterns [see Figs. 4(a) and 4(b)]. The peak intensity of P1 increased with increasing deposition time, saturating at times above 3 h. On the other hand, the P2 peak was first detected at 3 h of growth and its intensity increased monotonically with increasing deposition time. Figure 3(b) shows the relative intensities of the P1 and P2 peaks described as In[P1]/{In[P1] + In[P2]} and In[P2]/{In[P1] + In[P2]}, respectively, where In[P1] and In[P2] are the peak intensities: whilst In[P1]/{In[P1] + In[P2]} was initially almost 100% at 2 h and decreased with increasing the deposition time. On the other hand, the P2 peak was detected at the time of 3 h and In[P2]/{In[P1] + In[P2]} increased with increasing deposition time.
Growth time dependencies of (a) peak intensities of XRD θ–2θ patterns, (b) intensity ratio of the P1 and P2 peaks, (c) lattice spacing of the P1 and P2 peaks, and (d) intensity ratio of the  ${\left\{ {{3 \over 2}0{1 \over 2}} \right\}_{{\rm{pc}}}}$ and P2 peaks. Closed circles, triangles, and squares in (a) show intensities of the P1, P2, and
 ${\left\{ {{3 \over 2}0{1 \over 2}} \right\}_{{\rm{pc}}}}$ peaks, respectively. Closed circles and triangles in (b) show In[P1]/(In[P1] + In[P2]) and In[P2]/(In[P1] + In[P2]), respectively. Closed circles and triangles in (c) show the lattice spacing of the P1 and P2 peaks, respectively.
χ–θ scans of the films deposited for (a) 2 h and (b) 5 h. (c) XRD θ–2θ patterns near  ${\left\{ {{3 \over 2}0{1 \over 2}} \right\}_{{\rm{pc}}}}$ spots observed in (b), integrated along the χ-axis between 2θ = 35 and 37°. Patterns include spots observed from both the film and the substrate.
To estimate the compositions of the two (KxNa1−x)NbO3 phases, the lattice spacing d 200 of the P1 and P2 peaks were plotted as a function of the deposition time, as shown in Fig. 3(c). The x values were estimated to be 0.75 (K-rich) and 0.36 (Na-rich), derived from the relationship between the x value and the unit cell volume.Reference Baker, Thomas, Zhang and Glazer29–Reference Ishizawa, Wang, Sakakura, Inagaki and Kakimoto34 The unit cell volumes of these films were calculated from the cubic phase lattice spacing measured at high temperature (not shown). The d 200 values for both P1 and P2 peaks were not observed to change with increasing deposition time, conveying that the composition of the two individual phases was approximately constant across each of the measured films.
To investigate the constituent phases of these films in more detail, XRD χ–2θ scans were carried out using a two-dimensional detector. Figures 4(a) and 4(b) show these scans of the films deposited for 2 and 5 h as the typical cases. A series of spots were observed at around 2θ = 22 and 46° on χ = 0°. As a comparison of these data with the results of the XRD θ–2θ scans shown in Fig. 2(a), the spots were assigned to the {100}pc and {200}pc orientations for both the hydrothermally grown film and the substrate. Noticeably, for films deposited for 5 h extra spots were observed at around 2θ = 36° and χ = ±23° as shown in Fig. 4(b). These spots were identified as  ${\left\{ {{3 \over 2}0{1 \over 2}} \right\}_{{\rm{pc}}}}$ and considered to originate from the Na-rich phase: this has previously been reported to arise from the oxygen octahedron rotation in the perovskite structure that is observed for compositions with x < 0.46 in the phase diagram of (KxNa1−x)NbO3.Reference Baker, Thomas, Zhang and Glazer29,Reference Schiemer, Withers, Liu and Yi35,Reference Baker, Thomas, Zhang and Glazer36
Further to this, it was concluded that both the  ${\left\{ {{3 \over 2}0{1 \over 2}} \right\}_{{\rm{pc}}}}$ and P2 peaks originated from this same phase. Firstly, in the χ axis-integrated XRD θ–2θ patterns in Fig. 4(c), the
 ${\left\{ {{3 \over 2}0{1 \over 2}} \right\}_{{\rm{pc}}}}$ peak was only detected for growth times above 3 h, and its intensity was observed to increase monotonically with increasing deposition time, as shown in Fig. 3(a): this change in intensity appeared to be very similar to that of the P2 peak, also shown in Fig. 3(a). Secondly, Fig. 3(d), which presents the change peak in the intensity ratio
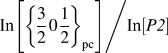 ${{{\rm{In}}\left[ {{{\left\{ {{3 \over 2}0{1 \over 2}} \right\}}_{{\rm{pc}}}}} \right]} \mathord{\left/ {\vphantom {{{\rm{In}}\left[ {{{\left\{ {{3 \over 2}0{1 \over 2}} \right\}}_{{\rm{pc}}}}} \right]} {{\rm{In}}\left[ {{\rm{P2}}} \right]}}} \right. \kern-\nulldelimiterspace} {{\rm{In}}\left[ {P\it2} \right]}}$ (where
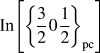 ${\rm{In}}\left[ {{{\left\{ {{3 \over 2}0{1 \over 2}} \right\}}_{{\rm{pc}}}}} \right]$ and In[P2] are the respective peak intensities) as a function of the deposition time, shows almost no change in this value for films deposited for times between 3 and 6 h. Thirdly, as shown in Figs. 3(a) and 4(a), for films grown for times <3 h, P1 was the sole observed diffraction peak: as such the
 ${\left\{ {{3 \over 2}0{1 \over 2}} \right\}_{{\rm{pc}}}}$ cannot be considered to originate from the same phase (K-rich). From these XRD measurements, it can be concluded that the films prepared with growth times between 3 and 6 h consisted of both the (K0.75Na0.25)NbO3 and (K0.36Na0.64)NbO3 phases.
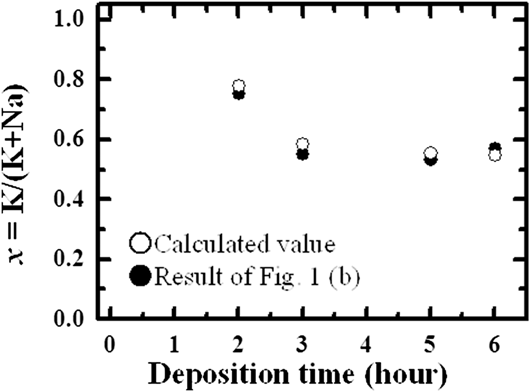
Figure 5 compares the time-dependent compositional data obtained by XRF (the “total” composition of the film, i.e., including both of these phases) with the estimated total composition derived from the peak intensities of P1 and P2 from the XRD data: these two data sets appear to be in good agreement, supporting the estimated compositions of the two observed phases.
Deposition time dependence of the overall K/(K + Na) ratio for the films: here, the values derived from XRD, estimated on the basis of the volume fraction of the two phases, are compared with those measured by bulk emission in XRF. Closed and open circles show the estimated (XRD) and measured (XRF) compositions, respectively.

To evaluate the distribution of these two phases throughout the film, the relationship between film thickness and the constituent material phases (as calculated from the XRD data presented in Fig. 3) is plotted in Fig. 6. Figure 6(a) shows the change in the deposition amount of each constituent phase as a function of the film thickness. The deposition amount of (K0.75Na0.25)NbO3 (corresponding to P1) was seen to increase with the film thickness up to a height of 4.6 μm, followed by saturation in thicker films. In contrast, deposition of (K0.36Na0.64)NbO3 (P2) was recorded to increase with increasing growth time for films thicker than 4.6 μm. Figure 6(b) shows the average deposition rate of each constituent phase, which is calculated by dividing the data in Fig. 6(a) by the deposition time, and Fig. 6(c) shows the average volume fraction of the deposited phase during the period. As expected from the previous data, only the (K0.75Na0.25)NbO3 phase was deposited between 0 and 1.2 μm as shown in Figs. 6(b) and 6(c). However, the average deposition rate of (K0.75Na0.25)NbO3 and (K0.36Na0.64)NbO3 phases became roughly equal between 1.2 and 4.6 μm, and the average volume fraction of (K0.75Na0.25)NbO3 and (K0.36Na0.64)NbO3 phases in this region was also the same as shown in Fig. 6(c). Finally, for films thicker than 4.6 μm, the (K0.36Na0.64)NbO3 phase dominated. As such, these results show that hydrothermal growth promotes the formation of the K-rich (K0.75Na0.25)NbO3 phase in the earlier growth stages of the film, followed by a drastic compositional change to (K0.36Na0.64)NbO3.
Film thickness dependence of (a) the deposition amount of the phases corresponding to the P1 peak [(K0.75Na0.25)NbO3] and P2 peak [(K0.36Na0.64)NbO3] calculated from XRD θ–2θ patterns, (b) the average deposition rate of each constituent phase, which is calculated by dividing the result of (a) by the deposition time during the period, and (c) the average volume fraction of each constituent phase, which was calculated during the period. Close circles and triangle in (a) and (c) show the P1 peak phase [(K0.75Na0.25)NbO3] and P2 peak phase [(K0.36Na0.64)NbO3], respectively.
B. Transmission electron microscopy (TEM) observation
Cross-sectional TEM images of these films were acquired to probe these two phases in more detail. Figure 7(a) shows cross-sectional bright field images of a (KxNa1−x)NbO3 film processed with a growth time of 6 h. The micrographs show that these films are dense: pores and cracks were not identified in these films. Figures 7(b) and 7(c) show respectively the selected area electron diffraction patterns measured from regions close to the top and bottom of the film [these are marked in Fig. 7(a)]. Diffraction spots originating from the out-of-plane {100}pc-oriented perovskite structure were observed in both diffraction patterns, confirming that this film was epitaxially grown on the substrate. However, the extra spots derived from  ${\left\{ {{3 \over 2}0{1 \over 2}} \right\}_{{\rm{pc}}}}$ were clearly observed in the top region of the film [in Fig. 7(b), as indicated by red arrows], but not in the lower region shown in Fig. 7(b). These diffraction data are consistent with the XRD analysis shown in Fig. 4.
(a) Cross-sectional TEM image of a film deposited for 6 h, alongside electron diffraction patterns measured at (b) upper region and (c) lower region of the films from the spots marked in (a). Red arrows show the position of extra spots.
Figure 8(a) shows a cross-sectional HAADF-STEM image of the same films observed in Fig. 7. Figures 8(b)–8(d) show respective EDS mapping of the characteristic x-rays of Nb–K, K–K, and Na–K. No significant contrast was detected in spatial mapping of Nb as shown in Fig. 8(b), suggesting that this element was uniformly distributed in the film. In contrast, nonuniform distribution of K and Na elements was observed as shown in Figs. 8(c) and 8(d); higher concentrations of K were detected in the lower region of the film [Fig. 8(c)], whereas higher concentrations of Na were detected in the upper region [Fig. 8(d)]. This profile is consistent with the results of the previously detailed compositional and crystal structure changes with the film growth time, shown in Figs. 1–4. Therefore, it can be established from these results that hydrothermal growth leads to the formation of (K0.75Na0.25)NbO3 in the lower regions of the film and (K0.36Na0.64)NbO3 closer to the film surface: this is represented schematically in Fig. 8(e). The phase boundary between (K0.75Na0.25)NbO3 phase and (K0.36Na0.64)NbO3 phase was estimated to occur at a film thickness of around 4 μm, in good agreement with the prediction shown in Fig. 6(c).
(a) Cross-sectional HAADF image of the film deposited for 6 h, the EDS mapping images of (b) Nb, (c) K, and (d) Na elements, and (e) schematic representation of the TEM measurements, showing the distinct boundary between the two material phases.
IV. DISCUSSION
Figure 9 shows the relationship between the overall film composition of (KxNa1−x)NbO3 films deposited at 240 °C for 6 h as a function of the molar ratio between KOH and NaOH, previously reported in Ref. Reference Shiraishi, Einishi, Yasui, Ishikawa, Hasegawa, Kurosawa, Uchida, Sakashita and Funakubo24; these data are plotted together with other reported data for hydrothermally synthesized (KxNa1−x)NbO3 powders and films.Reference Handoko and Goh22,Reference Sun, Xing, Chen, Deng, Li, Yu, Qiao and Liu27,Reference Su, Zhu, Qiu and Ji37–Reference Zhang, Han, Bai, Sun, Karaki and Adachi39 Noticeably, the trends in the overall film composition change with the [KOH]/{[KOH] + [NaOH]} molar ratio track very closely, despite differences in the processing conditions.
Dependence of the composition, x = K/(K + Na) in (KxNa1−x)NbO3 films versus the molar ratio [KOH] = {[NaOH] + [KOH]} of the growth solution. Filled symbols: our previously reported data for (KxNa1−x)NbO3 films.Reference Shiraishi, Einishi, Yasui, Ishikawa, Hasegawa, Kurosawa, Uchida, Sakashita and Funakubo24 Open symbols: reported data for (KxNa1−x)NbO3 powders and films.Reference Handoko and Goh22,Reference Sun, Xing, Chen, Deng, Li, Yu, Qiao and Liu27,Reference Su, Zhu, Qiu and Ji37,Reference Lv, Zhang, Guo, Li and Wang38
Although the averaged film composition was determined to be 0.56 in this study, as stated previously, the film was found to consist of two phases, with average x values of 0.75 (K-rich, red dashed line) and 0.36 (Na-rich, green dashed line), along with a sharp change in composition observed in both TEM and XRD analyses. However, [KOH]/{[KOH] + [NaOH]} molar ratio obtained that the phases with overall compositions of x = 0.75 and 0.36 correspond to the only slightly change from 0.86 to 0.84.Reference Shiraishi, Einishi, Yasui, Ishikawa, Hasegawa, Kurosawa, Uchida, Sakashita and Funakubo24
Based on these considerations, the mechanism behind this observed change in composition is proposed as follows: when the K-rich film is deposited during the initial stages of deposition, the [KOH]/{[KOH] + [NaOH]} ratio decreases slightly, resulting in the promotion of growth of the Na-rich composition. However, this explanation alone cannot fully account for the abrupt change in the composition, resulting in the bilayer-type structure.
To improve this change in the film composition, the Nb source was changed from a crystalline Nb2O5 powder to an amorphous one: the deposition rate increased 3-fold, perhaps due to the high solubility of the amorphous Nb2O5 powder in the solution. However, the bilayer structure was still observed in these films, although the average compositions of the two observed phases were not the same as those reported here. Handoko et al. reported that hydrothermally synthesized (KxNa1−x)NbO3 powders consisting of two perovskite phases with different x values were caused by the production of intermediate hexaniobate phases in early step of reaction process because Nb2O5 powder has different solubility in KOH and NaOH solutions.Reference Handoko and Goh40,Reference Handoko and Goh41 In addition, a composition of intermediate phases was dependent on [KOH]/{[KOH] + [NaOH]} ratio. This suggests that (KxNa1−x)NbO3 films with bilayer structure are prepared regardless of the kind of Nb2O5 powder. Therefore, the dissolution of the Nb source into solution is one of the key factors in determining the composition of these material phases: a small change in the [KOH]/{[KOH] + [NaOH]} ratio in the growth solution would also change the solubility of Nb2O5 precursor, inducing the observed change in film composition.
Further investigation is essential to understand the growth mechanism of these films by the hydrothermal method. This is also important for the enhancement of the material's piezoelectric properties as it is predicted that a film consisting of a single phase of (K0.5Na0.5)NbO3 would possess enhanced functional properties.
V. CONCLUSION
Epitaxial (K, Na)NbO3 films with a target composition containing K/(K + Na) = 0.56 were deposited on Nb-doped (100)SrTiO3 substrates at 240 °C by the hydrothermal method using growth times over a period of 1–6 h to investigate the formation of two separate material phases. From XRD measurements, the films were found to consist of separate (K0.75Na0.25)NbO3 and (K0.36Na0.64)NbO3 phases, as opposed to a single phase: as such, the overall bulk film composition as measured by XRF was found to be determined by the volume fractions of these two components. From TEM and STEM analyses, the two phases were found to exist in two distinct regions along the direction normal to the substrate, with a sharp boundary clearly observed around 4 μm. This behavior is unique to the hydrothermal growth method and is attributed to changes in the concentrations of precursor ions in the growth solution that occur with increasing deposition time.
ACKNOWLEDGMENTS
This research was partially supported by the Japan Society for the Promotion of Science (JSPS) through the “Funding Program for World-Leading Innovative R&D on Science and Technology (FIRST Program),” initiated by the Council for Science and Technology Policy (CSTP). A part of this research was supported by the Center for Integrated Nanotechnology Center at Tohoku University and also by Nanotechnology Network Project of the Ministry of Education, Culture, Sports, Science and Technology (MEXT) of Japan. T.S acknowledges the support provided by the Japan Society for the Promotion of Science (JSPS).