Implications
Very low values (up to 0.13) were estimated for the genetic correlations between production traits and boar’s semen traits. That means that selection on production traits (average daily gain and ultrasonically predicted lean meat content) will have only minor impact on semen traits.
Introduction
An important question in pig breeding is whether current selection for growth and leanness in pig is damaging semen quality. According to Robinson and Buhr (Reference Robinson and Buhr2005) there is not a lot of good information available on this issue. To answer this question, knowledge on the genetic correlations between production and semen traits is necessary. Estimates of genetic correlations were published by Grandjot et al. (Reference Grandjot, Brandt and Glodek1997) and Oh et al. (Reference Oh, See, Long and Galvin2006). In both the cited papers, correlations were estimated from average values for semen traits. This does not allow taking into account the boar’s permanent environmental effect and makes it difficult to consider further environmental effects affecting semen traits correctly. The objective of our investigation was therefore to estimate genetic correlations between production and semen traits from a large dataset taking into account the information of all relatives of the boars in production traits and using data from individual ejaculates.
Material and methods
Animals and traits
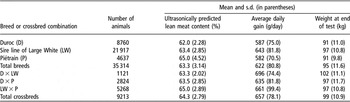
Animals from the breeds Duroc and Piétrain, from a sire line of Large White and from single crosses between these breeds were included in the analysis. Data on production traits and semen traits were available. The dataset for production traits (Table 1) contained records from the field performance test for both sexes. The field test for production traits started at an age of 80 to 88 days and lasted between 56 and 70 days. The weight at the beginning of the test was approximately 30 kg. The data were collected in the time period from 1995 to 2007. The traits analyzed were lean meat content (in %) at the end of the performance test, predicted from ultrasonic backfat and loin muscle measurements unadjusted for live weight and average daily gain from birth to the end of the field test (in g/day) calculated as weight at end of test divided by age at end of test.
Basic statistics of the dataset for production traits

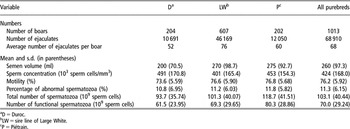
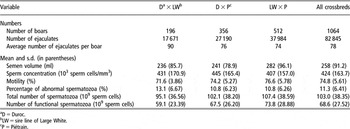
Data on semen traits from the years 2000 through 2007 were collected from 20 artificial insemination centers in the Czech Republic. The 151 755 ejaculates originated from 2077 boars of the same breeds and single crosses as above. The number of boars, number of ejaculates and average number of ejaculates per boar for each breed and crossbred combination are summarized in Tables 2 and 3, respectively. All boars with measurements for semen traits were also performance-tested for production traits.
Summary statistics for semen traits of purebred boars

aD = Duroc.
bLW = sire line of Large White.
cP = Piétrain.
Summary statistics for semen traits of crossbred boars

aD = Duroc.
bLW = sire line of Large White.
cP = Piétrain.
The following semen characteristics were measured on each ejaculate: semen volume or ejaculate volume (Vol) in ml (i.e. volume of the sperm-rich fraction) measured by graduated cylinder, sperm concentration (Con; in 1000 sperm cells per mm3) measured by photocolorimetry, motility (Mo; progressive motion of spermatozoa in per cent, i.e. proportion of sperm cells actively moving, evaluated microscopically) and percentage of abnormal spermatozoa (Ab; percentage of deformed sperm cells, also evaluated microscopically). The total number of spermatozoa in the ejaculate (N total, in 109 sperm cells) was calculated as

and the number of functional spermatozoa (N func, in 109 sperm cells) was estimated as (Smital et al., Reference Smital, De Sousa and Mohsen2004)

The number of functional spermatozoa is proportional to the number of extended doses per ejaculate and is therefore the most interesting trait from the point of view of semen production efficiency.
Statistical methods
For assessing the deviation of the data from the normal distribution, skewness (g 1) and kurtosis (g 2) were calculated using the formulae (SAS Institute Inc., 1988):
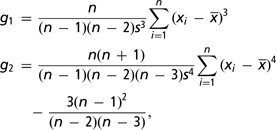
where n is the number of observations, s is the standard deviation, xi is the trait value for the ith measurement and  is the trait mean. If the data are normally distributed, both skewness and kurtosis should be zero.
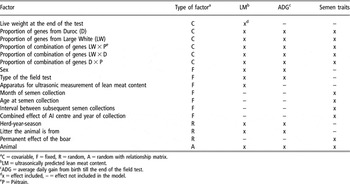
Because of the functional relationship between the total number of spermatozoa and the functional number of spermatozoa on the one hand and the four originally measured semen traits on the other hand, a joint analysis of all traits was not possible. Therefore, a six-trait animal model was calculated for the two production traits and the four directly measured semen traits (Vol, Con, Mo and Ab) and three-trait animal models were calculated for the production traits and one of the derived semen traits (N total, N func). The factors included in the models are given in Table 4. The models were equal for all semen traits and were similar between the production traits; however, they differed considerably between production and semen traits. Zero residual covariances were assumed between the complexes of production and semen traits.
Structure of the animal models

aC = covariable, F = fixed, R = random, A = random with relationship matrix.
bLM = ultrasonically predicted lean meat content.
cADG = average daily gain from birth till the end of the field test.
dx = effect included, – = effect not included in the model.
eP = Piétrain.
Linear regression on live weight was only included for ultrasonically predicted lean meat content, not for daily gain. Sex was considered as factor for production traits because both gilts and boars were tested for these traits. The factors ‘Type of field test’ and ‘Apparatus for ultrasonic measurement of lean meat content’ were used as there were some modifications of the field test over time and two different devices (PIGLOG; SFK Systems, Kolding, Denmark and SONOMARK; SONOMARK Ltd, Budapest, Hungary) were used for predicting the lean meat content.
A flexible allocation of records to herd-year-season classes was applied. For this purpose, a FORTRAN program was written. The principles for forming herd-year-season classes were as follows. Herd-year-season classes were preferably formed according to natural seasons and had normally a length of three months: March to May, June to August, September to November and December to February of the following year. With a small number of observations in the 3-month interval, the season was extended until the minimum number of 20 observations was reached. Herds with less than 20 observations were omitted. The procedure resulted in 998 herd-year-season classes. In total, 173 records (0.39%) representing 23 small herds (25% of all herds) were deleted. Both herd-year-season and the litter effect were assumed to be random factors. The average number of littermates was 3.37.
The model for semen traits was similar as in Wolf and Smital (Reference Wolf and Smital2009). The month of collection, boar’s age at collection and the interval between subsequent collections were important factors for these traits. To form age classes, each boar’s age in months at each collection was calculated. Ejaculates from animals less than 8 months of age or greater than 48 months were excluded from the dataset. Age classes with monthly intervals were used up to an age of 28 months. For animals aged between 29 and 38 months, 2-month intervals were formed. For animals over 38 months of age, the following 3 classes were formed: 39 to 41 months, 42 to 44 months and 45 to 48 months. For intervals between subsequent collections less than 11 days, classes were formed with an interval of 1 day. For intervals of 11 days and more, the following 3 classes were formed: 11 to 12 days, 13 to 15 days and 16 to 21 days. The first semen collection of each boar and semen collections with an interval of 1 day or more than 21 days, also were not included in the analyses. As the analyses were based on individual collections, a permanent effect of the boar was defined and included in the model.
Breed and heterotic effects in semen traits were defined in the same way as in production traits. Additive breed effects were estimated via regression on the proportion of genes from the individual breeds. The proportion of genes from the Piétrain breed was not included in the model, so that breed effects were defined as deviation from the effect of Piétrain. Heterotic effects were estimated via regression on the proportion of combinations of genes from two breeds. Further details on the estimation of breed and heterotic effects are given in Wolf et al. (Reference Wolf, Peškovičová, Žáková and Groeneveld2006).
Restricted maximum likelihood and optimization by a quasi-Newton algorithm with analytical gradients (Neumaier and Groeneveld, Reference Neumaier and Groeneveld1998) as implemented in VCE 5.0 program (Kovač et al., Reference Kovač, Groeneveld and García-Cortés2002) were used to estimate the variances and covariances. The pedigree was traced back to approximately the year 1985. Because of the high number of animals, an estimate of a genetic correlation was considered to be statistically significant from zero, if its absolute value was greater than twice the standard error.
Results
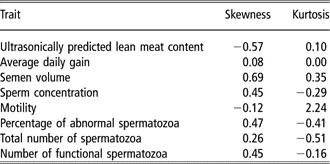
The skewness and kurtosis of all traits are given in Table 5. Because of the large number of observations (approximately 44 500 for production traits and more than 150 000 for semen traits), the deviation of all traits from the normal distribution is statistically significant. Nevertheless, the values of skewness and kurtosis are relatively low, so that the application of linear models will be justified.
Skewness and kurtosis for all traits

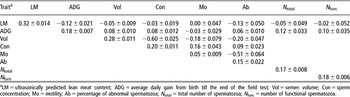
The estimates of heritabilities and genetic correlations between the two production traits and the six semen traits are summarized in Table 6. The estimates for production traits were equal for all three analyses. The genetic correlations between production and semen traits were low, the highest absolute value being 0.13. Nevertheless, because of the high number of animals, significant correlations were observed. Average daily gain had a statistically significant small favorable impact on traits connected with semen quantity (semen volume, sperm concentration, total number of spermatozoa and functional number of spermatozoa). However, an increase in daily gain had a slight unfavorable effect on the percentage of abnormal sperm.
Estimates of heritabilities and genetic correlations with standard errors

aLM = ultrasonically predicted lean meat content; ADG = average daily gain from birth till the end of the field test; Vol = semen volume; Con = sperm concentration; Mo = motility; Ab = percentage of abnormal spermatozoa; N total = total number of spermatozoa; N func = number of functional spermatozoa.
An increase in the ultrasonically predicted lean meat content caused a small decrease in semen volume (unfavorable effect), but also a decrease in percentage of abnormal sperm (favorable effect). Motility was independent of the production traits. The impact of ultrasonically predicted lean meat content on sperm concentration, the total number of spermatozoa and the functional number of spermatozoa was negligible.
Discussion
In the literature, herd-year-season is treated both as fixed and random factor. Estany and Sorensen (Reference Estany and Sorensen1995) and Frey et al. (Reference Frey, Hofer and Künzi1997) reported that the model with a random contemporary group effect yields more accurate predictions than the model with fixed contemporary group effects. Though a non-random distribution of contemporary groups over families leads to biased genetic evaluations, the latter authors could show that the prediction of observations was, in general, more accurate, using a model with random herd-year-season effects. Therefore, bias of predicted breeding values with random models was probably small. It is important to emphasize that this result was achieved on the basis of field data, where a significant non-random distribution of contemporary groups over families should be expected.
Genetic correlations between production and semen traits were estimated by Grandjot et al. (Reference Grandjot, Brandt and Glodek1997) and Oh et al. (Reference Oh, See, Long and Galvin2006). Average values of semen traits were used in both of these papers whereas measurements from individual ejaculates were used in our investigation. The advantage of using average values is a simplification of the numerical procedures. According to Oh et al. (Reference Oh, See, Long and Galvin2006), the heritabilities calculated for the average values of semen traits are identical to the repeatabilities for semen traits defined per collection, since permanent environmental effects were not separated in the model when using average values. Probably it would be more proper to replace ‘identical’ by ‘similar’.
Using data from individual ejaculates has the advantage that environmental factors acting on individual ejaculates and consequently influencing the average values of semen traits may be taken into account more precisely than when first adjusting for fixed effects and then calculating genetic parameters from mean values of semen traits. Field data show usually a high degree of non-orthogonality, so that the solution of the whole system of equations in one run is advantageous. Furthermore, the boar’s permanent effect may be separated from the additive genetic effect allowing for the calculation of heritabilities of semen traits defined per collection (ejaculate). The computational problems when using data on individual ejaculates are no more relevant today, so the use of data from individual ejaculates should be the method of choice.
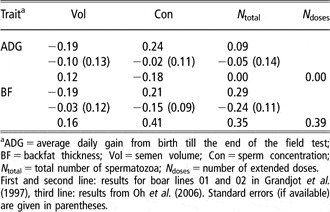
Genetic correlations between production and semen traits estimated by Grandjot et al. (Reference Grandjot, Brandt and Glodek1997) and Oh et al. (Reference Oh, See, Long and Galvin2006) are summarized in Table 7. Grandjot et al. (Reference Grandjot, Brandt and Glodek1997) estimated the genetic correlations between production and semen traits on two datasets with 192 and 174 observations (boars). Because of the low numbers of observations the estimated correlations have very high standard errors (given only for boar line 02) and differ considerably between the two datasets. Therefore it is difficult to draw unambiguous conclusions from these results. Oh et al. (Reference Oh, See, Long and Galvin2006) found that genetic correlations between average daily gain and semen traits were generally low and not different from zero and that genetic correlations between backfat thickness and semen traits (semen volume, sperm concentration, total number of spermatozoa and number of extended doses) were positive in sign; therefore, selection against backfat thickness (for high lean meat content) would have a negative effect on semen traits. The latter authors admit that the estimates of genetic correlations may be biased due to the inability to properly account for the boar’s permanent environmental effect.
Literature estimates for genetic correlations between production and semen traits

aADG = average daily gain from birth till the end of the field test; BF = backfat thickness; Vol = semen volume; Con = sperm concentration; N total = total number of spermatozoa; N doses = number of extended doses.
First and second line: results for boar lines 01 and 02 in Grandjot et al. (Reference Grandjot, Brandt and Glodek1997), third line: results from Oh et al. (Reference Oh, See, Long and Galvin2006). Standard errors (if available) are given in parentheses.
One reason for the low correlations between production and semen traits in our investigation may be that production traits were measured at an age of approximately 5 months already whereas semen traits were collected from 8 to 48 months of age. The backfat thickness (which is strongly related to lean meat content) at the time of semen collection will be probably different from the backfat thickness at the end of the test. Also the growth curve may continue in different ways after the end of the test. Therefore, it would be desirable to analyze data for production and semen traits, which are collected at the same time.
Our genetic correlation estimates of average daily gain and predicted lean content with the complex semen traits (the total number of spermatozoa per ejaculate and the number of functional ones) are either slightly favorable or not significantly different from zero, and close to zero in all cases. The correlation estimates with all other semen traits are close to zero as well. Selection on these production traits, particularly on a combination of them, will therefore have very small favorable effects on overall semen production efficiency.
Acknowledgements
Thanks are due to Jaroslav Smital, Prague Uhříněves, for valuable discussions and to the Pig Breeders Association of the Czech Republic for making the data available. The research was supported by the projects MZE 0002701401 and MZE 0002701404 of the Ministry for Agriculture of the Czech Republic.