INTRODUCTION
Coral reefs rely on a wide range of ecological processes, such as herbivory, bioerosion, recruitment and dispersal (Steneck Reference Steneck, Choat, Barnes, Borowitzka, Coll, Davies, Flood, Hatcher, Hopley, Hutchings, Kinsey, Orme, Pichon, Sale, Sammarco, Wallace, Wilkinson, Wolanski and Bellwood1988; Barnes & Chalker Reference Barnes, Chalker and Dubinsky1990; Harrison & Wallace Reference Harrison, Wallace and Dubinsky1990). Fishing on coral reefs can disrupt one or several of these processes and reduce reef resilience (Bellwood et al. Reference Bellwood, Hoey and Choat2003; Mumby et al. Reference Mumby, Dahlgren, Harborne, Kappel, Micheli, Brumbaugh, Holmes, Mendes, Broad, Sanchirico, Buch, Box, Stoffle and Gill2006, Reference Mumby, Harborne, Williams, Kappel, Brumbaugh, Micheli, Holmes, Dahlgren, Paris and Blackwell2007b). Coral reef resilience, the extent to which reefs can absorb recurrent natural and human perturbations and continue to regenerate without slowly degrading or unexpectedly flipping into alternate states (Nyström et al. Reference Nyström, Folke and Moberg2000; Hughes et al. Reference Hughes, Bellwood, Folke, Steneck and Wilson2005, Reference Hughes, Rodrigues, Bellwood, Ceccarelli, Hoegh-Guldberg, McCook, Moltschaniwskyj, Pratchett, Steneck and Willis2007), is critical for the long-term persistence of coral reefs by providing stability against external perturbations (Ives & Carpenter Reference Ives and Carpenter2007; Nyström et al. Reference Nyström, Graham, Lokrantz and Norström2008), such as storms, episodes of elevated seawater temperature and disease outbreaks. However, little is known about the critical levels of fishing intensity that may disrupt key processes that underpin coral reef resilience (Bellwood et al. Reference Bellwood, Hughes, Folke and Nyström2004; Mumby et al. Reference Mumby, Hastings and Edwards2007a).
Herbivory has been recognized as a particularly important reef process because it mediates competition between corals and benthic macroalgae (Burkepile & Hay Reference Burkepile and Hay2006; Mumby Reference Mumby2006) and influences patterns of algal community succession (McClanahan et al. Reference McClanahan, Sala, Stickels, Cokos, Baker, Starger and Jones2003). Herbivores (primarily fish and echinoderms) are not only important for suppressing algae, but also for removing them once they have become abundant (Edmunds & Carpenter Reference Edmunds and Carpenter2001; Bellwood et al. Reference Bellwood, Hughes and Hoey2006). Based on key ecological functions performed, herbivorous species can be organized into three functional groups referred to as excavators, scrapers and grazers (Bellwood Reference Bellwood1994). Excavators (sometimes referred to as bioeroders) are species that remove dead (and sometimes living) fragile coral framework, thereby eliminating unstable substratum that may break down when exposed to storms and hurricanes, leading to death of settled coral recruits (Bellwood & Choat Reference Bellwood and Choat1990; Bellwood et al. Reference Bellwood, Hoey and Choat2003). Scrapers remove algae and sediments by close cropping, which may facilitate settlement, growth and survival of corals and coralline algae (Mumby et al. Reference Mumby, Harborne, Williams, Kappel, Brumbaugh, Micheli, Holmes, Dahlgren, Paris and Blackwell2007b). Grazers feed directly on algae, thereby preventing them from overgrowing and out-competing corals (Glynn Reference Glynn and Dubinsky1990; Hughes Reference Hughes1994; McCook et al. Reference McCook, Jompa and Diaz-Pulido2001).
Small-scale artisanal fisheries can have significant impacts on coral reefs by altering benthic habitats (for example through the use of beach seines and gill nets; Mangi & Roberts Reference Mangi and Roberts2006), fish-community structure (species richness and abundance; Russ & Alcala Reference Russ and Alcala1996) and trophic relationships (Wing & Wing Reference Wing and Wing2001). These changes may be propagated through the ecosystem, altering ecosystem processes which may generate unforeseen cascading effects. For example, removal of the predatory triggerfish Balistapus undulatus and Rhinecanthus aculeatus by small-scale fisheries is related to high abundances of the sea urchin Echinometra mathaei on Kenyan reefs (McClanahan & Shafir Reference McClanahan and Shafir1990), and under such conditions bioerosion may exceed reef accretion, forcing the reef towards a degraded sea urchin barren state (Eakin Reference Eakin1996; Norström et al. Reference Norström, Nyström, Lokrantz and Folke2009). In Fiji, a cascading effect of the coral-eating crown-of-thorns starfish has been attributed to predatory reef fish removal by subsistence exploitation (Dulvy et al. Reference Dulvy, Freckleton and Polunin2004a). A consequence of such cascading effects could be the loss of coral cover, coralline algae and eventually structural complexity, shifting the reef system into dominance by non-reef building taxa, such as algal communities.
Herbivores are susceptible to gears used by artisanal fisheries (Munro Reference Munro and Munro1983; Rakitin & Kramer Reference Rakitin and Kramer1996; McClanahan & Cinner Reference McClanahan and Cinner2008) and their functional contribution in overfished coral reefs can be severely compromised. Across several Caribbean island nations subjected to varying artisanal fishing pressure, abundances of important herbivorous fish families are substantially lower at higher fishing pressure and fishing intensity is positively correlated with coral decline and increased cover of macroalgae (Hawkins & Roberts Reference Hawkins and Roberts2004). Overfishing of herbivorous fish can precipitate macroalgal blooms by reducing the potential grazing intensity on affected reefs (Mumby et al. Reference Mumby, Hastings and Edwards2007a); extensive algal colonization and proliferation following a coral mass mortality event (such as mass bleaching) can overwhelm the grazing capacity of an overexploited herbivorous standing stock, resulting in fleshy macroalgal dominance (Hughes Reference Hughes1994; Williams et al. Reference Williams, Polunin and Hendrick2001).
Knowing when key ecosystem processes such as herbivory are approaching critically low levels is important because it could provide resource managers with an opportunity to avoid unforeseen and potentially persistent ecosystem changes (Carpenter et al. Reference Carpenter, Westley and Turner2005; Nyström et al. Reference Nyström, Graham, Lokrantz and Norström2008). Interpreting the status of ecosystem processes and detecting possible collapses generally require detailed long-term data (Carpenter & Brock Reference Carpenter and Brock2006; Scheffer & van Nes Reference Scheffer and van Nes2007), yet such data rarely exist in developing countries and alternative approaches are therefore required (Nyström et al. Reference Nyström, Graham, Lokrantz and Norström2008). In this context, using marine reserves and gradients of fishing pressure as loosely controlled large-scale experiments may offer some insights into the relative impacts of artisanal fishing (see Dulvy et al. Reference Dulvy, Polunin, Mill and Graham2004b; Graham et al. Reference Graham, Wilson, Jennings, Polunin, Bijoux and Robinson2006; McClanahan et al. Reference McClanahan, Marnane, Cinner and Kiene2006; Mumby et al. Reference Mumby, Dahlgren, Harborne, Kappel, Micheli, Brumbaugh, Holmes, Mendes, Broad, Sanchirico, Buch, Box, Stoffle and Gill2006).
This study aims to assess the potential vulnerability of herbivory (fish and sea urchins) on five coral-dominated reefs subject to differing fishing pressures on the western side of Zanzibar Island (Tanzania). We examined whether herbivore species richness, abundance, diversity, biomass and demographic structure differed with differences in fishing intensity. Since the relationship between species and ecosystem processes is poorly understood, fish were analysed with regards to their functional traits as functional groups (Steneck Reference Steneck and Levin2001). This approach provides a mechanistic link between species and their impacts on ecosystem processes (see Bellwood et al. Reference Bellwood, Hughes, Folke and Nyström2004; Graham et al. Reference Graham, Wilson, Jennings, Polunin, Bijoux and Robinson2006; Burkepile & Hay Reference Burkepile and Hay2008; Nyström Reference Nyström2006; Nyström et al. Reference Nyström, Graham, Lokrantz and Norström2008).
METHODS
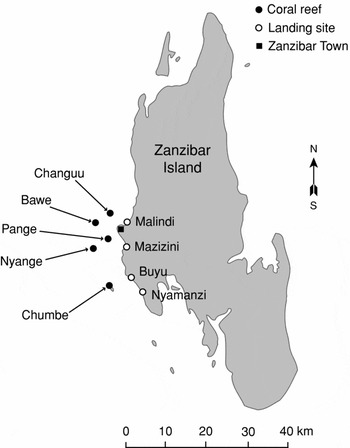
The study was carried out between November and December 2004 (collection of ecological data) and between October and November 2006 (collection of fishing data), and includes five coral reef sites located along the western coast of the island of Zanzibar (Tanzania) (Fig. 1). There was a temporal mismatch between collections of ecological and fisheries data for logistic reasons, hence ‘time’ was a potential confounding factor in our results. However, interviews with households and fishers showed there had been no change in fishing practices during these years, suggesting ‘time’ would have had limited impact. All investigated reefs were similar in physical structure; they were fringing small islands or sandbanks stretching from the water surface to the bottom at approximately 10 m depth. The reefs were exposed to various anthropogenic stressors, including sedimentation, nutrient-rich land runoff and overfishing. Although data are scarce, nutrient levels seemed to differ little among the reefs (Björk et al. Reference Björk, Mohammed, Björklund and Semesi1995). Four of the sites, namely Nyange, Changuu, Bawe and Pange, are open to fisheries, whereas Chumbe Island Coral Park (hereafter Chumbe) is a well-established ‘no-take’ marine reserve. Chumbe (6° 16′ 46″ S, 39° 10′ 32 ″ E) is situated 5 km from shore, was designated as a reserve in 1994 and has since been continuously supervised by rangers (Riedmiller Reference Riedmiller, Dight, Kenchington and Baldwin1998). Nyange (6° 13′ 04″ S, 39° 08′ 56″ E) is located 8 km from the shore of Zanzibar and is mainly accessible by larger fishing boats, whereas Changuu (5 km, 6° 06′ 54″ S, 39° 09′ 58″ E), Bawe (5 km, 6° 09′ 11″ S, 39° 08′ 34″ E), and Pange (3 km, 6° 11′ 05″ S, 39° 09′ 37″ E) are within one-day range of smaller fishing vessels, such as dugout canoes (mtumbwi).
Map showing Zanzibar Island, the five study reefs and adjacent landing sites where fishing practices were examined.

Fishery survey
Fishing practices were examined at 10 landing sites adjacent to the study reefs (Fig. 1), five near the Changuu and Bawe reefs (Malindi, Kizingo, Mtoni, Forodhani and Maruhubi, hereafter referred to as Area 1), two near the Pange and Nyange reefs (Mazizini and Kilimani, hereafter referred to as Area 2) and three near Chumbe (Buyu, Nyamanzi and Chukwani, hereafter referred to as Area 3) (Jiddawi & Khatib Reference Jiddawi and Khatib2008). At least one landing site from each area was sampled (Buyu, Nyamanzi, Mazizini and Malindi).
Buyu and Nyamanzi are relatively small coastal communities (90 and 220 households, respectively). At these sites, 45 and 49 systematic household surveys, respectively, were conducted to examine resource-use practices. Fishing effort was estimated by asking household respondents to estimate the average number of days per week that each member of the household typically engaged in fishing. Respondents reported the proportion of time spent using different gear types. Seasonal variations were averaged to obtain a general estimate for the entire year and multiplied by the total number of households in each community. For the purpose of the analysis, fishing effort in relation to pelagic species (pelagic handlines, pelagic gill nets and trolling) was removed. To extrapolate to Chukwani, total reef fishing effort was divided in the two villages by the total number of fishing vessels in both villages (Jiddawi & Khatib Reference Jiddawi and Khatib2008) to obtain the average number of trips per week per vessel. The average number of fishing trips was multiplied by the total number of fishing vessels in Chukwani (Jiddawi & Khatib Reference Jiddawi and Khatib2008).
Mazizini and Malindi are highly urbanized areas with migrant fishing camps, and household-focused surveys were not practical. Instead, one individual fisher from each boat for one-third of the fishing vessels in Mazizini and half of the vessels in Malindi were surveyed. As with the household surveys, gears used and the average number of trips per week were examined, taking into account seasonal variations in fishing practices. The mean reef fishing effort per vessel in Mazizini was multiplied by the total number of vessels in Mazinini and Kilimani to estimate fishing effort in Area 2 (Pange and Nyange). Likewise, the mean reef fishing effort in Malindi was multiplied by the total number of vessels in Malindi, Kizingo, Mtoni, Forodhani and Maruhubi to estimate fishing effort in Area 3 (Changuu and Bawe).
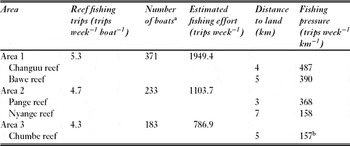
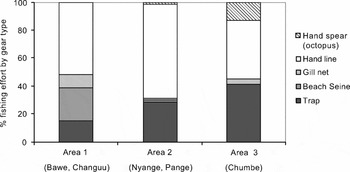
Once fishing effort was established for the three areas, data on distance to shore for the investigated reefs were incorporated (fishing effort/distance to shore) in order to establish the fishing pressure for the individual reefs (Table 1). The fishing pressure obtained for the protected Chumbe reef is in reality much lower (owing to its reserve status), and for the correlation analysis we therefore assigned it the value of 0 (i.e. having no fishing pressure). It should be noted that fishers in Zanzibar tend to be highly mobile and are not necessarily restricted to reefs close to home, but survey responses and key informant interviews suggest that, because of fuel costs and long travel times required by sail, much of the of day-to-day fishing effort is concentrated within 1.5–2 km of the landing site. To discern potential differences in fishing practices between areas, we separated data by gear type (Fig. 2).
Fishing intensity in three areas adjacent to the five study reefs and fishing pressure on the individual reefs based on surveys among households and fishers. Fishing effort was calculated by multiplying mean reef fishing trips per week per boat by the number of boats in the area. Fishing pressure was calculated by dividing fishing effort by distance to land. aSource: Jiddawi & Khatib (Reference Jiddawi and Khatib2008). bChumbe is a well protected no-take zone and the actual fishing pressure is most likely much lower.

Proportion of fishing effort by gear type in each reef area. Darker colours (gill net, beach seine and trap) are gears which target herbivores (Cinner et al. Reference Cinner, McClanahan, Graham, Pratchett, Wilson and Raina2009).

Ecological survey
Species richness, abundance and size (to the nearest 5 cm) of herbivorous fish and sea urchin predators (abundance only) were surveyed using 5 × 50 m belt transects placed haphazardly between 3 and 8 m depth parallel to the reef crest (n = 10). Owing to difficulties of identifying very small fishes to species level, only individuals ≥ 5 cm were included in the study. Sea urchin abundance was measured in 10 m2 randomly located plots (n = 20). The benthic community structure was described using a second set of 50 m transects placed haphazardly, but parallel to the reef crest at depths between 3 and 8 m (n = 10) (line-intercept transect method; English et al. Reference English, Wilkinson and Baker1997). We sorted the benthic community into ten categories: live coral (scleractinian corals), coralline algae, macroalgae, turf algae, dead coral, soft coral, corallimorpharians, sediment, sand and other (including ascidians and sponges). The percentage cover of each benthic category was estimated by calculating the fraction of the transect length that was intercepted by that category.
Herbivorous fish were classified with respect to their feeding behaviour, following the classification of Bellwood (Reference Bellwood1994) into grazers, scrapers and excavators (the full dataset is provided in Appendix 1, see Supplementary material at URL http://www.ncl.ac.uk/icef/EC_Supplement.htm). Fish species recorded were members of the families Acanthuridae (surgeonfishes), Scaridae (parrotfishes), Siganidae (rabbitfishes) and Kyphosidae (sea chubs) (Appendix 1, see Supplementary material at URL http://www.ncl.ac.uk/icef/EC_Supplement.htm). Although some of the species within these families contribute to other functions as well (for example the Kyphosidae family may sometimes be planktivores), they were treated as herbivores (Horn Reference Horn1989; Choat et al. Reference Choat, Clements and Robbins2002). Sea urchins were categorized as a separate group since their functional impact changes with abundance (Carpenter Reference Carpenter1981; McClanahan & Shafir Reference McClanahan and Shafir1990; Eakin Reference Eakin1996). Sea urchin predators recorded were members of the families Balistidae, Labridae and Tetraodontidae with a feeding preference for sea urchins (Appendix 2, see Supplementary material at URL http://www.ncl.ac.uk/icef/EC_Supplement.htm).
Functional group species richness, abundance, diversity (calculated as Shannon index H’), biomass and size-class distribution were calculated. Biomass estimates for each species were calculated by converting length data into weight using length-weight conversion equations from the literature (Appendix 1, see Supplementary material at URL http://www.ncl.ac.uk/icef/EC_Supplement.htm). Since some equations were based on fork length or standard length, these had to be converted into total length using morphological data from FishBase (Froese & Pauly Reference Froese and Pauly2005) (Appendix 1, see Supplementary material at URL http://www.ncl.ac.uk/icef/EC_Supplement.htm). Owing to large differences in maximum length between species within the same functional group (excavators and scrapers ranged between 30 and 90 cm in maximum length, grazers between 20 and 100 cm), size-class distribution was calculated as per cent of maximum length for each species, based on data obtained from FishBase (Froese & Pauly Reference Froese and Pauly2005). Subsequently, fishes were grouped into five relative size classes: 1–20%, 21–40%, 41–60%, 61–80% and 81–100%.
Data analysis
The Spearman Rank Correlation Coefficient was used to investigate relationships between ecological data and fishing pressure. Differences in fish species richness, numerical abundance, diversity and biomass between reefs were analysed using one-way ANOVAs, and Tukey's HSD tests for post hoc comparisons. All data were tested for normality and homogeneity of variance through graphical representation of residuals and Cochran's C-test. To meet the assumptions of the ANOVA, species richness of grazer, excavator abundance and biomass, and scraper abundance and biomass were square-root transformed, whereas grazer abundance and biomass were log transformed. Sea urchin abundance data did not meet these assumptions and were therefore analysed using non-parametric Kruskal-Wallis median tests, followed by a posteriori comparisons using mean ranks of all pairs of groups. All univariate analyses were performed using Statistica v.7.1 (StatSoft).
Benthic data were compiled into a square matrix (% cover of benthic categories × transects) and converted into a similarity matrix by calculating the Bray-Curtis similarity index between all transect-pairs, based on joint benthic category covers. To test differences between sites in the similarity matrix, a one-way analysis of similarities (ANOSIM) was conducted. Similarity percentages analysis (SIMPER) was used to determine the contribution that each benthic category made to the average dissimilarity in benthic assemblage composition between the five reef sites. The above statistical testing used the PRIMER 6 for Windows v6.1.5 (PRIMER-E Ltd) software package.
RESULTS
Mean fishing effort ranged from 4.3 (fishing trips boat−1 week−1) in Area 1 (Chumbe) to 5.3 in Area 3 (Changuu and Bawe) (Table 1). The number of boats in each area also varied considerably, from 183 to 371, and fishing effort decreased from the north to the south (Table 1). The proportion of reef fishing effort potentially targeting herbivores (gill nets, beach seine and traps) was relatively consistent across the fisheries sampled in Areas 1 (45%) and 3 (48%), but was slightly lower in Area 2 (30%) (Fig. 2).
Reef-specific fishing pressure (fishing effort/distance to shore) also declined from north to south. There was a negative correlation between reef-specific fishing pressure and herbivore biomass (r = −0.60, p < 0.05, n = 5), abundance (r = −0.64, p < 0.05, n = 5), species richness (r = −0.62, p < 0.05, n = 5) and species diversity (r = −0.61, p < 0.05, n = 5). There was also a strong positive correlation between fishing pressure and sea urchin abundance (r = 1.0, p < 0.05, n = 5), and a strong negative correlation between sea urchin density and grazing fish abundance (r = −0.9, p < 0.05, n = 5).
Excavating herbivores
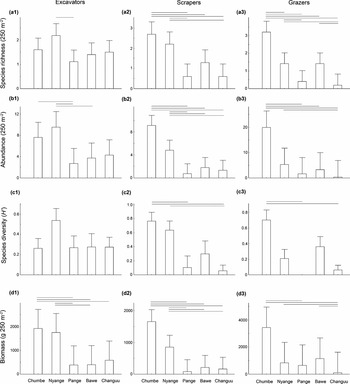
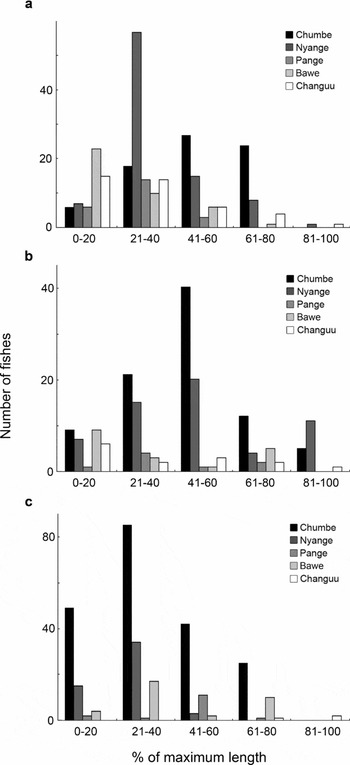
In total, four excavating fish species were recorded on the investigated reefs. Among these excavators, larger fish predominated on Chumbe, distinguishing this assemblage from that on Nyange, where abundance and biomass were also high. Excavators showed little variation among the investigated reefs with respect to species richness, and the only difference was found between Nyange (2.2 species per 250 m2) and Pange (1.1 species per 250 m2) (F1,4 = 2.84, p < 0.05, Tukey's test p < 0.05 for all comparisons; Fig. 3a1). The excavator numerical abundance pattern was more complex. Nyange had more bioeroding fishes compared to both Pange and Bawe, and Chumbe displayed a higher abundance than Pange (F1,4 = 5.34, p < 0.01, Tukey's test p < 0.05 for all comparisons; Fig. 3b1). Species diversity (H′) revealed no difference among the reefs (Fig. 3c1). Nyange showed no difference in biomass from the previous pattern whereas Chumbe displayed a significantly higher biomass of excavators compared to the three most accessible reefs (Pange, Bawe and Changuu) (F1,4 = 7.43, p < 0.001, Tukey's test p < 0.05 for all comparisons; Fig. 3d1). No differences between Chumbe and Nyange were observed until size class distribution was added to the analysis. While the excavator community in Chumbe was primarily dominated by individuals in the second and third largest size class (67% of all fish recorded on Chumbe [n = 76] were within 41–80% of maximum length), smaller fishes maintained the function in Nyange (65% of all fish recorded [n = 96] were within 21–40% of maximum length) (Fig. 4).
Mean (± SE) species richness (a1–3), abundance (b1–3), species diversity (c1–3), and biomass (d1–3) of fish excavators, scrapers and grazers in five reefs outside Zanzibar Island. Horizontal bars above graphs indicate significant differences (p < 0.05) among reefs.

Size class distribution of (a) fish excavators, (b) scrapers and (c) grazers in five reefs outside Zanzibar Island.

Scraping and grazing herbivores
Among scrapers and grazers, the results were less clear than for excavators, but in general there were more species, higher abundance and species diversity, and a larger biomass of scrapers and grazers on Chumbe than on the four fished reefs. Both functional groups were dominated by intermediate and small sized fishes on all reefs. In total, 14 grazing species and 7 scraping species were recorded on the investigated reefs. With respect to scrapers, species richness (F1,4 = 9.48, p < 0.001; Fig. 3a2), abundances (F1,4 = 17.35, p < 0.001; Fig. 3b2), species diversity (F1,4 = 5.31, p < 0.001; Fig. 3c2) and biomass (F1,4 = 18.06, p < 0.001; Fig. 3d2) varied significantly between the reefs. Chumbe and Nyange possessed higher species richness, abundance and biomass (Tukey's test p < 0.05 for all comparisons). The only exception was between Nyange and Bawe with regards to species richness, where no significant difference was found. With regards to species diversity, Chumbe displayed higher species diversity than Pange and Changuu, and Nyange higher than Changuu (Tukey's test p < 0.05 for all comparisons). The size-class distribution showed that middle-sized fishes (41–60% of maximum length) were most abundant in Chumbe and Nyange whereas a more homogenous distribution was found on the other reefs (Fig. 4).
Grazer species richness (F1,4 = 15.45, p < 0.001; Fig. 3a3), abundance (F1,4 = 11.55, p < 0.001; Fig. 3b3), species diversity (F1,4 = 8.50, p < 0.01; Fig. 3c3) and biomass (F1,4 = 9.29, p < 0.001; Fig. 3d3) differed significantly between reefs. Chumbe displayed higher grazer species richness than all the other reefs (Tukey's test p < 0.05 for all comparisons), as well as higher abundance compared to Pange, Bawe and Changuu (Tukey's test p < 0.01 for all comparisons), and higher H′ and biomass than Pange and Changuu (Tukey's test p < 0.05 for all comparisons). Nyange contained more species than both Pange and Changuu, and had higher abundance and biomass than Changuu (Tukey's test p < 0.05 for all comparisons). Moreover, Bawe displayed higher species richness and biomass than Changuu (Tukey's test p < 0.01 for all comparisons) With regards to the size class distribution there were very few fishes in the largest size class (81–100% of maximum length) on any of the reefs. Whereas Chumbe and Nyange were dominated by grazers in the second smallest size class (21–40% of maximum length), the patterns were more obscure for the three most accessible reefs (Fig. 4).
Benthos, sea urchins and sea urchin predators
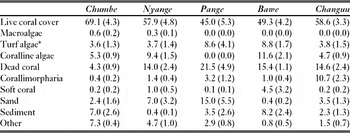
All reefs were dominated by scleractinian corals and exhibited very low macroalgal cover (Table 2). Turf algae were recorded on all sites (varying between 3.3 and 8.7%), but they were almost exclusively found within Pomacentridae territories. Benthic community structure differed significantly between the five reef sites (ANOSIM R = 0.493, p = 0.001), and site versus site pairwise ANOSIM testing differences were significant (all R > 0.4). Benthic categories that contributed most to the discrimination between the four fished sites were corallimorpharians, sediment, turf algae, sand and coralline algae (Appendix 3, see Supplementary material at URL http://www.ncl.ac.uk/icef/EC_Supplement.htm). Dissimilarities between Chumbe and the fished sites were explained by the high cover of dead coral in fished sites, although differences in corallimorpharian, sediment, sand and coralline algal cover also contributed (Appendix 3, see Supplementary material at URL http://www.ncl.ac.uk/icef/EC_Supplement.htm).
Mean (± SE) per cent contribution of substrate types to the total benthic cover at each reef, based on 50 m transects (n = 10) presented in order of increasing fishing pressure (Chumbe lowest, Changuu highest). *Turf algae not smothered by sediment.

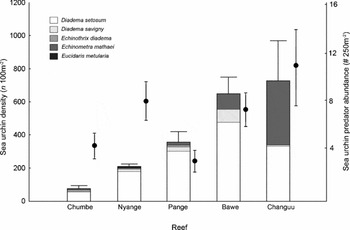
There was a significant difference between reefs with respect to sea urchin density (Kruskal-Wallis test p < 0.001) (Fig. 5). Chumbe had fewer sea urchins than all other reefs and Nyange had fewer sea urchins than Bawe (p < 0.05 for all comparisons). The difference between Chumbe and Changuu was approximately tenfold (7.4 and 72.8 sea urchins per 10 m2, respectively). Diadema setosum was the dominant species on all reefs except on Changuu, where the sea urchin community was dominated by Echinometra mathaei. There was no difference between reefs with respect to sea urchin predator abundance (Fig. 5).
Mean (± SE) density and species composition of sea urchins (n = 20) and sea urchin predator abundance (black circles) (n = 10) in five reefs outside Zanzibar Island.

DISCUSSION
Although the reefs in the present study showed no signs of macroalgal takeover (macroalgal cover < 0.5%), the herbivore assemblage is probably being impacted by the artisanal fishery. The fishing pressure gradient, with pressure increasing towards the north and close to shore was expected, since the highly populated Zanzibar Town lies in the northern part of the study area and reef fishing is mainly artisanal and based predominantly on traditional or low-tech vessels with restricted range (Jiddawi & Öhman Reference Jiddawi and Öhman2002).
While biophysical processes such as current and sedimentation may have an influence on the observed fish-community structures (see Shaghude et al. Reference Shaghude, Wannäs and Mahongo2002), the relatively small geographic scale of the study and the similar biophysical characteristics of the five sites (see Methods) suggests such differences to be small. The investigated reefs differed with regards to benthic community structure, with a higher cover of dead coral on fished reefs, compared to Chumbe. Crown-of-thorns starfish outbreaks in 2004 may be the primary driver of higher coral mortality on the fished reefs (Muthiga et al. Reference Muthiga, Costa, Motta, Muhando, Mwaipopo, Schleyer and Wilkinson2008), although destructive fishing practices currently employed in the area, such as nets placed directly on the reef and fishers crushing corals while navigating their boats with long poles (personal observation 2004), are also likely to play a role. It is possible that these differences in benthic community structure could be driving the observed patterns in herbivorous fish assemblages. Studies have shown that the loss of live coral can influence abundances of specialist species that have one or more life-stages dependent on live coral (Jones et al. Reference Jones, McCormick, Srinivasan and Eagle2004; Wilson et al. Reference Wilson, Graham, Pratchett, Jones and Polunin2006). Herbivorous fish assemblages, however, have been reported to exhibit no change or slight increases in abundance or biomass in studies on the short-term impact of live coral loss (Lindahl et al. Reference Lindahl, Öhman and Schelten2001; McClanahan et al. Reference McClanahan, Maina and Pet-Soede2002; Sano Reference Sano2004). We argue that present day fishing pressure provides the most parsimonious explanation behind our results in relation to herbivory.
Species richness of excavators differed little between the investigated reefs, however, excavator abundance and biomass data indicate that bioerosion on the reefs with highest fishing pressure (Pange, Bawe and Changuu) relies on fewer individuals with a lower total biomass. Species richness by itself seems an inadequate indicator of functional group performance. Considering size-class distribution of excavators, the Chumbe reserve and Nyange seem similar in their composition (species richness, abundance and biomass), however size-class distributions with regards to maximum species length differed between the two reefs (Fig. 4). While excavators in Chumbe were dominated by fishes in the second and third largest size classes (41–80% of maximum size), smaller fishes were dominant in Nyange (21–40% of maximum size). Despite the difference in size structure, total excavator biomass did not differ significantly. Nyange exhibited a much higher abundance of smaller-sized individuals. This could reflect differences in the bioeroding function between the two reefs, since the capacity of fish bioeroders to modify coral reef substratum is size related (Bruggemann et al. Reference Bruggemann, Kessel, van Rooij and Breeman1996; Bonaldo & Bellwood Reference Bonaldo and Bellwood2008). Similarly, Lokrantz et al. (Reference Lokrantz, Nystrom, Thyresson and Johansson2008) showed a non-linear relationship between parrotfish size and scraping impact, arguing that reefs may be functionally impaired despite having abundant small fish. In addition, reduced size of species can potentially have other, more subtle influences on ecosystem functioning (Birkeland & Dayton Reference Birkeland and Dayton2005). For example, larger individuals tend to produce more eggs that are of higher quality (Berkeley et al. Reference Berkeley, Chapman and Sogard2004; Evans et al. Reference Evans, Russ and Kritzer2008), guide young individuals to spawning aggregations (Petersen & Warner Reference Petersen, Warner and Sale2002) and affect sex ratio in fish populations that undergo sex-change (for example parrotfishes), which in turn can impact the fertilization rate (Petersen & Warner Reference Petersen, Warner and Sale2002). Hence, the demographic structure within functional groups could potentially have significant implications for the capacity of coral reefs to develop and recover from environmental crisis (Nyström et al. Reference Nyström, Graham, Lokrantz and Norström2008).
All reefs exhibited low grazer species richness, abundance, species diversity and biomass in comparison with the Chumbe reserve; the levels were similar to those of other reefs suffering from high fishing pressure (Jennings et al. Reference Jennings, Grandcourt and Polunin1995). An expected effect of low grazer levels would be a higher abundance of algae in Nyange, Pange, Bawe and Changuu, however macroalgae and turf algae were scarce (Table 2). There could be several reasons for this. The grazing intensity may be high enough to control the algae, owing to the high coral cover observed at all sites. Fish grazing can be expected to intensify as the coral cover and other ungrazeable substrate increases, even if the number of herbivorous fish remains constant (Williams et al. Reference Williams, Polunin and Hendrick2001; Mumby et al. Reference Mumby, Hastings and Edwards2007a). Herbivory may also be maintained through a shift in functional dominance from herbivorous fish to other organisms, for example through release from competitors or predators. There is accumulating evidence for sea urchin- and starfish-mediated cascades on coral reefs (Pace et al. Reference Pace, Cole, Carpenter and Kitchell1999; McClanahan et al. Reference McClanahan, Polunin and Done2002; Dulvy et al. Reference Dulvy, Freckleton and Polunin2004a). Our study showed a strong positive correlation between fishing pressure and sea urchin abundance. It is plausible that at Pange, Bawe and Changuu, sea urchins have taken over as key organisms within the grazing functional group, making these reefs vulnerable to sea urchin disturbances like diseases (Lessios Reference Lessios1988) and overexploitation (Berkes et al. Reference Berkes, Hughes, Steneck, Wilson, Bellwood, Crona, Folke, Gunderson, Leslie, Norberg, Nyström, Olsson, Österblom, Scheffer and Worm2006). Even if sea urchins can functionally substitute for herbivorous fish, their ecological impacts are complex and may vary with their abundance (Nyström Reference Nyström2006). Moreover, while excavating parrotfishes reduce fragile coral structures (Bellwood et al. Reference Bellwood, Hughes, Folke and Nyström2004), bioerosion caused by sea urchins differs markedly in the sense that they can increase instability of the reef as they erode the reef matrix.
Nyange is exceptional in having low algal cover despite a relatively low standing stock of both grazing fish and sea urchins. The abundance of sea urchins and functional overlap between grazers and scrapers may be high enough to suppress algal growth. Also, despite the low standing stock of grazers, the limited amount of open substrate (14%) may result in a grazing pressure that is sufficient to control macroalgal abundances.
The three reefs with highest fishing pressure displayed archetypical signs of overfishing, such as a low standing stock and virtual absence of fishes in the largest size class (Graham et al. Reference Graham, Dulvy, Jennings and Polunin2005). Compared to other areas (Hoey & Bellwood Reference Hoey and Bellwood2008), the Zanzibar reefs exhibited an extremely low biomass of both scrapers and excavators. Even the protected Chumbe and remote Nyange showed signs of degradation because the largest size-class of fish was absent. This could be owing to a mismatch in scales between the size of the protected area and the home range of these fishes; the Chumbe marine park spans c. 500 m along the shore, whereas many coral reef fish species move over several kilometres (Kaunda-Arara & Rose Reference Kaunda-Arara and Rose2004). The strong negative relationship between herbivorous fish biomass and macroalgal cover observed in the Caribbean (Lewis Reference Lewis1986; Williams & Polunin Reference Williams and Polunin2001; Mumby et al. Reference Mumby, Dahlgren, Harborne, Kappel, Micheli, Brumbaugh, Holmes, Mendes, Broad, Sanchirico, Buch, Box, Stoffle and Gill2006) was not observed in this study; in some cases, benthic communities may be fairly resistant to drastically altered herbivore communities. However, the strong evidence that removal of herbivorous fish biomass increases the chances of macroalgal proliferation following a coral mass-mortality event (Hughes Reference Hughes1994; Hughes et al. Reference Hughes, Rodrigues, Bellwood, Ceccarelli, Hoegh-Guldberg, McCook, Moltschaniwskyj, Pratchett, Steneck and Willis2007; Mumby et al. Reference Mumby, Hastings and Edwards2007a) suggests that the three Zanzibar reefs with highest fishing pressure could be particularly vulnerable to a coral-macroalgae phase shift in the face of any major disturbance event. Use of routine monitoring measures such as species richness, biomass and size class distribution in the context of key functional groups have here provided important information regarding potential vulnerability of coral reefs, and these methods should be widely used as significant indicators for managers to avoid undesirable ecosystem changes.
ACKNOWLEDGEMENTS
We thank C. Muhando, N. Jiddawi, S. Hamed, J. Kabamba, R. Mdendemi and A. Wamukota (Institute of Marine Science, Zanzibar) for assistance, as well as H. Peeks and the staff at Chumbe Island Coral Park (CHICOP). Figure 1 was provided by ReefBase (URL http://www.reefbase.org). Jerker Lokrantz's fieldwork was partly financed by a C.F. Liljevalch J:ors grant, Magnus Nystrom is supported by the Swedish International Development Cooperation Agency (Sida/Sarec) and Carl Folke partly by the Swedish Research Council for the Environment, Agricultural Sciences and Spatial Planning (FORMAS). Joshua Cinner was funded in part by a MASMA grant from the Western Indian Ocean Marine Science Association.