Introduction
Seeds are central to the reproduction of most plant species. They constitute complex structures composed of a set of tissues and are able to withstand unfavourable environmental conditions to maintain the capacity for germination (Sreenivasulu et al., Reference Sreenivasulu, Borisjuk, Junker, Mock, Rolletschek, Seiffert, Weschke and Wobus2010). In parallel to their utmost importance for plant reproduction, seeds themselves are a major source of human and animal nutrition, thus they are the object of intensive research. Studies comprise fundamental research related to developmental processes, such as seed maturation and germination, but also applied research related to traits of agronomical importance, such as yield or seed quality (Rajjou et al., Reference Rajjou, Duval, Gallardo, Catusse, Bally, Job and Job2012). In recent years there has been tremendous progress in the application of comprehensive analytical techniques to the study of transcripts, proteins and metabolites. These ‘omics’ approaches have now found wide application in the study of the seed biology of model and crop plants (North et al., Reference North, Baud, Debeaujon, Dubos, Dubreucq, Grappin, Jullien, Lepiniec, Marion-Poll, Miquel, Rajjou, Routaboul and Caboche2010; Sreenivasulu et al., Reference Sreenivasulu, Borisjuk, Junker, Mock, Rolletschek, Seiffert, Weschke and Wobus2010). Most recently, proteomic techniques have provided evidence for selective mRNA translation and protein turnover during germination of Arabidopsis seeds (Galland et al., Reference Galland, Huguet, Arc, Cueff, Job and Rajjou2014). A multitude of post-translational modifications have been described to modify the biological activity of proteins, which will also impact on seed-related processes (Rajjou et al., Reference Rajjou, Duval, Gallardo, Catusse, Bally, Job and Job2012). Although transcriptomics is currently most advanced in terms of features analysed simultaneously, it is equally important to monitor the profiles of proteins and of metabolites resulting from enzymatic activity.
Sugar beet (Beta vulgaris L.), belonging to the Amaranthaceae, is a crop plant of major economic importance, used for the production of sugar, mainly in temperate climate zones worldwide. In the European Union, sugar beet was grown in 2014 on 1.561 Mha, enabling an estimated sugar production of ~18 Mt (BMEL, 2014). Although mainly utilized for the production of white sugar, sugar beet has recently attracted additional interest as a valuable substrate for the generation of renewable energy in the form of bioethanol, biogas or hydrogen (Panagiotopoulos et al., Reference Panagiotopoulos, Bakker, de Vrije, Urbaniec, Koukios and Claassen2010; Panella, Reference Panella2010; Weiland, Reference Weiland2010). Challenging production environments characterized by a set of various abiotic and biotic stress conditions, as well as changing requirements of customers, are driving forces for plant breeders to develop improved varieties. Botanically, the dispersal units of sugar beet are achenes, with a pericarp tissue covering the ‘true seed’, composed of embryo, perisperm, few endosperm layers and the testa (Hermann et al., Reference Hermann, Meinhard, Dobrev, Linkies, Pesek, Heß, Macháčková, Fischer and Leubner-Metzger2007). Production and processing of sugar beet seed material are complex processes (Kockelmann et al., Reference Kockelmann, Tilcher and Fischer2010). They are targeted to provide material with a maximum germination capacity even in a sometimes hostile environment. Germination and plant establishment define the first stages of the production cycle. Seed-quality traits, such as velocity of germination, seedling growth rate, storage stability of seeds and the potential to face various kinds of stresses, are characteristics comprised by the seed itself. Thus, the molecular constitution of the seed (proteins, carbohydrates, lipids, organic acids, signalling compounds, etc.) must be involved in determining the agronomical traits. Nevertheless, induction of germination processes involves metabolic activity (Bewley, Reference Bewley1997) that might lead to diverse molecular constitutions depending on environmental factors.
Determination of seed quality remains an immense effort and seed companies are interested in finding biomarkers for a faster assessment, either genetic markers and/or molecular markers (metabolites), to characterize seed lots and to control seed constitution during production processes. A better understanding of the underlying mechanisms would provide an opportunity to develop improved production strategies. Recently, sugar beet seeds were profiled for gene and protein expression (Catusse et al., Reference Catusse, Strub, Job, Van Dorsselaer and Job2008, Reference Catusse, Meinhard, Job, Strub, Fischer, Pestsova, Westhoff, Van Dorsselaer and Job2011; Pestsova et al., Reference Pestsova, Meinhard, Menze, Fischer, Windhovel and Westhoff2008) but a corresponding approach on metabolites has not been reported so far. Here we describe for the first time the potential of an untargeted approach for metabolite analysis of sugar beet seeds to distinguish their metabolic profiles. This methodology considers all detectable signals for analysis, due to the expectation that response patterns of analytes (known or unknown) reflect a biological condition, in principle the genotype–environment interaction during the seed production process. Thus, a complex profile, representing small metabolites from different metabolic pathways, is used to classify the samples. Gas chromatography–mass spectrometry (GC–MS) comprises those metabolites that are volatile or can be made volatile by derivatization (Garcia and Barbas, Reference Garcia, Barbas and Metz2011). Biological systems respond dynamically to environmental stimuli. Assessing the molecular phenotype may thus provide information not accessible with genomic markers (Schudoma et al., Reference Schudoma, Steinfath, Sprenger, van Dongen, Hincha, Zuther, Geigenberger, Kopka, Köhl, Walther and Normanly2012). Here we used metabolite profiling to analyse the molecular composition of the sugar beet achene.
Materials and methods
Sample material
Samples analysed for the differentiation of genotypes were produced by KWS SAAT SE in Italy (except NW4, which originates from Chile) in 2007. After harvest, seeds were processed (cleaned, polished and calibrated) according to KWS commercial standards. In order to provide uniform and representative sample material, only seeds of the same calibre size fraction were utilized. Samples showing comparable germination properties were selected based on results obtained by an in-house stress test. For this, seeds were placed in a moist sand–peat mixture, and germinated at 13°C for 14 d.
Samples used to investigate the correlation between metabolite profiles and corresponding germination properties were selected independently of the specific environmental conditions prevailing in the seed multiplication areas in Italy or France in the production campaigns 2007 and 2008. Seed production and processing after harvest were performed essentially as described above. The stress test was used to select samples expressing variation in germination properties (from ‘good’ to ‘very low’). Only diploid varieties were used for this study.
Extraction method for GC–MS profile analysis
Metabolite extraction followed the protocol by Lisec et al. (Reference Lisec, Schauer, Kopka, Willmitzer and Fernie2006) with few adaptations. Briefly, 100 fruits were pooled and homogenized. The powdered material was extracted twice in 10 volumes (w/v) 70% methanol under shaking at 1000 rpm for 10 min. The first extraction was performed at 70°C to inactivate enzymes. Supernatants of both extraction steps were combined. An aliquot of 3 ml was transferred into a glass vial and 1.5 ml chloroform and 3 ml milliQ water were added for two-phase partitioning. After centrifugation at 2500 g for 15 min the polar phase was transferred into a new vial. Aliquots of 50 μl were dried in a vacuum concentrator and used for subsequent derivatization prior to GC–MS measurement.
GC–MS measurement
The dried samples were first re-dissolved and derivatized in 80 μl of methoxyamine hydrochloride (MAH; 20 mg ml− 1 in pyridine) for 2 h at 37°C to convert keto- and aldehyde groups. Then, 80 μl N-methyl-N-(trimethylsilyl) trifluoroacetamide (MSTFA) containing the alkane retention time standard (C7–C30, 10 μg μl− 1, Sigma-Aldrich, Munich, Germany) was added and the mixture incubated for 30 min at 37°C under shaking. The GC–MS system consisted of a gas chromatograph A7890 (Agilent, Böblingen, Germany), an auto sampler Twister XXL (GERSTEL, Mülheim an der Ruhr, Germany) and a TOF mass spectrometer GCT Premier (Waters Corporation, Milford, Connecticut, USA). One microlitre of sample was injected in splitless mode at 240°C. The separation was performed using a 30 m DB5ms column (Phenomenex, Aschaffenburg, Germany) with 0.25 mm inner diameter and 0.25 μm film thickness, including a 5 m guard column. The following parameters for separation were used: 3 min at 80°C, followed by a gradient of 5°C min− 1 to 310°C for 50 min. MS data were recorded with MassLynx 4.1 software (Waters Corporation) with 10 spectra s− 1 in a range of 50–650 m/z in centroid mode using the dynamic enhancement modus (DRE).
Data analysis
Mass-retention time pairs (EMRTs) were calculated using MarkerLynx 4.1 software (Waters Corporation) at a threshold at 5% of base peak intensity. The retention time window was set to 6–51 min and the mass window to 100–600 with a mass tolerance of 0.1 Da. The extracted signal intensities of EMRTs were loaded into ProfileAnalysis software (Bruker Daltonics, Bremen, Germany) for calculation of principal components and generation of volcano plots. The Pareto scaling algorithm was used for visualization of principal component analysis (PCA) loading and score plots. The annotation of metabolites was carried out using the NIST 2.0 library (Gaithersburg, Maryland, USA) and the Golm Metabolite Database (http://csbdb.mpimp-golm.mpg.de/csbdb/gmd/gmd.html). A match factor of 700 was set as a minimum for the annotation; hits with a lower match factor were designated as unknown. In addition, the retention time indices (RI), calculated relative to the retention times of added alkanes, were used to verify the identified metabolites. Relative quantification was performed by integration of peak areas of characteristic fragment ions corresponding to interesting metabolites. Integrated peak areas were used for comparison between samples and statistical analysis by one-way analysis of variance (ANOVA) using SigmaPlot 12.0 (Systat Software GmbH, Erkrath, Germany).
Results
Differentiation of sugar beet genotypes by untargeted GC–MS profiling of mature achenes
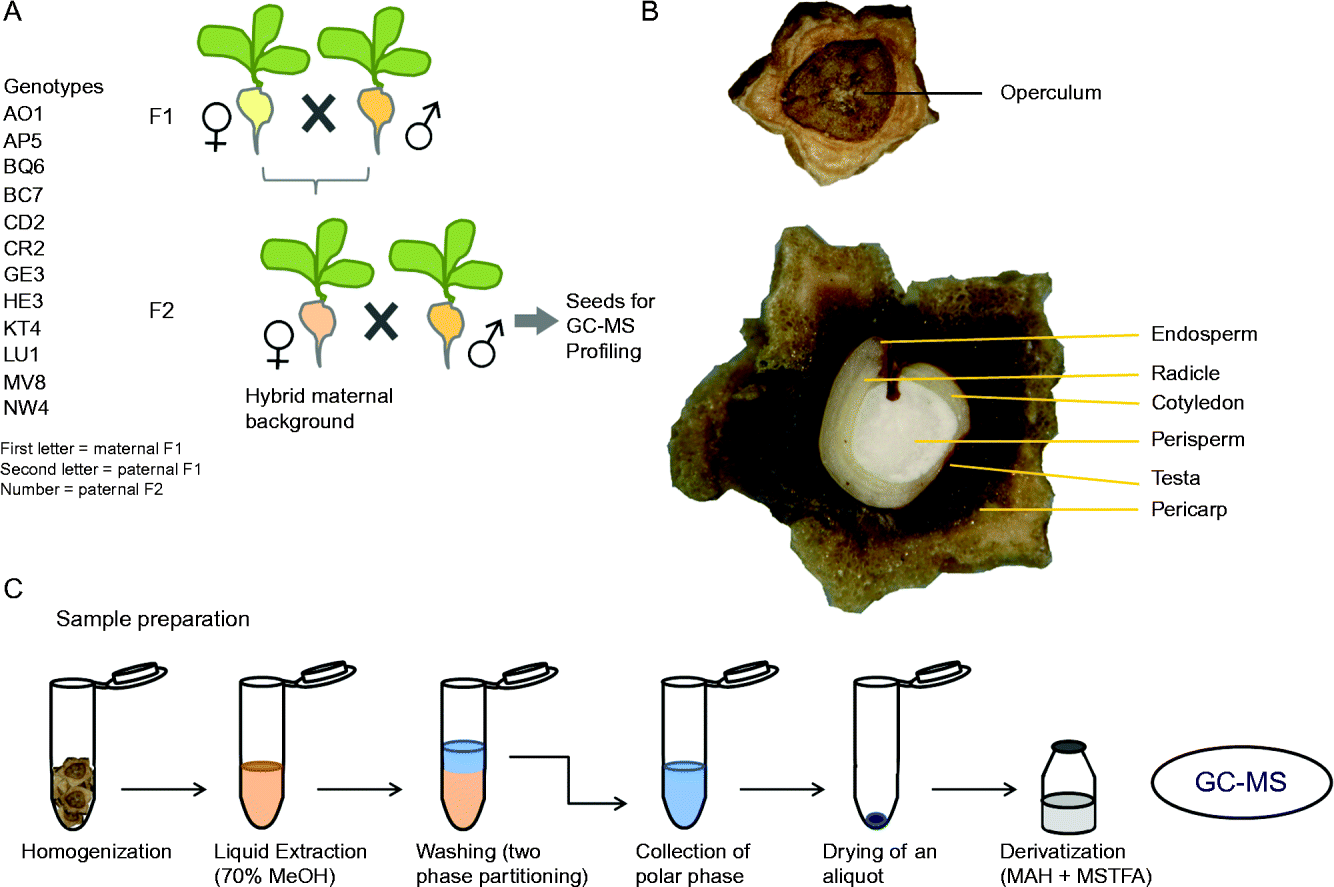
The study aimed at determining the metabolic differentiation of achenes from different sugar beet genotypes by an untargeted GC–MS profile analysis. The chosen sugar beet genotypes represented high-performing commercial varieties (KWS, Einbeck, Germany) with similar seed-quality parameters. The sample material exhibits a close genotypic background by including/representing offspring lines from the same maternal or paternal genetic origin. From the sample designation, parental origins can be deduced (Fig. 1A). For GC–MS analysis dry, non-imbibed achenes were prepared containing a large portion of maternal tissues: the pericarp, which surrounds the ‘true seed’, and the perisperm, which is a nursing tissue derived from the nucellus (Hermann et al., Reference Hermann, Meinhard, Dobrev, Linkies, Pesek, Heß, Macháčková, Fischer and Leubner-Metzger2007) (Fig. 1B). Polar extracts from 100 pooled fruits were prepared in triplicate for each genotype (Fig. 1C).
Overview of sample material and sample preparation. (A) Analysed genotypes and scheme of the parental background. First letters of genotype labels correspond to the F1 maternal origin and second letter to F1 paternal origin. Numbers of genotype labels represent the F2 paternal background. (B) Sugar beet seed material used for metabolite profiling. The lower picture shows a section through a sugar beet fruit. Perisperm, testa and pericarp represent diploid maternal fruit parts. The diploid embryo (comprising the cotyledons and the radicle) and the small triploid endosperm layer bordering the radicle are of filial origin. (C) Metabolite extraction and sample preparation for GC–MS analysis.

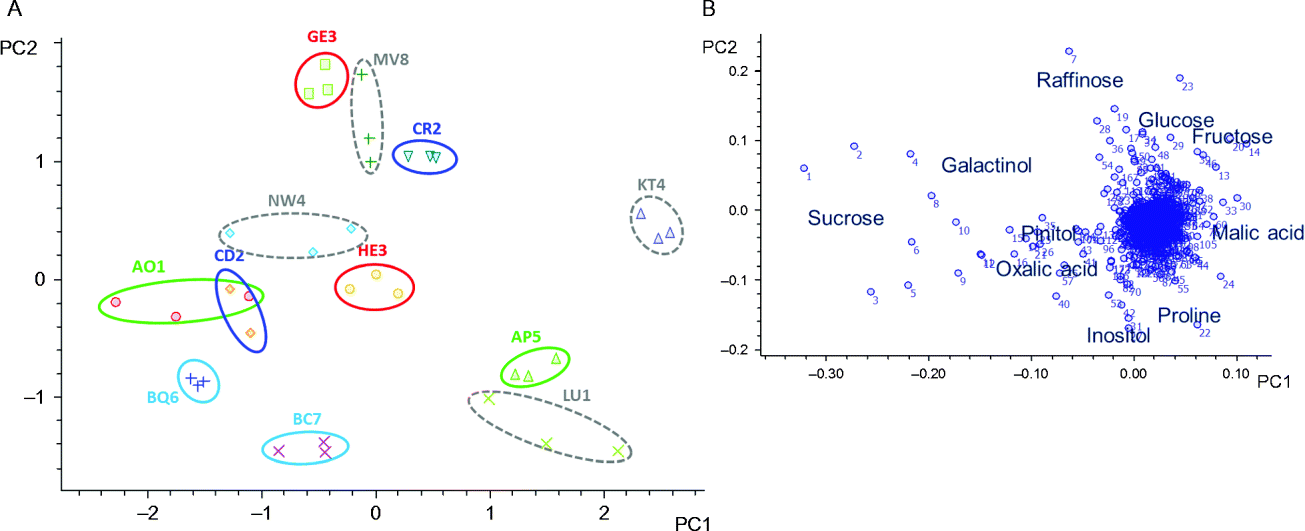
For metabolic profile analysis, retention time mass pairs (EMRTs) were extracted (MassLynx 4.1) and corresponding signal intensities taken for statistical analysis. A PCA was applied to illustrate the variance across the genotypes (Fig. 2). The first principal component (PC1) explained 30.4% of the variance among the sample set; with PC2 another 18.6% variance was obtained. A separation between genotypes was observed but a relationship with the genetic background could not be derived. AP5 is of the same maternal origin as AO1, but clearly differentiates in PC1. A large variance was also observed for CR2 and CD2, sharing the same paternal background and having one of the maternal origins in common. The genotypes HE3 and GE3 differed from each other in PC2, even though they share the same paternal and one of the maternal origins. In contrast, genotypes without a relationship to the other tested samples (Fig. 2, indicated in grey) were not more widely separated than closely related ones. It can be concluded that presumptions about the metabolite constitution of the achene cannot be made from the genetic origin alone.
PCA of metabolite profiles from mature sugar beet achenes from different genotypes. The PCA was generated using all detected EMRTs. The plot shows the variance between the selected genotypes with PC1 explaining 30.4% of the variance and PC2 18.6%. Coloured groups visualize the difference between those genotypes that have a common maternal background (letters in genotype codes represent the hybrid background of the maternal plant, numbers represent the paternal background).

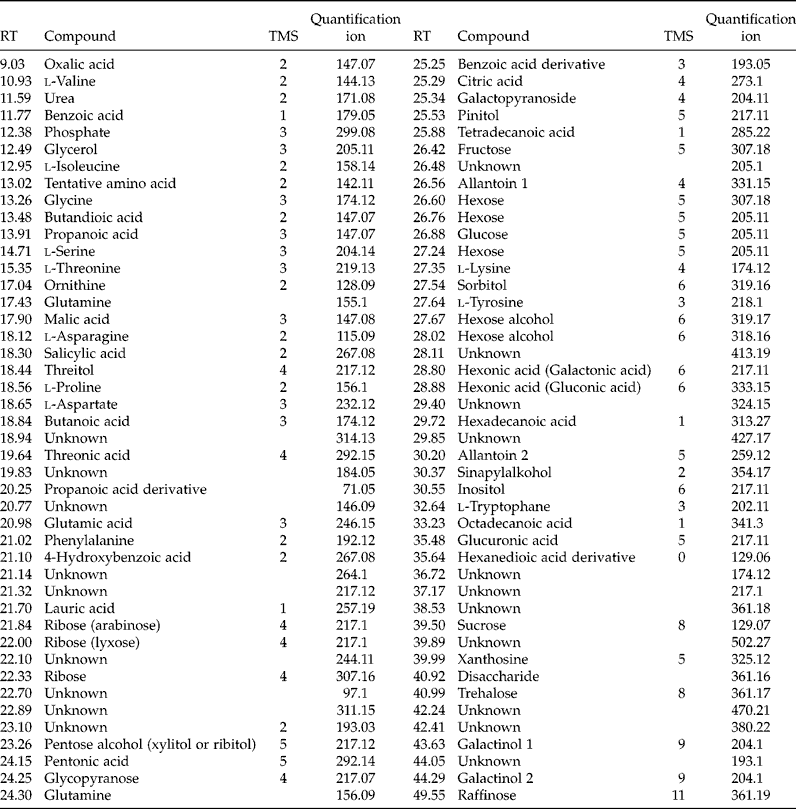
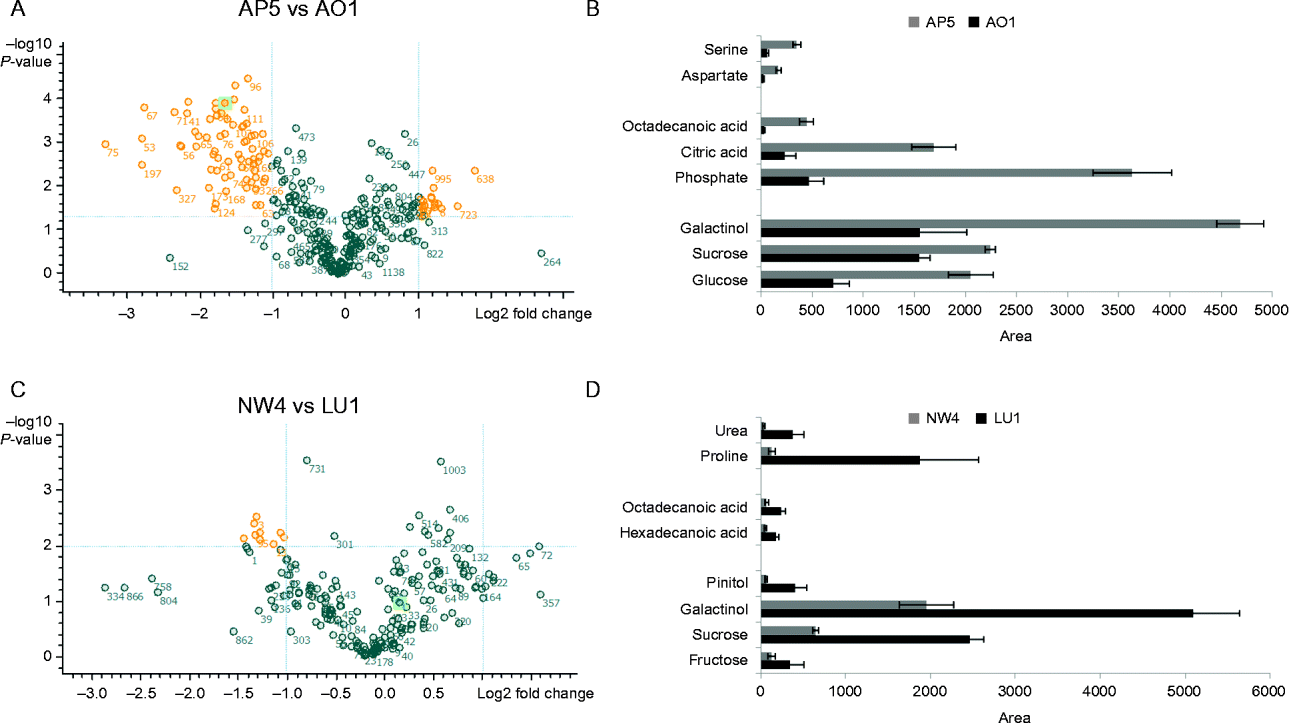
The annotation of compounds was based on a library search using the NIST mass spectral library (Version 2.0). Mass spectra under chromatographic peaks were extracted and loaded into the database. From 91 chromatographic peaks, 68 compounds (compound classes) were annotated (Table 1). Signals from the alkane retention time standard and from chemical column background were excluded. Most significant loadings from the PCA of all genotypes were classified to sugars, sugar alcohols, amino acids, small organic acids and phosphate (Fig. 2B). A pairwise analysis of closely related genotypes (Fig. 3A and B) and unrelated genotypes (Fig. 3C and D) revealed the same compounds to be responsible for the discrimination in the PCA (Fig. 2). The amounts of sucrose, raffinose, hexoses and sugar alcohols (inositol, pinitol, galactinol) were found in all cases to show the highest variation across the sample set. Of the amino acids, mainly proline, serine and aspartate are distinctive in the metabolite profiles. No difference was observed regarding the major metabolic variation with respect to the genetic background, confirming that either the heritability had a lower contribution to the metabolic differentiation than the environment, or that the major amount of maternal fruit parts had less influence.
Annotated compounds according to their retention time and fragment patterns. The quantification ion represents a characteristic fragment ion of the precursor and was used for peak integration. TMS, number of trimethylsilyl groups bound; RT, retention time (min)

Significant compounds explaining the differentiation between genotypes with similar maternal background (A, B) and genotypes with different parental lines (C, D). EMRTs with P ≤ 0.01 and fold change of 2 are visualized in volcano plots in yellow. Signal intensities for corresponding annotated compounds are shown on the right.

Comparison of seed lots comprising different germination capacities
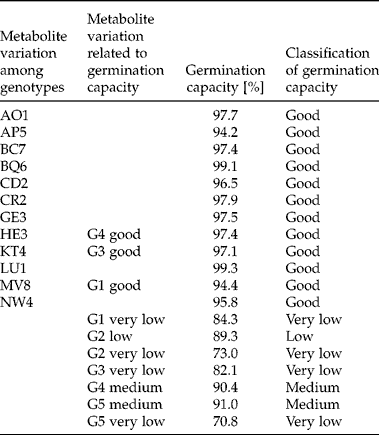
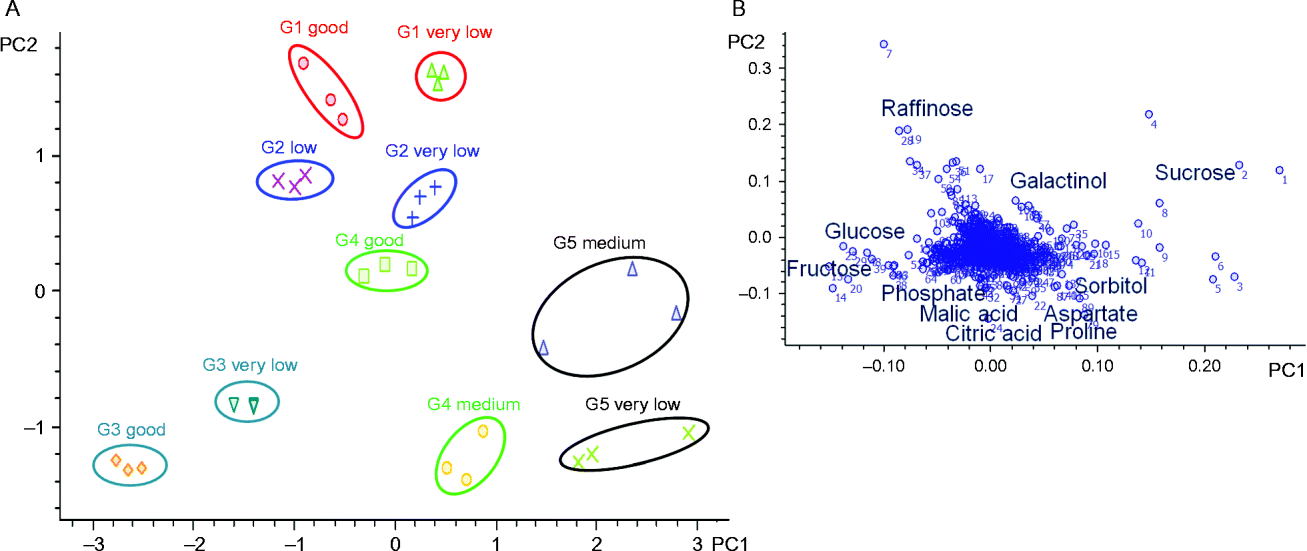
To evaluate the ability of the approach to differentiate between the metabolic profiles according to differences in germination capacities, batches from five genotypes comprising good (>94%), medium (90–94%), low ( < 90%) and very low ( < 85%) germination capacities were investigated (Table 2). Elucidation of metabolic markers that are discriminative for variation in germination capacity but are independent of genotype would simplify the laborious evaluation of seed lots. Using the GC–MS profiling approach, clear separations between the two batches from each genotype were observed (Fig. 4A) but not a separation of all samples according to germination capacity. The distance between the genotypes was found to be larger than between the seed lots of the individual genotypes, which appear as pairs in the PCA. Among the total sample set, PC1 explained 38.8% of the variability and PC2 20.2%. The genotypes G1, G2 and G3 vary along the main component PC1. Genotypes G4 and G5 disperse mainly in PC2 direction. Annotation of EMRTs having the highest influence on the variation in the PCA revealed hexoses (fructose and glucose), sucrose and raffinose as having a major contribution to the separation between the samples (Fig. 4B). Also, sugar alcohols (galactinol, sorbitol), amino acids (proline, serine and aspartate) and small organic acids (malate, citrate) again showed high variabilities across the sample set. This indicates that the metabolic variability between genotypes is more pronounced than those metabolic differences that are caused by the quality trait germination capacity in sugar beet.
Sample material representing various genotypes of sugar beet achenes with similar (good) germination capacity and seed lots with variations in germination capacity. Genotypes G1 (MV8), G3 (KT4) and G4 (HE3) were used in both analyses, as seed lots with good and, additionally, medium and very low germination capacity were available. No seed lots with good germination capacities were available from genotypes G2 and G5.

PCA of metabolic profiles from sugar beet achenes having different germination capacities. Five genotypes with seed material of two different germination qualities each were tested for differences in their metabolite composition. PC1 explained 38.8% and PC2 20.2% of the variance among the tested sample set.

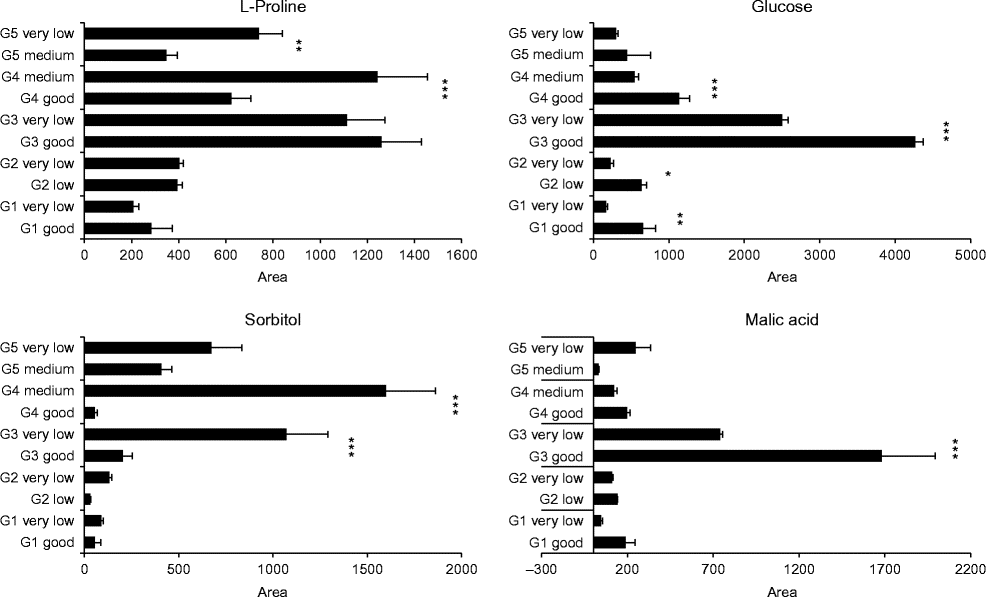
A further genotype-specific pairwise comparison of metabolic differences between the batches revealed several significantly changed metabolites (examples are shown in Fig. 5). A general germination-capacity-related variation could not be observed, as various metabolites differ significantly between the individual sugar beet varieties. As shown in Fig. 5, proline showed significant changes in G4 and G5 but was not changed in the other genotypes. In contrast, glucose differed significantly in G1 to G4 but not in G5. For sorbitol a general trend to higher concentrations related to a lower germination within the individual genotypes was found, but a ratio according to the value of germination rate was not observed. Malate increases in G5 from medium to very low germination capacity, but decreases from good to very low germination capacity in G1 and G3. According to the high variation between genotypes, threshold values for particular compounds could not be elucidated. It is more likely that ratios among individual metabolic classes affect germination than one single compound alone. Furthermore, low abundance signalling compounds not detected in our untargeted profiling approach might have a decisive role for developmental processes (Hermann et al., Reference Hermann, Meinhard, Dobrev, Linkies, Pesek, Heß, Macháčková, Fischer and Leubner-Metzger2007), influencing enzymatic activity, which results in a particular metabolic state of the seed.
Metabolic changes among seed lots differing in germination capacity. The representative compounds illustrate the high variability in concentration in various seed lots differing in germination capacity. Even though significant variations can be observed for the individual genotypes tested, the variation between genotypes is large and overlies metabolite changes due to seed-quality differences.

Discussion
This study aimed to investigate the capability of an untargeted GC–MS approach to differentiate mature achenes of sugar beet varieties; on the one hand, genotypically by choosing seed lots with very similar quality and, secondly, within the frame of seed quality determined by variations in germination capacity.
Genotypic variation of metabolic profiles
The PCA (Fig. 2) illustrated a clear variance across the metabolic profiles of the different genotypes, reflecting characteristic achene compositions. Even though some of the genotypes partly shared the same parental origins (sharing 25–75% of the genetic background), there was no greater difference observed with non-related varieties, indicating that, from the genetic background alone, no conclusions about the metabolic composition of the dry achene can be deduced. Thus, the metabolic phenotype is deemed to be less influenced by the maternal contribution. The filial (and genetically newly combined) part of the seed might have a higher impact on metabolic features. The achenes of sugar beet contain a high proportion of maternal origin: the pericarp, originating from the carpels of the flower that surrounds the true seed, and the perisperm, a nursing tissue descended from the nucellus, which are both diploid (Hermann et al., Reference Hermann, Meinhard, Dobrev, Linkies, Pesek, Heß, Macháčková, Fischer and Leubner-Metzger2007). The origin of the small endosperm layer is two-thirds maternal and one-third paternal, being triploid. Another reason for the observed variation across the sample set could be that environmental factors have genotypically different effects, resulting in a specific metabolite composition of seed lots. The identification of compounds allowed a more comprehensive view on the substances responsible for the variation between the genotypes. A high impact was recorded for carbohydrates, amino acids and small organic acids. As shown, for example, in Fig. 3, the content of proline is 14-fold and that of urea 10-fold higher in LU1 than in NW4. A huge variation was also recorded for xanthosine, with contents 80-fold higher in LU1 compared to CD2 (see supplementary Table S1). Recently, GC–MS profiling has been demonstrated to be a valuable tool for distinguishing seeds of rice (Kim et al., Reference Kim, Jung, Lee, Lim, Ha and Lee2014). Also in rice, significant differences between genotypes were classified to carbohydrates, amino acids and organic acids. In Nicotiana tabacum, metabolic consequences of a mutagenesis approach exhibited significant alterations in seed primary metabolites, as observed by GC–MS profiling (Matityahu et al., Reference Matityahu, Godo, Hacham and Amir2013).
This study illustrates that GC–MS profiling has the potential to be utilized as a metabolic fingerprinting method of achenes from closely related sugar beet varieties. According to the increased demand for high-performing varieties of sugar beet, which has led to the rapid development in sugar beet breeding, new varieties and hybrid lines are created continuously. Biomarkers for seed quality, either genetic markers and/or molecular markers (metabolites), could offer the potential to reduce the effort required for seed-quality estimation, supporting breeding approaches as well as the seed production process by facilitating the identification of seed lots of desired germination properties. Therefore, the rapid assessment of quality factors determining agronomically important traits makes analytical approaches more and more indispensable. In other plant species also, untargeted GC–MS profile analysis has proved to be an appropriate approach for determination of variation in the small molecule range. It has been applied successfully to distinguish Arabidopsis thaliana mutants with similar phenotypes (Messerli et al., Reference Messerli, Partovi Nia, Trevisan, Kolbe, Schauer, Geigenberger, Chen, Davison, Fernie and Zeeman2007) or to characterize Vitis vinifera cultivars in their response to water stress (Hochberg et al., Reference Hochberg, Degu, Toubiana, Gendler, Nikoloski, Rachmilevitch and Fait2013).
However, in future experiments the metabolite profiling approach has to be extended by including different seed lots of one genotype harvested from different production environments and/or years. Even though the embryo (the genetically new combined fruit part) might have a major contribution to the metabolite profiles obtained in this study, the environmental contribution has to be elucidated. Using seeds of the same quality but different growing conditions will provide information on those compounds that are strongly related to heritability. Furthermore, a separation of fruit parts (pericarp, perisperm, embryo) would provide more detailed information on the metabolic variation between fruit organs, and whether the variability of the metabolite profiles between genotypes is related primarily to a particular fruit organ.
Metabolic variation in differing germination capacities
To elucidate compounds that might be relevant for differences in germination capacities, we analysed the metabolic constitution of achenes comprising variations from good to very low germination capacity. The principal components of the overall metabolite profile indicated a group separation of all samples. For each genotype, variances according to germination capacity were observed (Fig. 4). But overall biomarkers that are applicable to display lowered capacities in germination were not obtained in this study. For dry and metabolically inactive achenes, the genotypic effect was found to be more pronounced than metabolic changes related to this seed-quality trait. A contrasting result was obtained by Witt et al. (Reference Witt, Galicia, Lisec, Cairns, Tiessen, Araus, Palacios-Rojas and Fernie2012) for metabolically active vegetative tissues. In their study, Zea mays hybrids with different tolerances against drought were studied for metabolite changes in response to water stress. They found clear differences in the profiles between drought stressed plants and well-watered controls, and a clear differentiation of different plant organs, but variation between susceptible and tolerant lines in relation to treatments was no different. In this case, the metabolic variation in vegetative plant organs as a result of stress treatments could have overcome genotype-specific variation.
A genotype-specific pairwise analysis of variance revealed several significant changes of individual compounds. But for each genotype, different compounds were observed as contributing most significantly to the metabolic variability between germination capacity variances (examples are shown in Fig. 5). Generally, the same compounds seem to be involved in a metabolic variation between different seed lots from one genotype as in the metabolic variation between genotypes. This indicates that processes leading to lowered germination rates might affect general primary metabolism. Germination represents a complex process in development that involves a multitude of biochemical steps (Rajjou et al., Reference Rajjou, Duval, Gallardo, Catusse, Bally, Job and Job2012), and the behaviour of a seed during germination is conditioned during the development of the seed (Koller et al., Reference Koller, Mayer, Poljakoff-Mayber and Klein1962). Thus, causes of insufficient germination are quite diverse. To elucidate the impact of individual metabolic pathways on germination, targeted treatments of plants during seed development are needed (e.g. various nutrient deficiencies, temperature stress). In this study, the capability of GC–MS profiling to resolve metabolic changes in respect to seed quality has been proven. Even small reductions of the germination capacity, as tested with G2 or G4, led to significant changes in the metabolite profiles.
In conclusion, the metabolite composition of the dry sugar beet fruit is strongly affected by the genetic background. Even closely related genotypes can be differentiated by a GC–MS profiling approach using the extracted polar fraction of the achene. Even though seed lots with different germination capacities show variances in their metabolites, general markers useful for quality controls of seed material have not been identified with this approach. In follow-up experiments systematic cultivation of various sugar beet varieties has to be performed at different locations to study the environmental impact on the metabolic constitution of the achene. Considering that only a fraction of the whole metabolome can be detected by the chosen GC–MS method, it cannot be excluded that other metabolites would show a correlation with the capacity of a seed to germinate. For example, phytohormone ratios might have a strong contribution to this trait. Therefore, GC–MS should be complemented with analytical techniques capable of monitoring other classes of metabolites (e.g. hormones) to elucidate markers for germination capacity.
Supplementary material
To view supplementary material for this article, please visit http://dx.doi.org/10.1017/S0960258515000379.
Acknowledgements
Technical assistance by Anke Jagonak and Elena Barthel is gratefully acknowledged.
Financial support
Financial support to H.-P.M given by KWS SAAT SE is gratefully acknowledged.
Conflicts of interest
None.