

Introduction
Cluster formation in supersonic gas jets provides the advantages of a gaseous target in tandem with near solid (~1022 cm−3) intracluster atomic density (Hagena Reference Hagena1972; Kugland et al., Reference Kugland, Neumayer, Döppner, Chung, Constantin, Girard, Glenzer, Kemp and Niemann2008). Laser radiation can propagate through the gas puff while being efficiently absorbed by atoms in the clusters (Petrov et al., Reference Petrov, Davis, Velikovich, Kepple, Dasgupta and Clark2005). Clustered gas puffs have been studied as an alternative to solid targets for laser-plasma studies due to their inherent lack of debris. Importantly, short-pulse laser beam interaction with gas-puff plasmas can produce short X-rays bursts (1–20 keV), suitable for many applications. It has been demonstrated in the past that when X rays with energy 1–10 keV are emitted when a sub-picosecond or femtosecond laser irradiates clustered Ar (Chen et al., Reference Chen, Kando, Ma, Kotaki, Fukuda, Hayashi, Daito, Homma, Ogura, Mori, Pirozhkov, Koga, Daido, Bulanov, Kimura, Tajima and Kato2007; Faenov et al., Reference Faenov, Skobelev, Pikuz, Fortov, Boldarev, Gasilov, Chen, Zhang, Yan, Yuan, Mao, Wang, Colgan and Abdallah2011), Kr (Kugland et al., Reference Kugland, Neumayer, Döppner, Chung, Constantin, Girard, Glenzer, Kemp and Niemann2008; Hayashi et al., Reference Hayashi, Fukuda, Faenov, Kando, Kawase, Pikuz, Homma, Daido and Bulanov2010; Zhang et al., Reference Zhang, Chen, Yuan, Yan, Wang, Liu, Shen, Faenov, Pikuz, Skobelev, Gasilov, Boldarev, Mao, Li, Dong, Lu, Ma, Wang, Sheng and Zhang2011), Xe (Ditmire et al., Reference Ditmire, Smith, Marjoribanks, Kulcsár and Hutchinson1997, Reference Ditmire, Patel, Smith, Wark, Rose, Milathianaki, Marjoribanks and Hutchinson1998; Honda et al., Reference Honda, Miura, Katsura, Takahashi and Kondo2000) or mixtures like Kr-Ar (Kantsyrev et al., Reference Kantsyrev, Schultz, Shlyaptseva, Safronova, Shrestha, Petrov, Moschella, Petkov, Stafford, Cooper, Weller, Cline, Wiewior and Chalyy2016c; Zhvaniya et al., Reference Zhvaniya, Dzhidzhoev and Gordienko2017) or Xe-Kr-Ar (Schultz et al., Reference Schultz, Kantsyrev, Safronova, Moschella, Wiewior, Shlyaptseva and Weller2016; Kantsyrev et al., Reference Kantsyrev, Schultz, Shlyaptseva, Petrov, Safronova, Petkov, Shrestha, Cline, Wiewior and Chalyy2016a). These gas puffs have also been studied for hot-electron production (Malka et al., Reference Malka, Faure, Marquès, Amiranoff, Rousseau, Ranc, Chambaretz, Najmudin, Walton, Mora, Solodov and Amiranoff2001; Namba et al., Reference Namba, Hasegawa, Nagashima, Kawachi, Kishimoto, Sukegawa and Takiyama2006; Jha and Krishnamurthy, Reference Jha and Krishnamurthy2008), high-harmonic generation (Shim et al., Reference Shim, Hays, Zgadzaj, Ditmire and Downer2007; Sharma and Vatsa, Reference Sharma and Vatsa2009), and laser self-focusing (Schroeder et al., Reference Schroeder, Omenetto, Borisov, Longworth, McPherson, Jordan, Boyer, Kondo and Rhodes1998; Balakin et al., Reference Balakin, Borodin, Dzhidzhoev, Gorgienko, Esaulkov, Zhvaniya, Kuzechkin, Ozheredov, Sidorov, Solyankin and Shkurinov2016) in addition to soft and hard X-ray generation (Ditmire et al., Reference Ditmire, Donnelly, Rubenchik, Falcone and Perry1996; Wachulak et al., Reference Wachulak, Wegrzynski, Zapraany, Bartnik, Fok, Jarocki, Kostecki, Szczurek, Korytar and Fiedorowicz2014; Kantsyrev et al., Reference Kantsyrev, Schultz, Shlyaptseva, Safronova, Shrestha, Petrov, Moschella, Petkov, Stafford, Cooper, Weller, Cline, Wiewior and Chalyy2016c).
With the advent of chirped pulse amplification, high laser intensities of >1018 W/cm2 can be achieved, bringing laser beam physics into the strong-field regime. Ionization within a cluster is dominated by electrons tunneling through their binding potential, which is lowered by the strong field of the laser beam and the close proximity of neighboring atoms in the cluster (Fennel et al., Reference Fennel, Meiwes-Broer, Tiggesbäumker, Reinhard, Dinh and Suraud2010). The liberated (unbound) electrons reside inside the cluster, where frequent collisions further ionize and heat the intra-cluster plasma. These collisions can induce inner-shell vacancies in gas atoms, leading to K-shell emission in lower-Z atoms like Ar.
In this paper, we study the effects of mixing noble gases on X-ray radiation and electron-beam parameters using the Lawrence Livermore National Laboratory's (LLNL) Titan laser at the Jupiter Laser Facility. Cluster-formation efficiency and ionization are known to increase (Abraham et al., Reference Abraham, Kim and Stein1981; Last et al., Reference Last, Schek and Jortner1997; Kantsyrev et al., Reference Kantsyrev, Schultz, Shlyaptseva, Petrov, Safronova, Petkov, Shrestha, Cline, Wiewior and Chalyy2016a; Reference Kantsyrev, Schultz, Shlyaptseva, Safronova, Shrestha, Petrov, Moschella, Petkov, Stafford, Cooper, Weller, Cline, Wiewior and Chalyy2016c; Zhvaniya et al., Reference Zhvaniya, Dzhidzhoev and Gordienko2017) with the addition of a lighter carrier gas (Ar) to heavier, more easily ionized atoms (Kr and Xe). Knowledge of gas-puff parameters such as average density and cluster size is required to understand what physical properties drive stronger X-ray emission and control the X-ray spectrum. To our knowledge, no studies have been done that simultaneously measure electron beams, laser coupling, X-ray emission in different directions, X-ray spectra, and X-ray pinhole images on two high-intensity laser platforms, as well as to perform characterization experiments on five different gas target types.
In the following, the section “Experimental details” describes the details of the experiments, while the section “Results and discussion” provides results and discussion. First, the characterization of gas-puff parameters prior to laser heating is presented. Next, X-ray (>1.4 keV) emission and conversion efficiency, measurement of the transmission of the laser pulse through the gas puff plasma, and the anisotropy of X-ray emission are described. X-ray spectroscopic observations are also included. The discussion proceeds with measurements of >70 keV electron beams. Finally, we investigate the sensitivity of X-ray flash and a multi-MeV electron beam generation in Xe to focal position inside the gas puff. The section “Conclusion” summarizes our conclusions.
Experimental details
Five different gas puff targets were tested: Ar, Kr, Xe, and two mixed gas puffs. The two mixtures, KrAr (15% Kr – 85% Ar) and XeKrAr (13% Xe – 19% Kr – 68% Ar), were chosen based on previously reported results (Schultz et al., Reference Schultz, Kantsyrev, Safronova, Moschella, Wiewior, Shlyaptseva and Weller2016; Kantsyrev et al., Reference Kantsyrev, Schultz, Shlyaptseva, Petrov, Safronova, Petkov, Shrestha, Cline, Wiewior and Chalyy2016a, Reference Kantsyrev, Schultz, Shlyaptseva, Safronova, Shrestha, Petrov, Moschella, Petkov, Stafford, Cooper, Weller, Cline, Wiewior and Chalyy2016c). Gas ratios are in percent volume, and gas-valve backing pressure remained constant for the duration of the experiments at 600 psi (41 bar). Previous articles detail the characterization process to determine gas-puff density via Mach-Zehnder interferometry as well as estimate the size of clusters (several tens of Å) via Rayleigh scattering (Schultz, Reference Schultz2017).
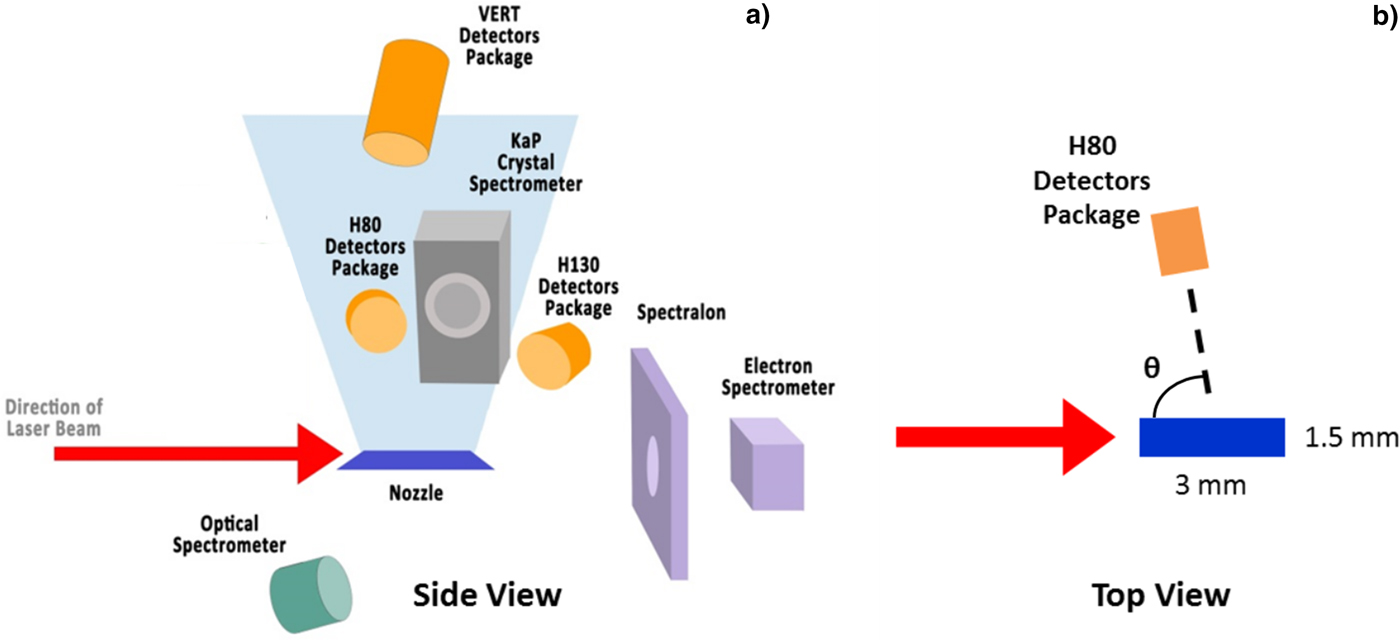
Laser-heating experiments were performed at LLNL's Jupiter Laser Facility (JLF). The 2ω Titan laser platform's short-pulse beam is a 527-nm, 700-fs laser pulse with up to 40 J of energy in the best focus of 10 µm in diameter (measured at 90% of maximum intensity in focal spot), delivering an intensity of up to 7 × 10¹⁹ W/cm2 on target. The laser pulse contrast, the ratio of peak to pre-pulse laser intensity, was as good as 108 (Kemp et al., Reference Kemp, Link, Ping, McLean, Patel, Freeman, Schumacher, Tiedje, Tsui, Ramis and Fedosejevs2015). The target in these experiments was a gas puff produced by a linear, supersonic nozzle mounted to a Series 9 (Parker Co., USA) pulsed gas valve. The exit cross-section of the nozzle is rectangular (1.5 × 3 mm), producing an elongated profile to study potential laser self-focusing effects (Caillaud et al., Reference Caillaud, Blasco, Bontá, Dorchies and Mora2006). The gas puffs achieve supersonic speeds and, upon cooling, produce small (a few nm diameter) clusters consisting of atoms bound by Van der Waals forces. An f/3 off-axis parabolic (OAP) mirror focused the laser beam at the target 1 mm from the nozzle exit (Fig. 1). The gas-puff propagation direction was orthogonal to both the laser beam propagation direction and polarization axis.
Schematic of plasma diagnostics from (a) side and (b) top view. Laser beam polarization is into and out of the page in (a) and up and down in (b). The angle of detector packages, θ, is measured clockwise from the direction of laser beam incidence with the laser beam coming from 0° and propagating towards 180°, see (b).
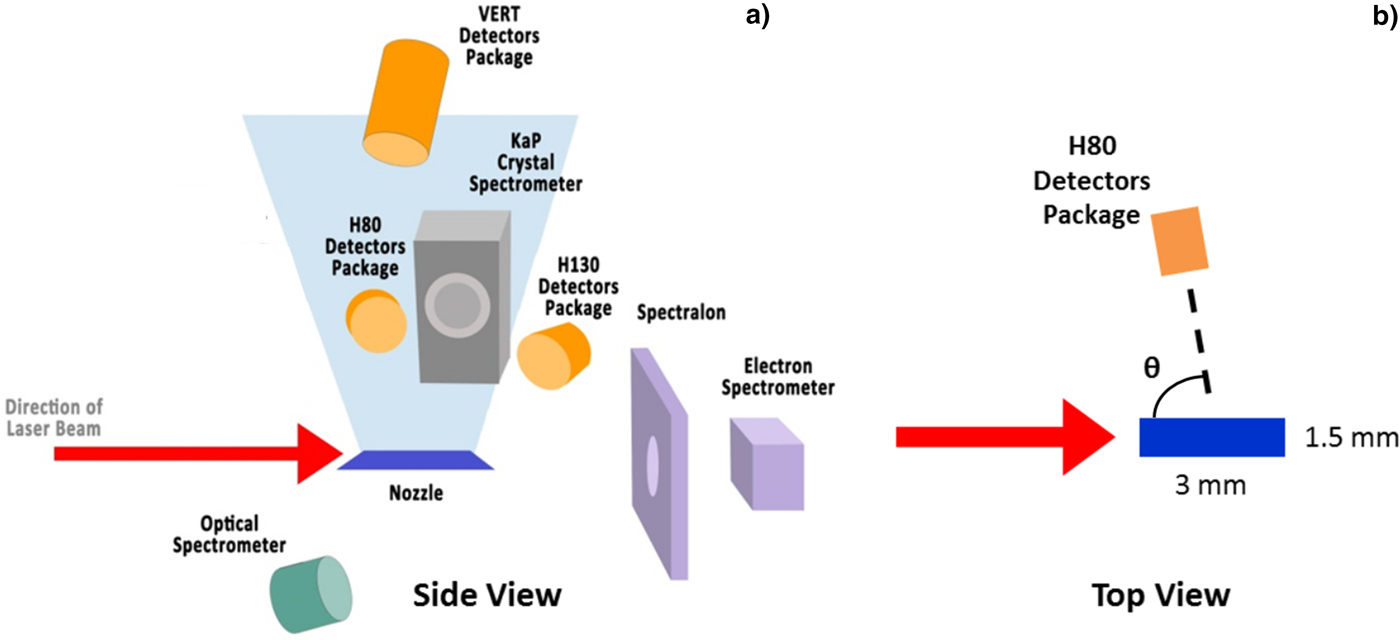
Figure 1 shows the suite of diagnostics used in the experiments. Dynamic X-ray diagnostics included filtered, cross-calibrated AXUV-HS5 silicon diodes (response time 1 ns) and a filtered, calibrated diamond photoconducting detector (PCD) (response time 0.7 ns). The diagnostics viewed the plasma from three directions: One vertical and two horizontal lines of sight. The horizontal packages are positioned at angle θ, measured from the direction of laser beam incidence, and the vertical package looks directly down on the gas puff. Each package consists of three Si-diodes, filtered to record X-ray emission greater than 1.4, 3.5, and 9 keV. The vertical package also housed a PCD with a lower filter cut-off energy of 2.4 keV. Filter cut-off energy is defined by the 1/e transmission of the filter. To protect the Si-diodes and PCDs from ion and electron impacts that would skew the results, 0.5-T permanent magnets were mounted between the detectors and the plasma.
A Faraday cup detector with 12.5 µm Cu filter, giving a (lower) cutoff energy of 72 keV, was employed for electron-beam measurements. It was located along the laser propagation direction, behind the gas puff with respect to laser beam propagation (θ = 150°). High-energy electron spectra (0.1–19 MeV) were recorded on a shot-by-shot basis on the permanent magnet spectrometer, an electron positron proton spectrometer (EPPS) (Chen et al., Reference Chen, Link, van Maren, Patel, Shepherd, Wilks and Beiersdorfer2008), placed 70 cm from target chamber center (TCC). Calibrated image plate strips (BAS-SR 2040) (Maddox et al., Reference Maddox, Park, Remington, Izumi, Chen, Chen, Kimminau, Ali, Haugh and Ma2011) captured the spectra, which were scanned by an FLA-7000 IP scanner.
Time-integrated X-ray spectrometers and pinhole cameras were also fielded. We applied an X ray, convex crystal spectrometer with a KAP (potassium acid phthalate) crystal and spectral resolution λ/Δλ of ~500–700 (Kantsyrev et al., Reference Kantsyrev, Schultz, Shlyaptseva, Safronova, Shrestha, Petrov, Moschella, Petkov, Stafford, Cooper, Weller, Cline, Wiewior and Chalyy2016c). The two X-ray pinhole cameras (three channels each with cut-off energies 0.7, 1.4, and 3.5 keV) had a spatial resolution of 60 µm. X-ray spectra and pinhole images were recorded on Kodak Biomax MS film. Transmission of laser energy through the gas puff was measured using a calibrated scattering plate made of Spectralon® placed 38 cm from TCC downstream from the gas puff along the laser propagation direction. A 16-bit Andor DV434 CCD camera (filtered with calibrated optical density glass filters) imaged the spatial distribution of laser light incident on the scattering plate and instituted an upper bound on laser beam absorption by the gas puff.
Results and discussion
Gas puff characterization
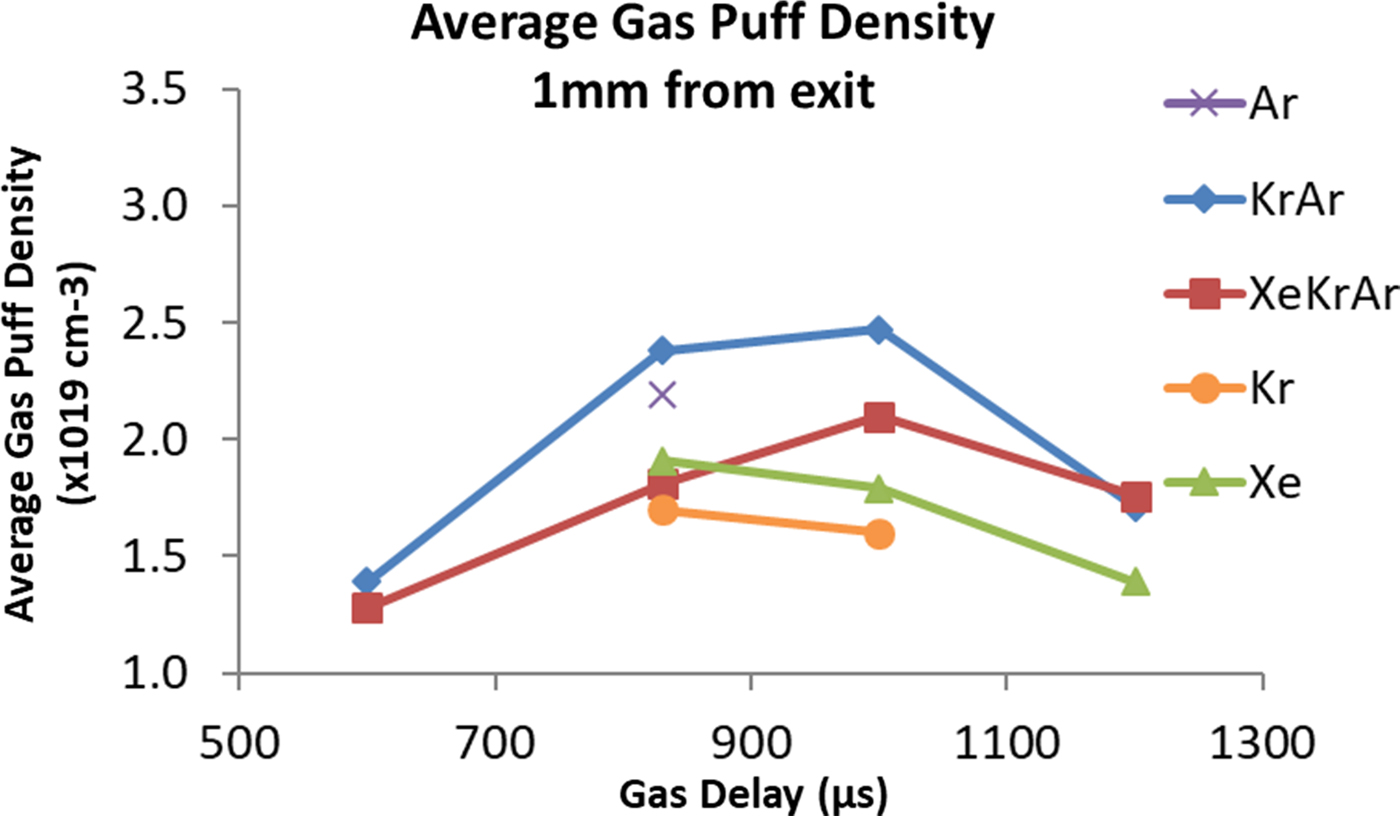
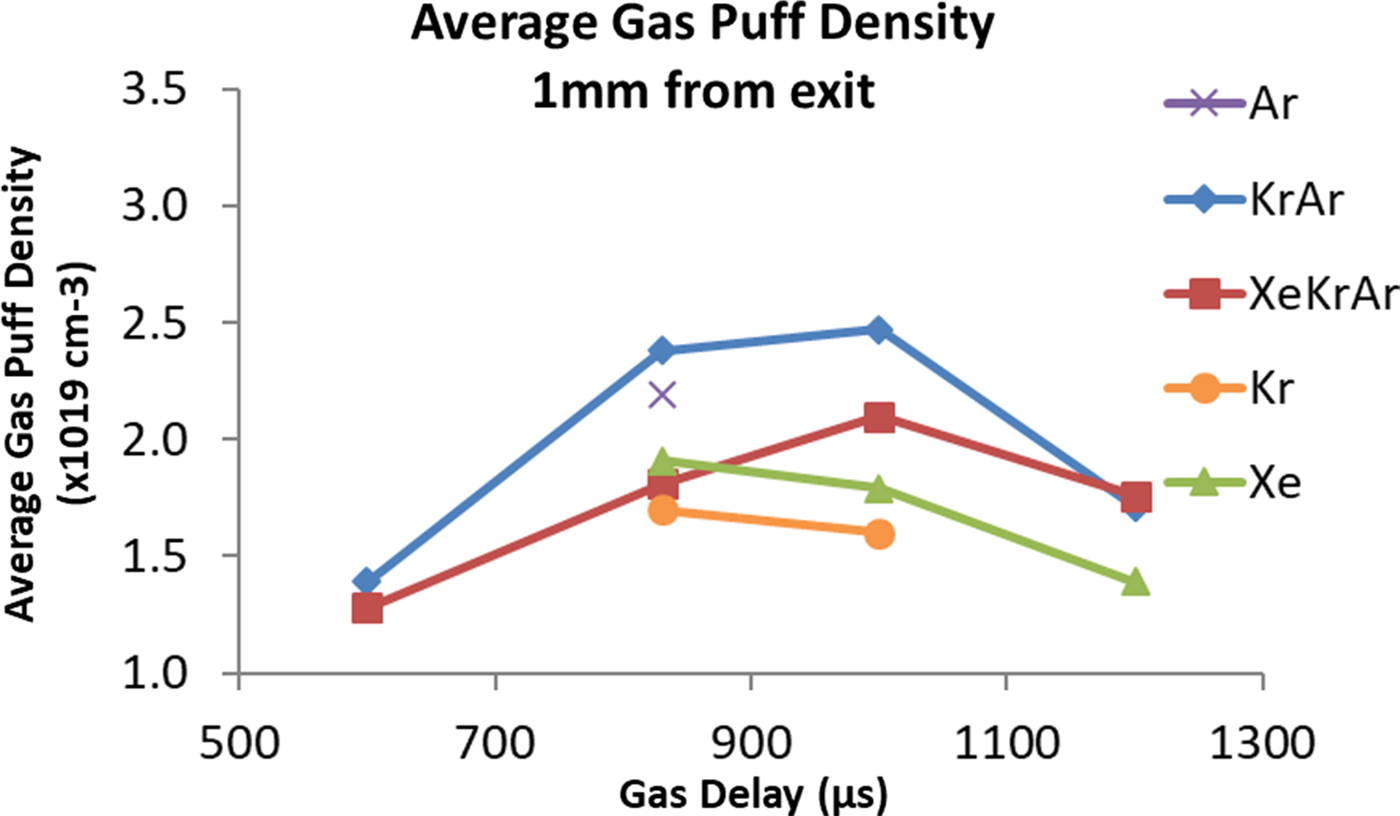
Gas-puff characterization experiments were performed independently from laser-gas-puff studies. The average density of the gas puff is measured through the use of a Mach-Zehnder interferometer, the details of which were previously published (Kantsyrev et al., Reference Kantsyrev, Schultz, Shlyaptseva, Petrov, Safronova, Petkov, Shrestha, Cline, Wiewior and Chalyy2016a). As described in previous works (Schultz et al., Reference Schultz, Kantsyrev, Safronova, Moschella, Wiewior, Shlyaptseva and Weller2016; Kantsyrev et al., Reference Kantsyrev, Schultz, Shlyaptseva, Petrov, Safronova, Petkov, Shrestha, Cline, Wiewior and Chalyy2016a, Reference Kantsyrev, Schultz, Shlyaptseva, Safronova, Shrestha, Petrov, Moschella, Petkov, Stafford, Cooper, Weller, Cline, Wiewior and Chalyy2016c), a distinct advantage of our experimental setup is the ability to easily vary gas-puff atomic density by changing the gas-delay timing, which is the delay between gas-puff initialization and laser-gas-puff interaction. Figure 2 illustrates the control of gas-puff atomic density for a range of delay timings. Density measurements were taken along the 3-mm length of the puff with an estimated error of <10%. The small error is due to more accurate measurements of the width of the gas puff (Kantsyrev et al., Reference Kantsyrev, Schultz, Shlyaptseva, Petrov, Safronova, Petkov, Shrestha, Cline, Wiewior and Chalyy2016a) which resulted in a better estimate of the average gas-puff density. The gas-puff densities for the reported gases have maxima between delays of 830–1000 µs with minimum densities at 600 µs. The details regarding the control of gas-puff density are essential since the density of the gas puff directly affects the plasma parameters and consequently, X-ray and electron emission. A combination of interferometery and Rayleigh scattering techniques were used to measure the cluster sizes of the different gas puffs. Details of these mesaurements can be found in Schultz et al. (Reference Schultz, Kantsyrev, Safronova, Moschella, Wiewior, Shlyaptseva and Weller2016) and Schultz (Reference Schultz2017). Cluster radii at 1 mm from the nozzle exit varied from 70 to 150 Å for Ar, Kr, and mixed gas puffs and were ≈200 Å for Xe.
Average particle density at the center of the gas puff 1 mm from the nozzle exit. All gas-puff targets had a backing pressure of 600 psi. Estimated error of density measurements is <10%.
X-ray emission from laser-irradiated gas-puffs
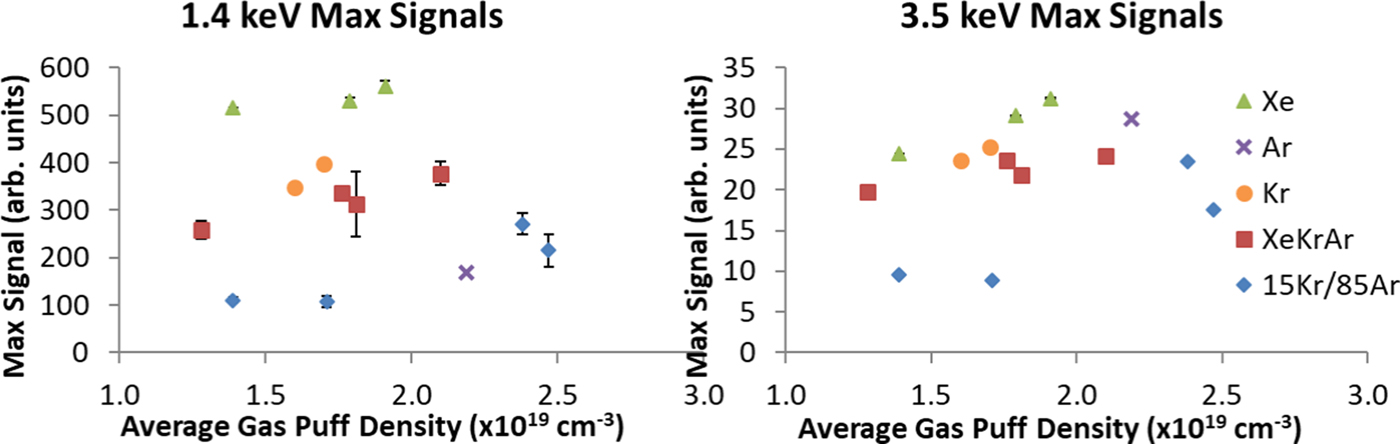
Peak X-ray-emission signals measured in the H80 detector package (Fig. 1), filtered to detect photons of >1.4 and >3.5 keV, are presented in Figure 3. Typical X-ray emission recorded by our time-resolved detectors lasted only several ns at full width at half maximum (FWHM), which is near the response time of the Si-diodes (0.5 ns). The temporal shape of the pulses is described in Kantsyrev et al. (Reference Kantsyrev, Schultz, Shlyaptseva, Petrov, Safronova, Petkov, Shrestha, Cline, Wiewior and Chalyy2016a) and consists of a sharp forefront (<1 ps) with a trailing edge. The vertical axes of the two plots are to scale, taking into account both individual detector sensitivity and the average spectral response of the Si-diodes >1.4 and >3.5 keV. For example, with Xe at a gas-puff atomic density of 1.4 × 1019 cm−3, the intensity on the detector at 1.4 keV is 20 times more than that at 3.5 keV. In both spectral regions, for a given gas, the X-ray emission varies weakly with gas puff density; however, a decrease in density generally corresponds to a decrease in diode signal. Among the gas-puff gases and mixtures, Xe emits the highest amount of radiation (>1.4 keV) followed by Kr and then the triple mixture.
Peak X-ray diode signals as a function of average gas puff density for two X-ray energy regions (a) >1.4 keV and (b) >3.5 keV. Error bars denote standard deviation on the Xe, XeKrAr, and 15Kr/85Ar data points and, in most cases, are smaller than the icons on the plot.
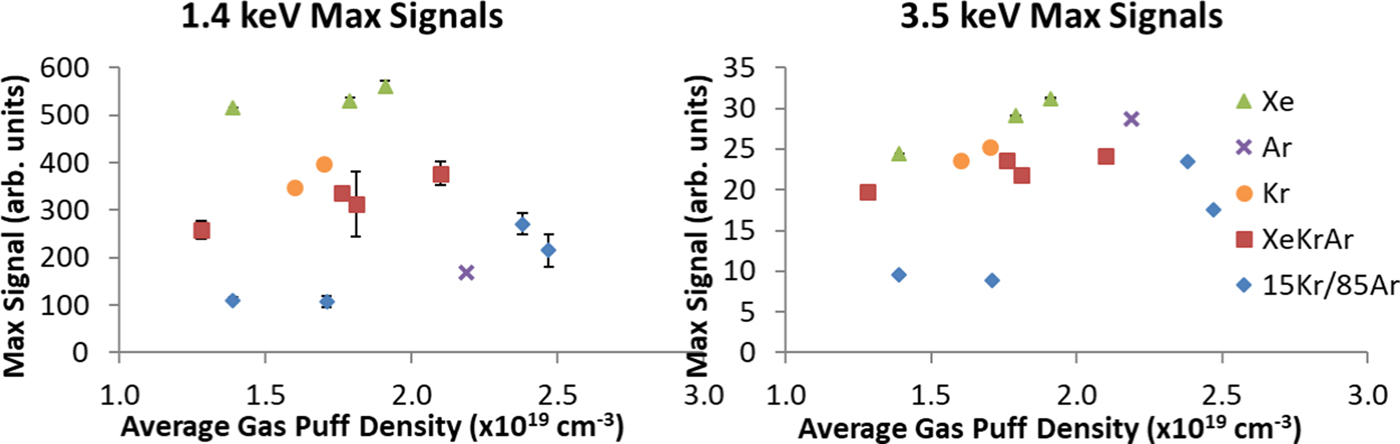
Plasmas emit radiation through bremsstrahlung, recombination, and line-emission. The strength of each depends on electron density, electron temperature, and charge state of the plasma. Previous results (Kantsyrev et al., Reference Kantsyrev, Schultz, Shlyaptseva, Petrov, Safronova, Petkov, Shrestha, Cline, Wiewior and Chalyy2016a, Reference Kantsyrev, Schultz, Shlyaptseva, Safronova, Shrestha, Petrov, Moschella, Petkov, Stafford, Cooper, Weller, Cline, Wiewior and Chalyy2016c; Gill et al., Reference Gill, Petkov, Safronova, Kantsyrev, Childers, Schultz, Shlyaptseva, Shrestha and Cooper2017) have shown that KrAr and XeKrAr gas-puff plasmas have similar electron densities and temperatures to experiments at the UNR Leopard laser. Therefore, the charge state is the leading parameter governing the power loss due to radiation. In general, the power loss scales as Zx, where Z is the charge of the ion and x is greater than one. For bremsstrahlung and recombination radiation (Griem, Reference Griem2005), x = 2 and, using previously measured charge states of Ar+16 and Xe+30 gives a 3.5× increase to emitted radiation for Xe. The 3.5 keV radiation is also greatest for Xe [Fig. 3(b)], but the strength of the Ar signal increases relative to the other gases in this higher-energy region. This relative growth is due to the exclusion of Kr L-shell (1.6–2 keV) and Xe M-shell (1 keV) lines with the 3.5 keV filter.
The addition of a new diagnostic gave us the ability to determine another parameter of critical importance for the laser-gas-puff interaction: The laser transmission through the gas puff and plasma. We define the (upper bound) fraction of laser energy absorbed by the gas puff as α according to
 $$\matrix{ {{\rm \alpha} = \displaystyle{{E_{{\rm Titan}}-E_{{\rm Spectralon}}} \over {E_{{\rm Titan}}}},} \cr} $$
where E Titan is the energy of the laser pulse and E Spectralon is the amount of laser energy incident on the scattering plate (approximately an f/1.5 solid angle about the laser propagation axis). It should be noted that laser energy can be spectrally or diffusely scattered by the gas puff in addition to being absorbed by the plasma or cold surrounding gas. Therefore, the reported data place an upper bound on the energy absorbed by the gas puff and plasma. We define the coefficient of conversion, ε, to be a measure of how efficiently the gas puff–laser interaction converts laser energy into X rays >2.4 keV. It is calculated by integrating the PCD signal in time and space (4π radians) and dividing by the energy of the laser pulse delivered to the gas puff. Due to anisotropy of the X-ray radiation, addressed in previous studies (Schultz et al., Reference Schultz, Kantsyrev, Safronova, Moschella, Wiewior, Shlyaptseva and Weller2016; Kantsyrev et al., Reference Kantsyrev, Schultz, Shlyaptseva, Petrov, Safronova, Petkov, Shrestha, Cline, Wiewior and Chalyy2016a, Reference Kantsyrev, Schultz, Shlyaptseva, Safronova, Shrestha, Petrov, Moschella, Petkov, Stafford, Cooper, Weller, Cline, Wiewior and Chalyy2016c) and later in this work, the values presented here provide an overestimation of ε.
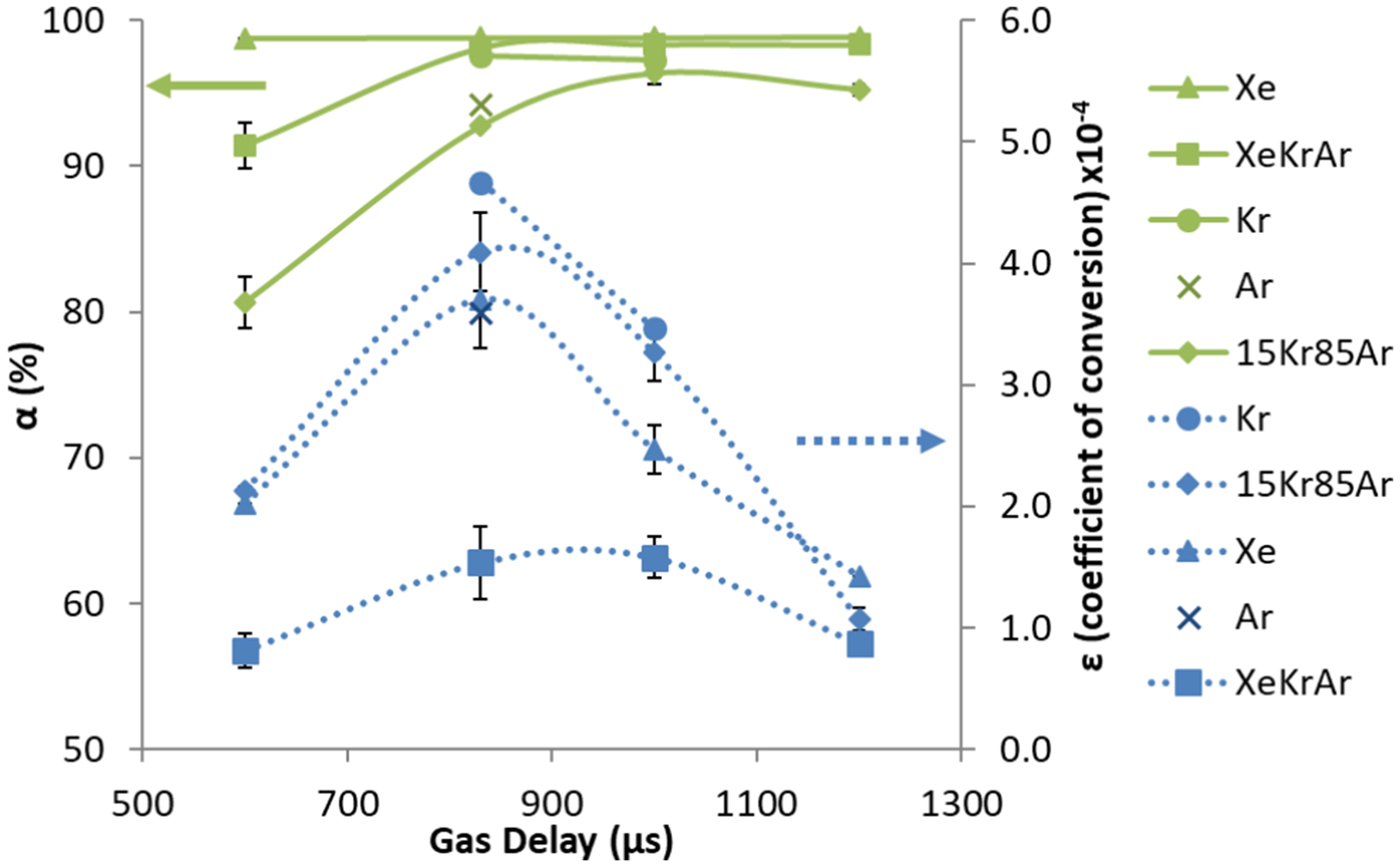
The relationship between ε and α is shown in Figure 4. Both the upper bound of energy absorption α and conversion efficiency ε vary with delay time (i.e. gas puff density). For all gas targets, the conversion efficiency ε reaches a maximum of 4.5 × 10⁻⁴ at 830 µs while the laser energy absorption approaches 100%. Absorption remains constant at >95%, however, the conversion efficiency sharply decreases after 830 µs. We theorize that the conversion efficiency into X rays, ε, depends more strongly on the gas-puff density (and of course, plasma electron density n e) rather than the energy absorbed by the gas puff, due to the  $n_e^2 $ dependence of the power emitted through line, recombination, and bremsstrahlung radiation rates (Griem, Reference Griem2005).
Coefficient of conversion of laser energy into X rays, ε, and fraction of absorbed laser energy by the gas puff, α, as a function of gas-puff delay time. Error bars denote standard deviation.
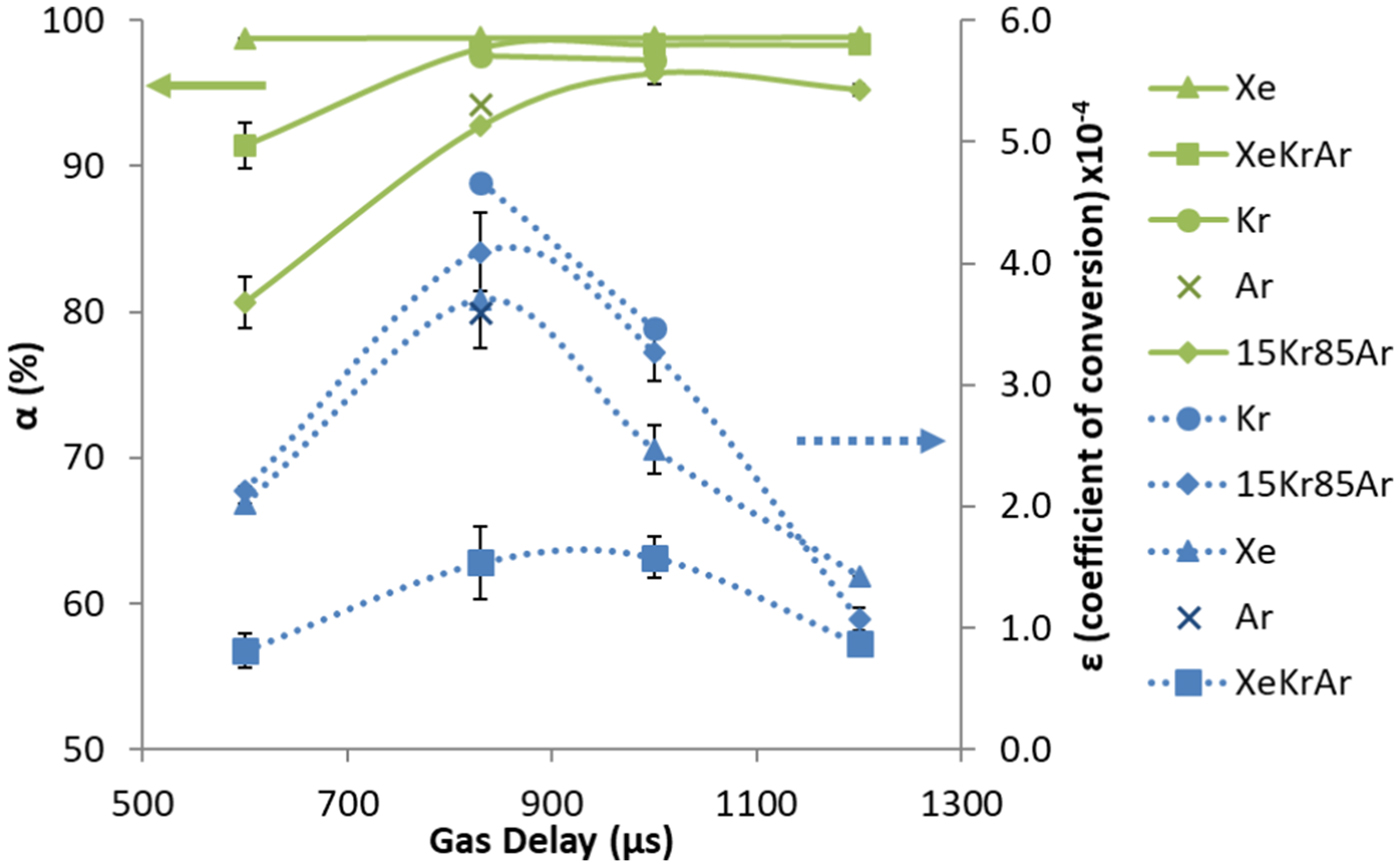
In our experiments, XeKrAr consistently exhibits the lowest ε, while Kr has the highest conversion efficiency. Additionally, the conversion efficiency for the double mixture is greater than that for Xe in the 2.4 keV spectral region (Fig. 4), likely due to the chosen filters (>2.4 keV), which are sensitive to L-shell Kr and Ar K α, both of which have strong emission above the filter cut-off energy (Kantsyrev et al., Reference Kantsyrev, Schultz, Shlyaptseva, Safronova, Shrestha, Petrov, Moschella, Petkov, Stafford, Cooper, Weller, Cline, Wiewior and Chalyy2016c). The strongest M-shell Xe lines we observed in the experiments (Gill et al., Reference Gill, Petkov, Safronova, Kantsyrev, Childers, Schultz, Shlyaptseva, Shrestha and Cooper2017) were emitted from 0.85 to 1.1 keV and have energies below the detection limit of the PCDs, which further helps to explain why Xe has a lower ε than Kr and KrAr gas puffs. The fact that the pure gases have stronger signals is surprising considering that our previous results (Kantsyrev et al., Reference Kantsyrev, Schultz, Shlyaptseva, Petrov, Safronova, Petkov, Shrestha, Cline, Wiewior and Chalyy2016a) showed that the mixtures produced the largest signals from radiation bursts. We surmise that it can be due to the different laser characteristics. The experiments in the present study were conducted at LLNL's Titan laser in its frequency-doubled mode, providing a pulse length of 700 fs at a wavelength of 527 nm, while the previous experiments (Schultz et al., Reference Schultz, Kantsyrev, Safronova, Moschella, Wiewior, Shlyaptseva and Weller2016; Kantsyrev et al., Reference Kantsyrev, Schultz, Shlyaptseva, Petrov, Safronova, Petkov, Shrestha, Cline, Wiewior and Chalyy2016a, Reference Kantsyrev, Schultz, Shlyaptseva, Safronova, Shrestha, Petrov, Moschella, Petkov, Stafford, Cooper, Weller, Cline, Wiewior and Chalyy2016c) took place at the University of Nevada, Reno's Leopard laser with 350-fs pulse length, 1.057-μm wavelength, 15-J energy, and (1–2) × 1019-W/cm2 intensity achieved with an f/1.5 OAP mirror. Titan has nearly ten times the energy of Leopard and the shorter wavelength causes it to be absorbed at higher densities, better coupling the laser beam and plasma. Not surprisingly, the absolute X-ray emission of the gas puff plasmas is larger for the Titan laser.
The most significant differences between the two systems are the laser beam wavelengths, the laser pulse durations, and the laser radiation intensity in the focal spot. The effects of pulse length on gas cluster–laser interactions at fixed laser energy have been studied (Parra et al., Reference Parra, Alexeev, Fan, Kim, McNaught and Milchberg2001; Faure et al., Reference Faure, Malka, Marquès, David, Amiranoff, Ta Phuoc and Rousse2002; Kim et al., Reference Kim, Milchberg, Faenov, Magunov, Pikuz and Skobelev2006; Lamour et al., Reference Lamour, Prigent, Rozet and Vernhet2007; Prigent et al., Reference Prigent, Deiss, Lamour, Rozet, Vernhet and Burgdörfer2008; Müller et al., Reference Müller, Kühl, Großmann, Vrba and Mann2013). For example, in Prigent et al. (Reference Prigent, Deiss, Lamour, Rozet, Vernhet and Burgdörfer2008), it was determined that a longer laser pulse length decreases X-ray yield, especially with laser pulse durations in the interval of 140–800 fs. In our case, the Titan laser has a pulse that is twice as long as that of the Leopard laser, and X-ray yield (with same laser radiation intensity in the focal spot) from Titan laser would be smaller. Laser wavelength has also been shown to affect X-ray emission in clustered gas puff (Kondo et al., Reference Kondo, Borisov, Jordan, Mc Pherson, Schroeder, Boyer and Rhodes1997; Schroeder et al., Reference Schroeder, Nelson, Borisov, Longworth, Boyer and Rhodes2001; Fennel et al., Reference Fennel, Meiwes-Broer, Tiggesbäumker, Reinhard, Dinh and Suraud2010); according to the aforementioned articles, shorter laser wavelength tends to increase X-ray yield. The radiation efficiency of clusters has been shown to have a wavelength dependence as well (Schroeder et al., Reference Schroeder, Omenetto, Borisov, Longworth, McPherson, Jordan, Boyer, Kondo and Rhodes1998). The 2ω Titan laser has half the wavelength of Leopard laser, and X-ray yield (with same laser radiation intensity in the focal spot) from Titan laser would be larger. The laser wavelength and pulse duration produce competing effects that compensate for each other when comparing Leopard and Titan. Therefore, the main factor will be the laser radiation intensity in the focal spot: 7 × 10¹⁹ W/cm2 for Titan laser versus 1019 W/cm2 for Leopard laser. In our studies, X-ray generation in pure gases is increased compared to the mixed gas targets mainly due to changing dynamics of ionization and recombination processes in plasma of clustered gas puff, with an increase in the laser radiation intensity in the focal spot of approximately an order of magnitude. Examples of such phenomena are described in Faure et al. (Reference Faure, Malka, Marquès, David, Amiranoff, Ta Phuoc and Rousse2002) and Lamour et al. (Reference Lamour, Prigent, Rozet and Vernhet2007) for both moderate and relativistic laser radiation intensities in the focal spot.
In these, as well as previous experiments, it was observed that the X-ray radiation is not isotropic. Strong X-ray anisotropy is observed, with the vertical Si-diodes detecting the smallest radiation signals. The degree of anisotropy was determined for the two horizontal detector packages (H80 and H130) compared to the vertical package by
 $$\matrix{ {{\rm Degree\;of\;Anisotropy} = \; \displaystyle{{H_{{\rm peak\; signal}}-V_{{\rm peak\; signal}}} \over {H_{{\rm peak\; signal}} + V_{{\rm peak\; signal}}}}.} \cr} $$
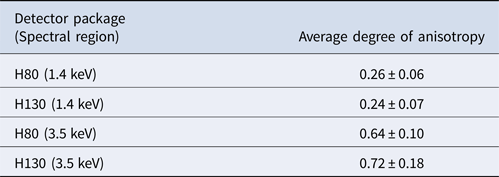
Table 1 shows the results of the calculations averaged over the entire Titan experimental campaign including each delay time and each gas target type. They can be summarized as follows. First, the degree of anisotropy is constant regardless of gas target type. Second, it is relatively independent of the horizontal detector position with the H80 and H130 degrees of anisotropy being similar. Third, harder X-ray radiation is more anisotropic. Finally, this anisotropy is not due to laser beam polarization inducing dipole radiation from the electron cloud. We observed the same anisotropy in the experiments at the Leopard laser; the Leopard and Titan lasers have linearly polarized beams in orthogonal directions: Vertical and horizontal, respectively. If laser beam polarization were the primary cause of the anisotropy, we would have observed a change in the anisotropy that favors emission in the vertical direction for the Titan laser (perpendicular to laser beam polarization).
Degree of anisotropy of X-ray emissions in two spectral regions for two horizontal detector positions
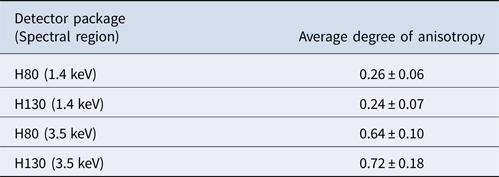
Results are averaged over the entire experimental campaign.
As discussed in the next section, several spectroscopic lines are optically thick, indicating reabsorption of photons by the plasma. This absorption causes a drop in the detected radiation but does not contribute to the observed anisotropy, assuming the colder plasma surrounding the focal spot was azimuthally symmetric about the laser propagation direction. However, because the gas puff propagation is in the vertical direction (Fig. 1), the amount of cold (<300 K), un-ionized gas between the plasma core and detectors is greatest for the vertical detectors. This provides the most plausible explanation for the anisotropy. Estimates of X-ray photon transmission through the cold gas puff above the focal spot suggests a transmission of <10% for photons with energy <4 keV. This transmission reaches 50% at ~15 keV for Kr or Xe gas; Ar is quite transparent to X rays >4 keV. However, the increased transmission of higher-energy X rays conflicts with the larger degree of anisotropy at 3.5 keV compared to 1.4 keV.
X-ray spectroscopy of laser-irradiated gas puffs
To provide a better understanding of the plasma conditions, X-ray spectroscopic measurements (integrated into both time and space) were performed. We are looking for a comparison of the electron temperature and density in the presented experiments with data obtained early in the UNR Leopard laser shots (Kantsyrev et al., Reference Kantsyrev, Schultz, Shlyaptseva, Petrov, Safronova, Petkov, Shrestha, Cline, Wiewior and Chalyy2016a, Reference Kantsyrev, Schultz, Shlyaptseva, Safronova, Shrestha, Petrov, Moschella, Petkov, Stafford, Cooper, Weller, Cline, Wiewior and Chalyy2016c): Will the laser-produced, gas-puff plasmas be hotter or cooler, more dense or less? The same time-integrated, X-ray spectrometers and pinhole cameras and the same set of time-resolved X-ray detectors were used in both studies. Non-local thermodynamic equilibrium (non-LTE) kinetic modeling of the observed L-shell Kr and K-shell Ar spectra delivers estimates of the electron temperature T e and electron density n e, and furthermore, yields insight into the different radiative signatures from pure versus mixed gas-puff plasmas. The two non-LTE models used here have been previously employed to analyze and model L-shell Kr and K-shell Ar spectra produced from experiments on the 1ω 1.057-μm UNR Leopard Laser (Schultz et al., Reference Schultz, Kantsyrev, Safronova, Moschella, Wiewior, Shlyaptseva and Weller2016; Kantsyrev et al., Reference Kantsyrev, Schultz, Shlyaptseva, Petrov, Safronova, Petkov, Shrestha, Cline, Wiewior and Chalyy2016a, Reference Kantsyrev, Schultz, Shlyaptseva, Safronova, Shrestha, Petrov, Moschella, Petkov, Stafford, Cooper, Weller, Cline, Wiewior and Chalyy2016c). The atomic data for both models is calculated using the Flexible Atomic Code (Gu, Reference Gu2008). For the L-shell Kr model, the ground states are included for every ionization level, and we specify details for H-like to Al-like ions in singly and doubly excited states. In particular: The singly excited states are included up to n = 6 for H-like ions, with a total of 30 levels, and n = 5 for He-like and Li-like ions, where a total of 90 and 101 levels are included. For Be-, B-, C-, N-, O-, and F-like ions, we include up to n = 4 with a total of 128, 169, 401, 486, 421, and 268 levels, respectively. Up to n = 5 is specified for Ne-like and Na-like ions, where a total of 141 and 1029 levels are included and a total of 1273 and 385 levels up to n = 4 for Mg-like and Al-like ions, respectively, are included. The doubly excited states include up to n = 3 for He-, Li-, Na-, Mg-, and Al-like ions, and n = 2 for Be-like ions. Altogether, the Kr model has 4957 levels. The K-shell Ar model has a similar energy structure and is described with more detail in Kantsyrev et al. (Reference Kantsyrev, Schultz, Shlyaptseva, Safronova, Shrestha, Petrov, Moschella, Petkov, Stafford, Cooper, Weller, Cline, Wiewior and Chalyy2016c). The intensities of the synthetic spectra depend on theoretical plasma parameters such as electron temperature T e, electron density n e, and a fraction of hot electrons f, if present.
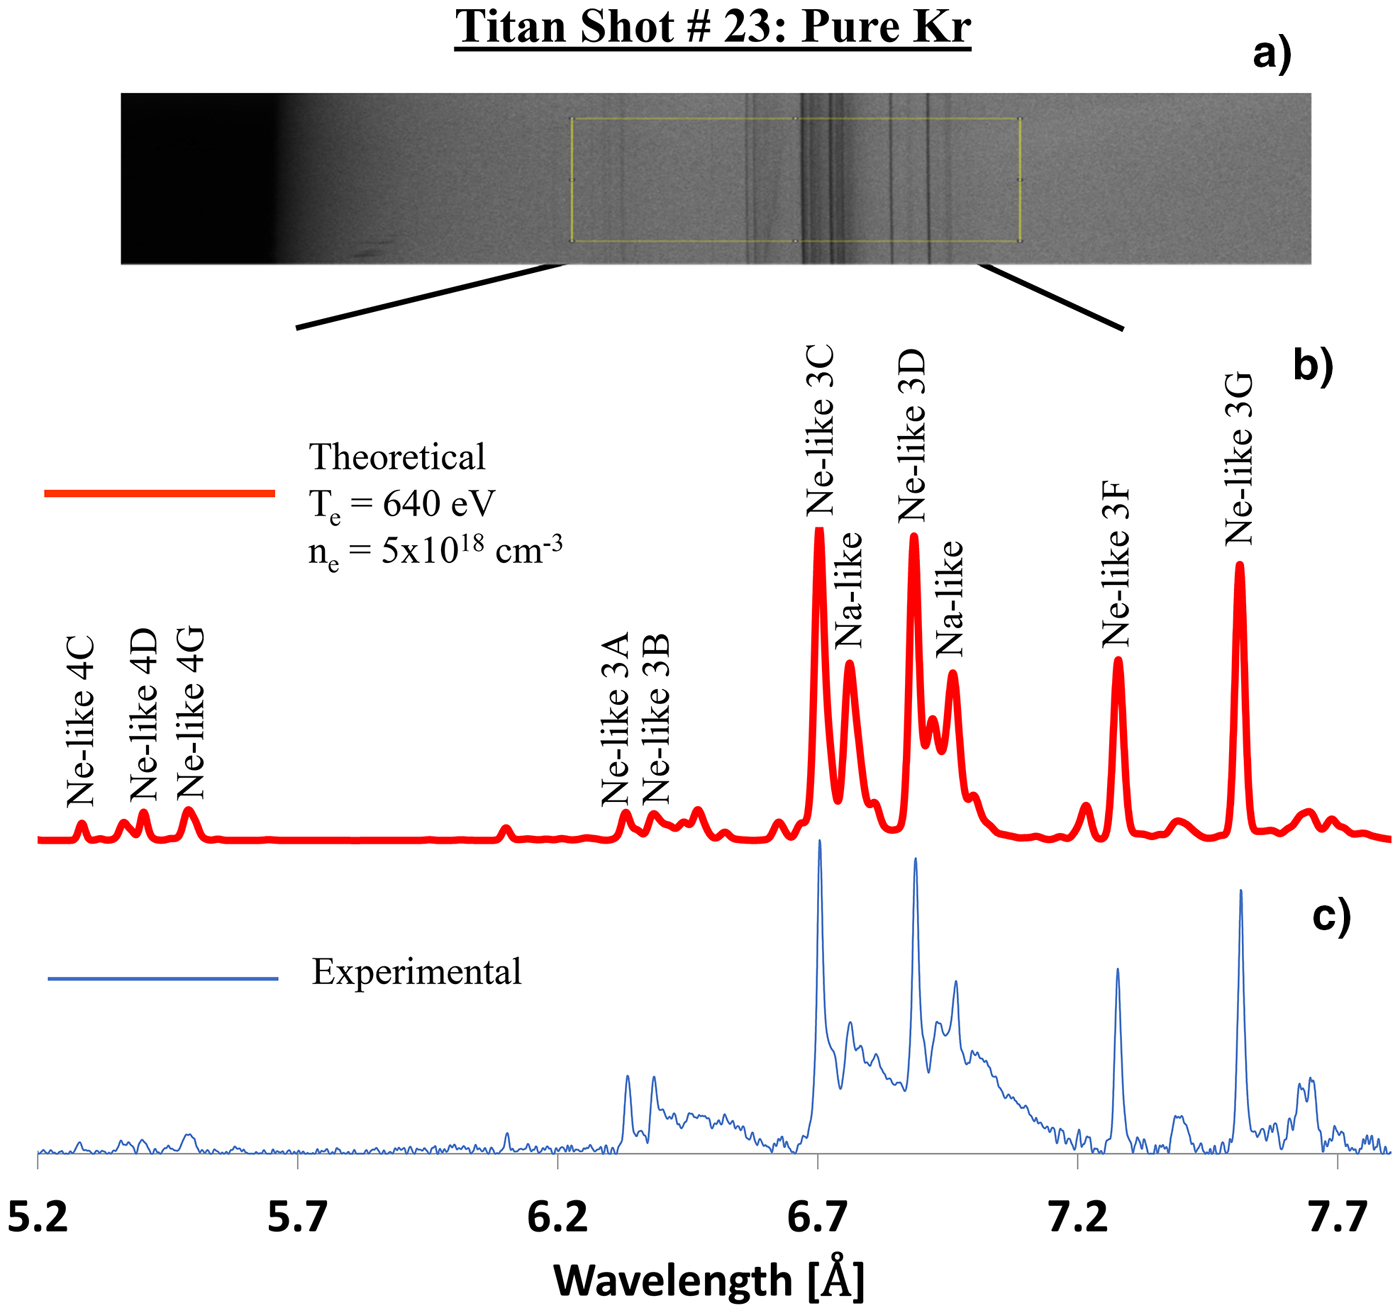
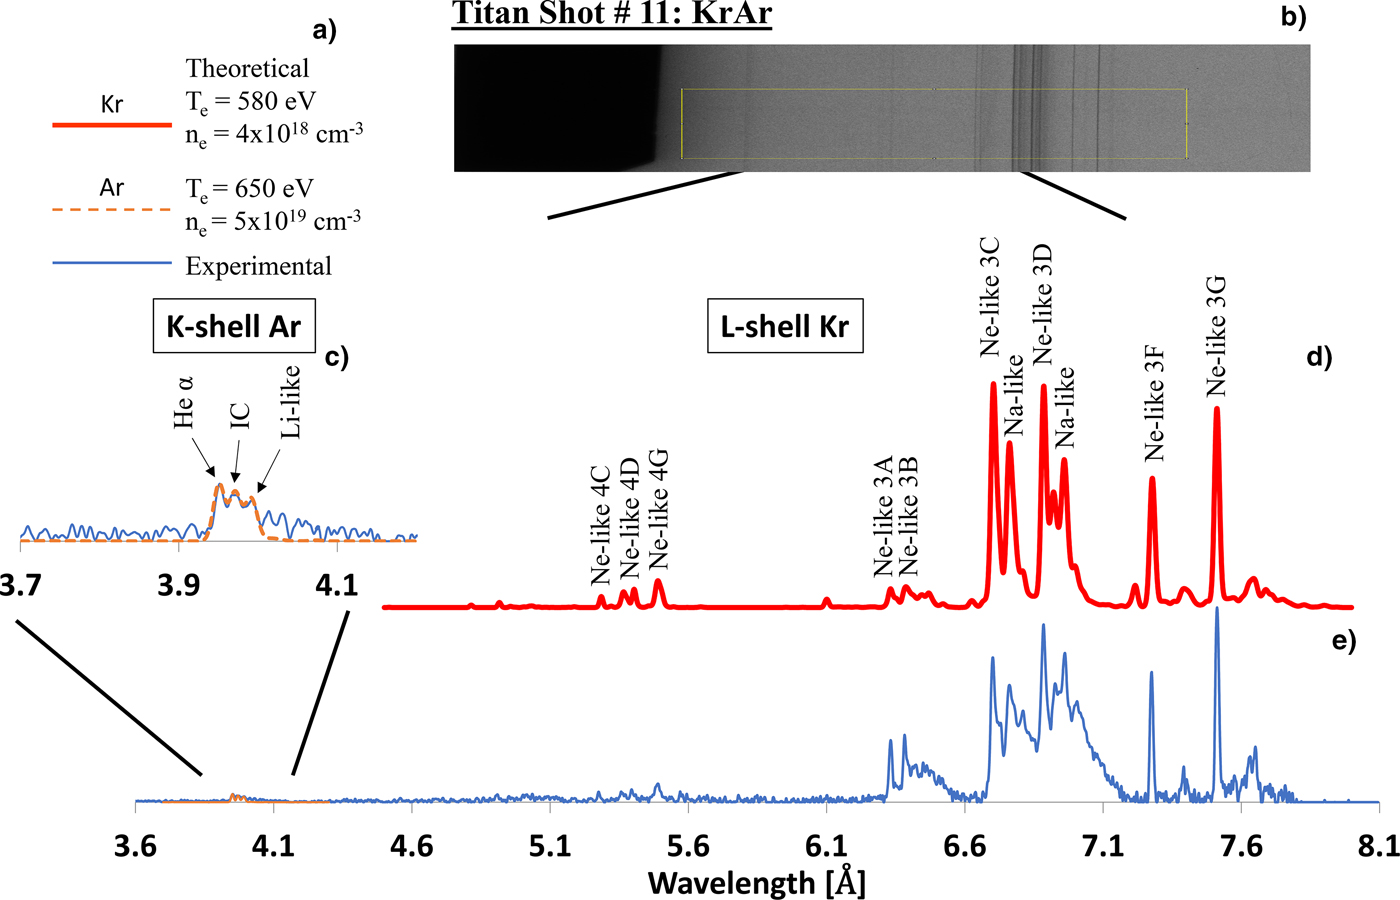
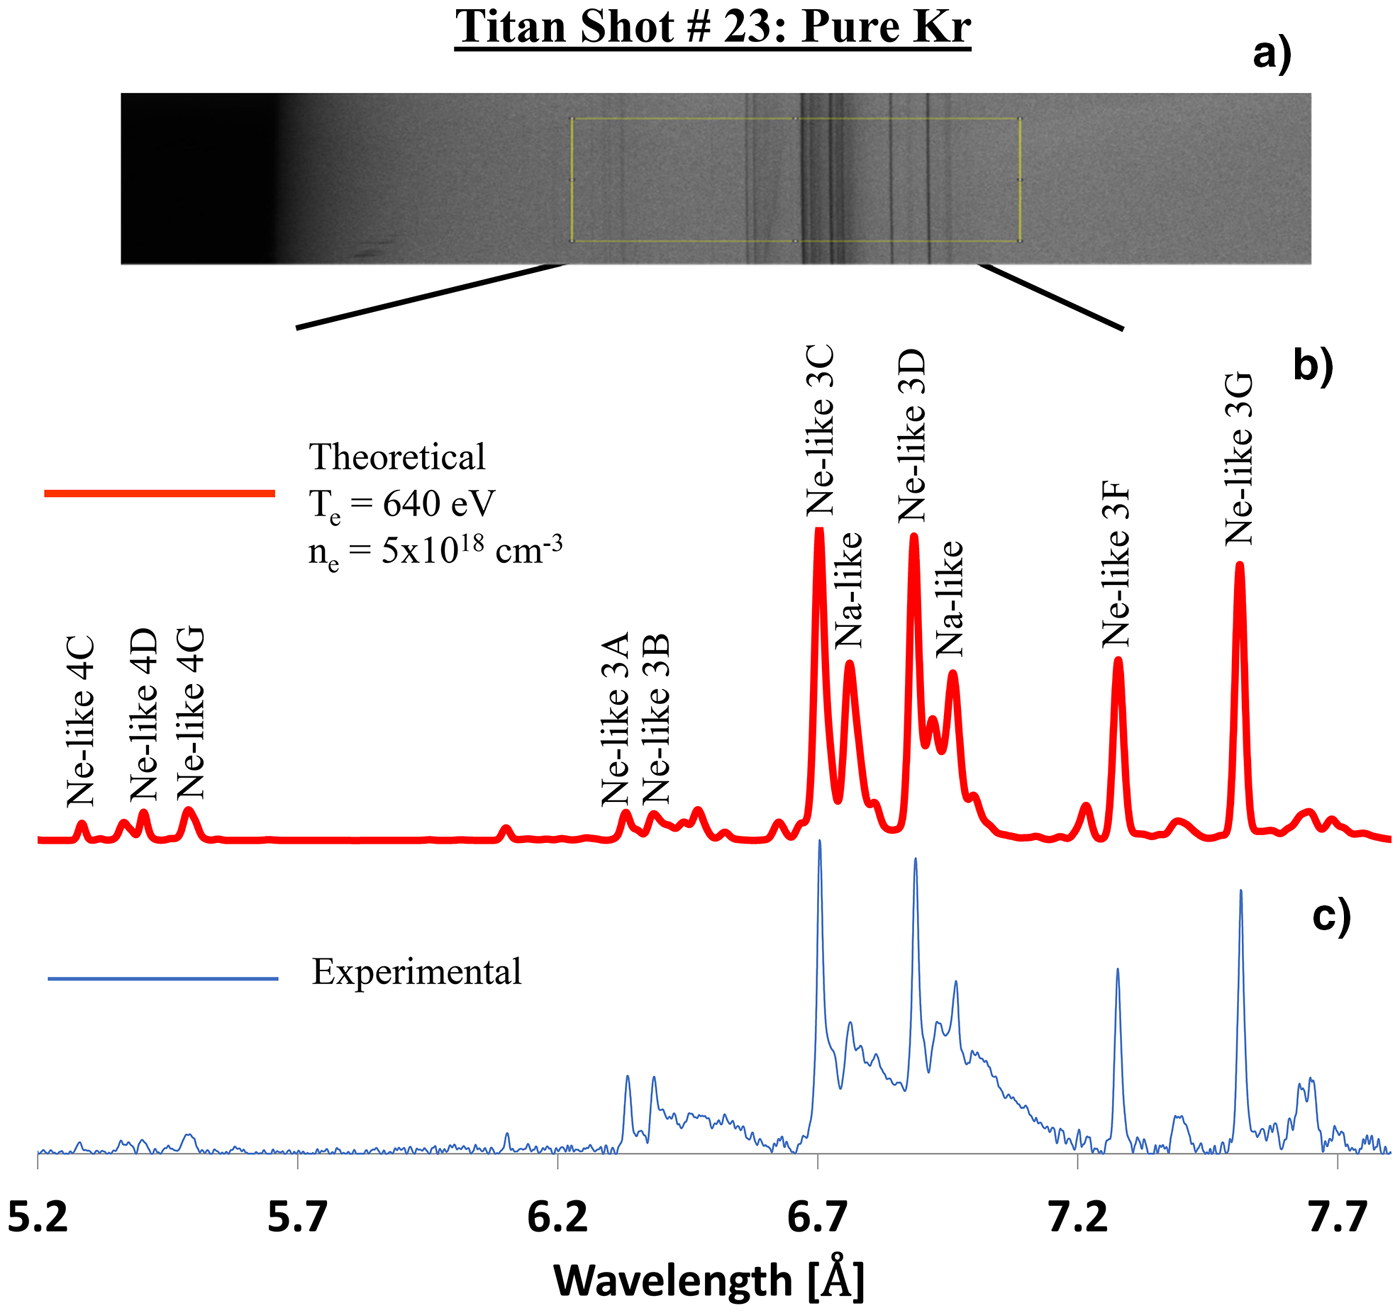
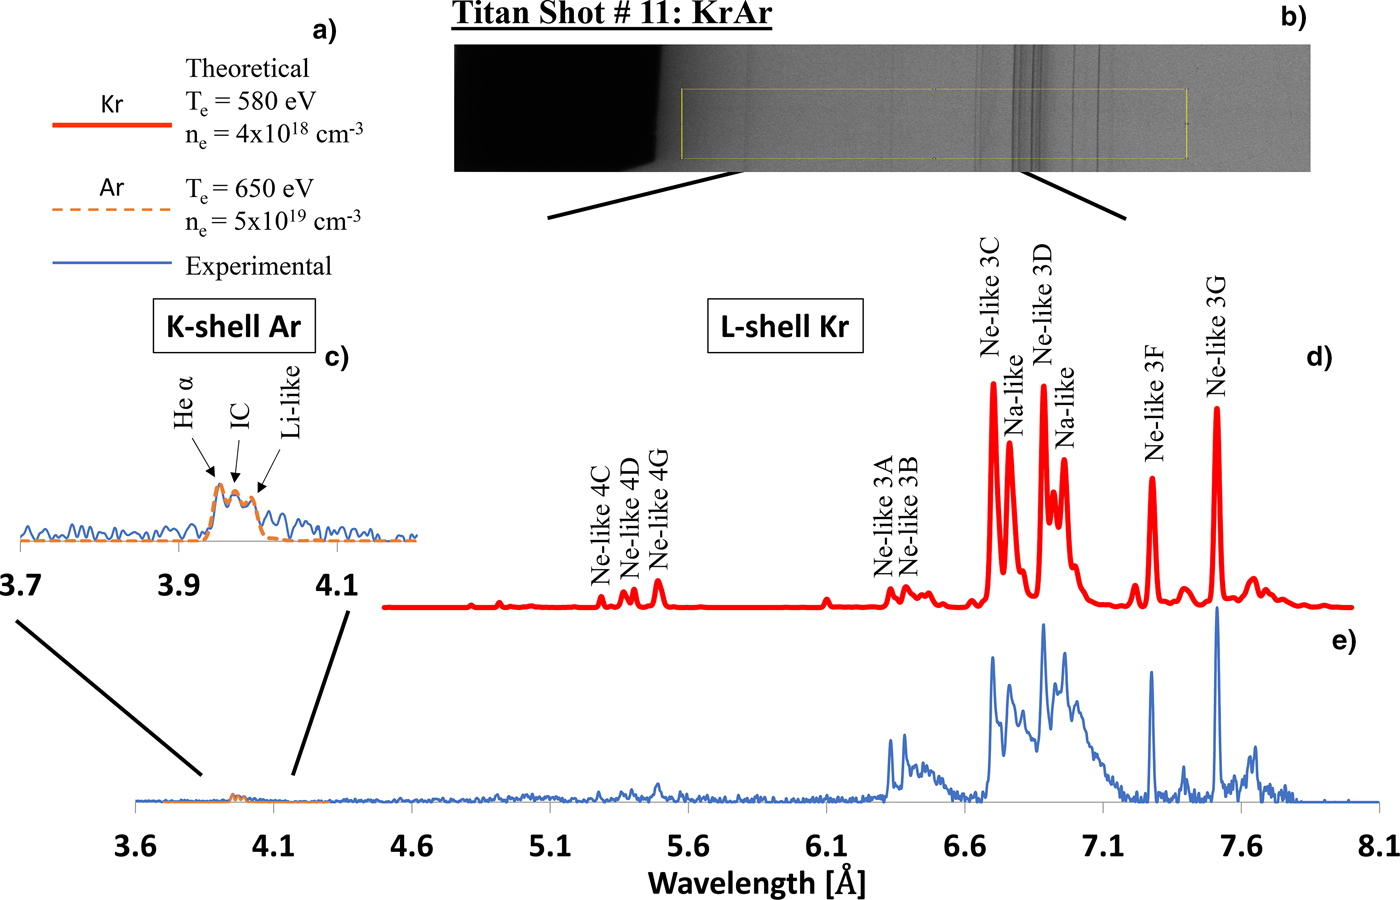
Examples of two experimental spectra collected using the KAP crystal spectrometer described in the section “Experimental details,” along with corresponding modeling, are shown in Figures 5 and 6. Specifically, Figure 5 shows the results from Titan shot #23 using pure Kr, and Figure 6 displays results from Titan shot #11 using the KrAr mixture. The raw experimental data are at the top of each figure. In order to model the spectra, a lineout is first taken across each film, and the corresponding intensities are adjusted for the 2-μm doubly aluminized Mylar filter placed between the radiation source and KAP crystal in the spectrometer. Additional pre-processing includes calibrating the raw spectra to the appropriate wavelength region. Finally, the experimental plasma parameters are estimated by matching theoretical line intensities to the experimental ones.
(a) Raw, experimental L-shell Kr X-ray spectra produced in a pure Kr gas puff (shot #23) and captured by the KAP crystal spectrometer. The (b) red and (c) blue traces correspond to theoretical and experimental spectra, respectively.
(b) Raw, experimental X-ray spectra produced in a KrAr gas puff and captured by the KAP crystal spectrometer (shot #11). (a)The legend displays results of modeling electron temperature T e and density ne for Kr and for Ar, respectively. (c) the dashed (orange) trace corresponds to theoretical K-shell Ar spectra, and the solid (blue) trace correspond to experimental K-shell Ar spectra in region 3.7–4.1 Å, respectively. Also, (d) thick (red) and (e) thin (blue) traces correspond to theoretical and experimental L-shell Kr spectra, respectively.
Spectroscopic modeling for Titan shot #23 with pure Kr indicates an electron temperature of T e = 640 eV and an electron density of n e = 5 × 1018 cm−3. The uncertainty in the determination of an electron temperature T e was ± 10%, and an electron density n e was ± 10%. The electron density is estimated by matching the intensity of the Ne-like 3F and 3 G lines. The electron temperature instead uses the intensity ratio of the Na-like satellite lines near the Ne-like 3C and 3D lines, as well as matching the intensity of the mostly optically thin 2–4 transitions which are on the lower end of the wavelength region in the spectrum. The estimated electron density is an order of magnitude lower than the atomic density and, with Ne-like Kr evident in the spectra, one would expect electron densities on the order of 1021 cm−3. However, previous MD modeling (Kantsyrev et al., Reference Kantsyrev, Schultz, Shlyaptseva, Petrov, Safronova, Petkov, Shrestha, Cline, Wiewior and Chalyy2016a) suggests nearly instantaneous (several fs) disassociation and explosion of the gas clusters. Pinhole camera images (Fig. 12) also demonstrate that the plasma has expanded significantly, evidenced by the smaller emission region at higher X-ray energies. This explains the lower densities from the spectral fit. We conclude that the spectral lines presented in Figures 5 and 6 at 3.7–8 Å (3.4–1.5 keV) are generated in the hot central region of the plasma.
For Titan shot #11 with the KrAr mixture, the spectrometer recorded both L-shell Kr and K-shell Ar radiation. Non-LTE modeling of these signatures indicates an electron temperature of T e = 580 eV and an electron density of n e = 4 × 1018 cm−3 for L-shell Kr, and T e = 650 eV and n e = 5 × 1019 cm−3 for K-shell Ar. The plasma in Titan shot #23 is almost optically thin, evidenced by comparing the ratios of the 3C and 3D line intensities and the shape of the lines. We are also able to describe the 2–4 transitions that are usually much less influenced by opacity effects. For Titan shot #11 however, the lines appear to be broadened and optically thick. Moreover, the 3C intensity is less than 3D, which further suggests that the plasma is optically thick.
We observe that in comparison with pure Kr and KrAr gas puffs at the 1ω Leopard laser (Kantsyrev et al., Reference Kantsyrev, Schultz, Shlyaptseva, Petrov, Safronova, Petkov, Shrestha, Cline, Wiewior and Chalyy2016a, Reference Kantsyrev, Schultz, Shlyaptseva, Safronova, Shrestha, Petrov, Moschella, Petkov, Stafford, Cooper, Weller, Cline, Wiewior and Chalyy2016c), the new 2ω Titan results indicate a T e approximately 1.5× higher and a n e almost two orders of magnitude lower. Unlike the gas-mixture experiments on the 1ω Leopard laser, where Ar spectra showed only the “cold” K α line, the Ar spectra produced by the Titan laser manifest ionic-emission lines, namely the Ar He-α and intercombination (IC) lines, which are associated with much hotter K-shell Ar plasmas. Previously, the presence of the “cold” K α line indicated poor heating in the plasmas and we concluded that the Ar gas inefficiently clustered in the mixtures, supported by a study which showed homogeneous or heterogeneous clusters can be formed in KrAr gas-puff mixtures (Danylchenko et al., Reference Danylchenko, Kovalenko, Konotop and Samovarov2015). However, in experiments on the Titan laser, the Ar ions in the mixture plasma produced higher-energy, ionic-emission spectra. The gas-puff properties remained constant between experiments, while the intensity in the focal spot was seven times higher with Titan than with the Leopard laser; this new data imply that Ar does in fact cluster in the mixtures, but requires more incident laser power to produce ionic-emission lines. Hence, a change in laser beam parameters drives different phenomena in the gas puffs.
Electron beam generation in laser-irradiated gas puffs
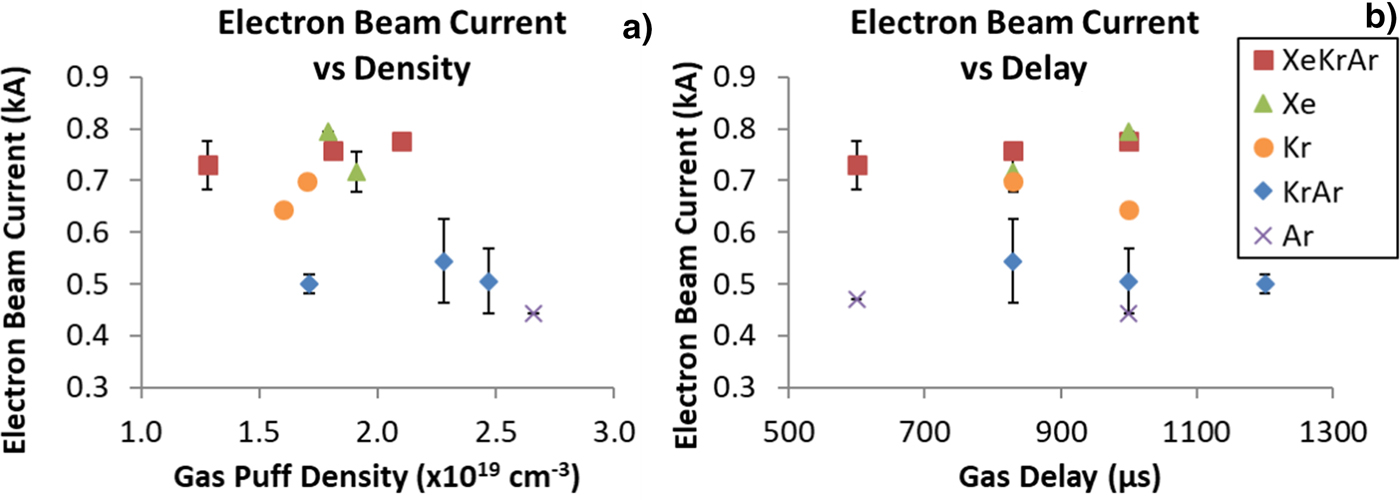
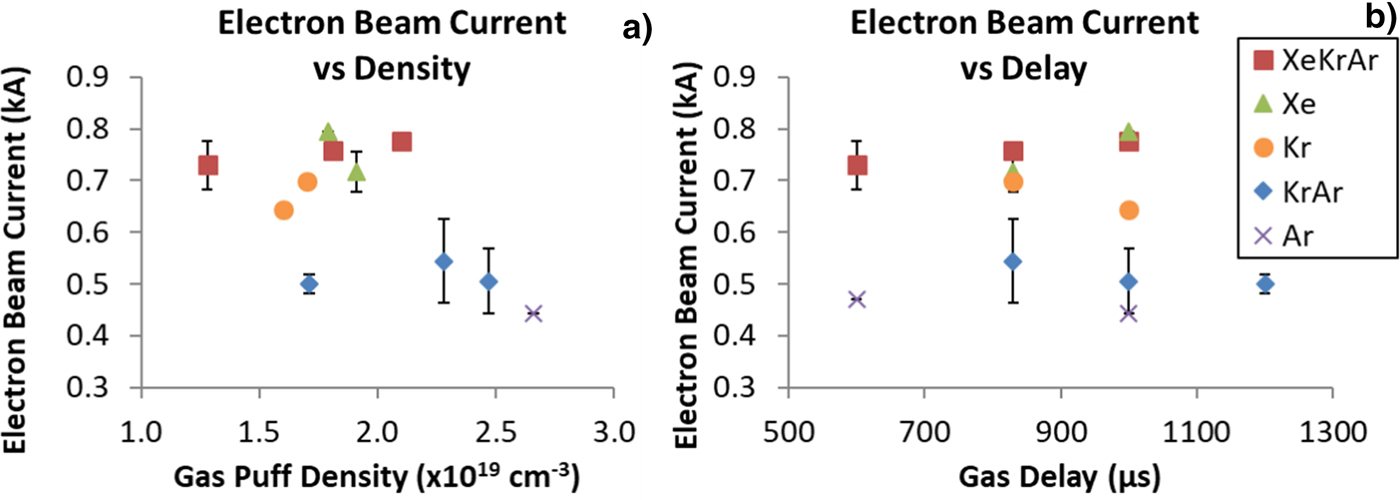
Faraday cup signals for electrons with energy >72 keV (12.5 µm Cu filter) were collected along the laser beam path directly behind the gas puff (Fig. 1) and lasted 10–15 ns. Figure 7 implies that electron beam current is relatively independent of the gas delay. However, the gas type does affect the magnitude of the current. The total charge in the electron pulses was in the μC-range. The triple mixture exhibits the highest peak electron beam current at 0.76 kA compared to both the KrAr mixture and Ar with the smallest current at around 0.5 kA. Previous experiments (Kantsyrev et al., Reference Kantsyrev, Schultz, Shlyaptseva, Petrov, Safronova, Petkov, Shrestha, Cline, Wiewior and Chalyy2016a) with gas-puffs on the Leopard laser showed a peak beam current of 0.6 kA, meaning a 20% increase in current for XeKrAr was achieved. The double mixture experienced an even larger increase. On the Leopard laser, an electron beam current of 0.2 kA was observed for KrAr, compared to 0.5 kA on Titan, which is a 2.5× increase.
Electron beam current as a function of gas-delay time measured by Faraday cups. Error bars represent the standard deviation of the data when multiple shots were available.
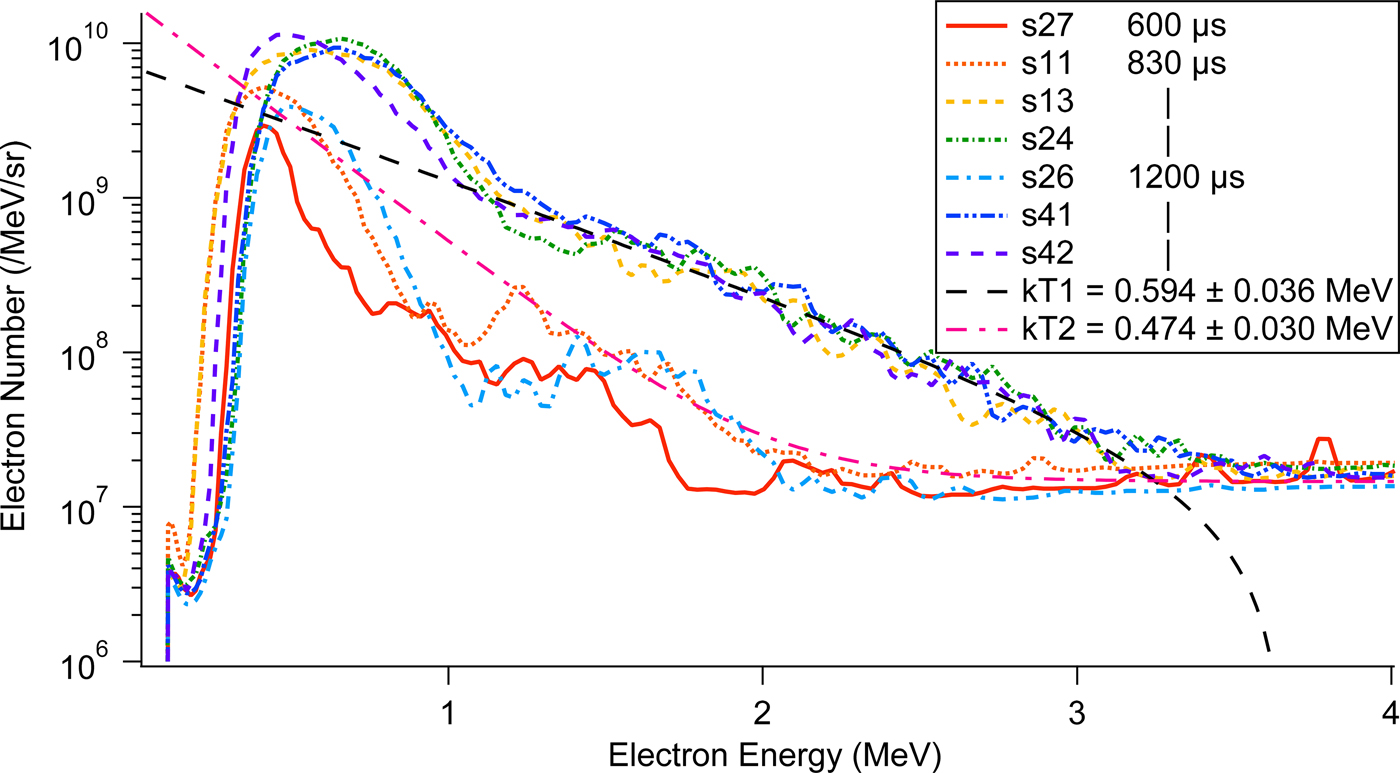
The EPPS was used to record spectra of >100 keV electron and proton/ion beams. Ar and KrAr gas puffs reliably produced measurable electron spectra. For the KrAr mixture, the shots with observable spectra are shown in Figure 8. The left axis is normalized by electron energy and the solid angle of detection. The time-fade of the image plate signal was also taken into account (Maddox et al., Reference Maddox, Park, Remington, Izumi, Chen, Chen, Kimminau, Ali, Haugh and Ma2011). Note that the electron quiver energy in the laser field is 7 MeV and its effect is not observed in our experiments. Multiple shots were performed at each gas delay and, while the magnitude of detected electrons varies, the maximum counts occurred reliably at 0.5–0.6 MeV. For comparison, the Ar gas puffs also produced spectra peaked near 0.7 MeV. The FWHM of the spectra varied between 0.2 and 0.6 MeV, with both the 600 and 1000 µs delay being on the lower side of the range.
Electron spectra recorded by the EPPS for different delays of the KrAr gas-puff targets. Exponential fits of shots 42 and 11 (kT1 and kT2, respectively) indicate slope temperatures of 0.594 and 0.474 MeV.
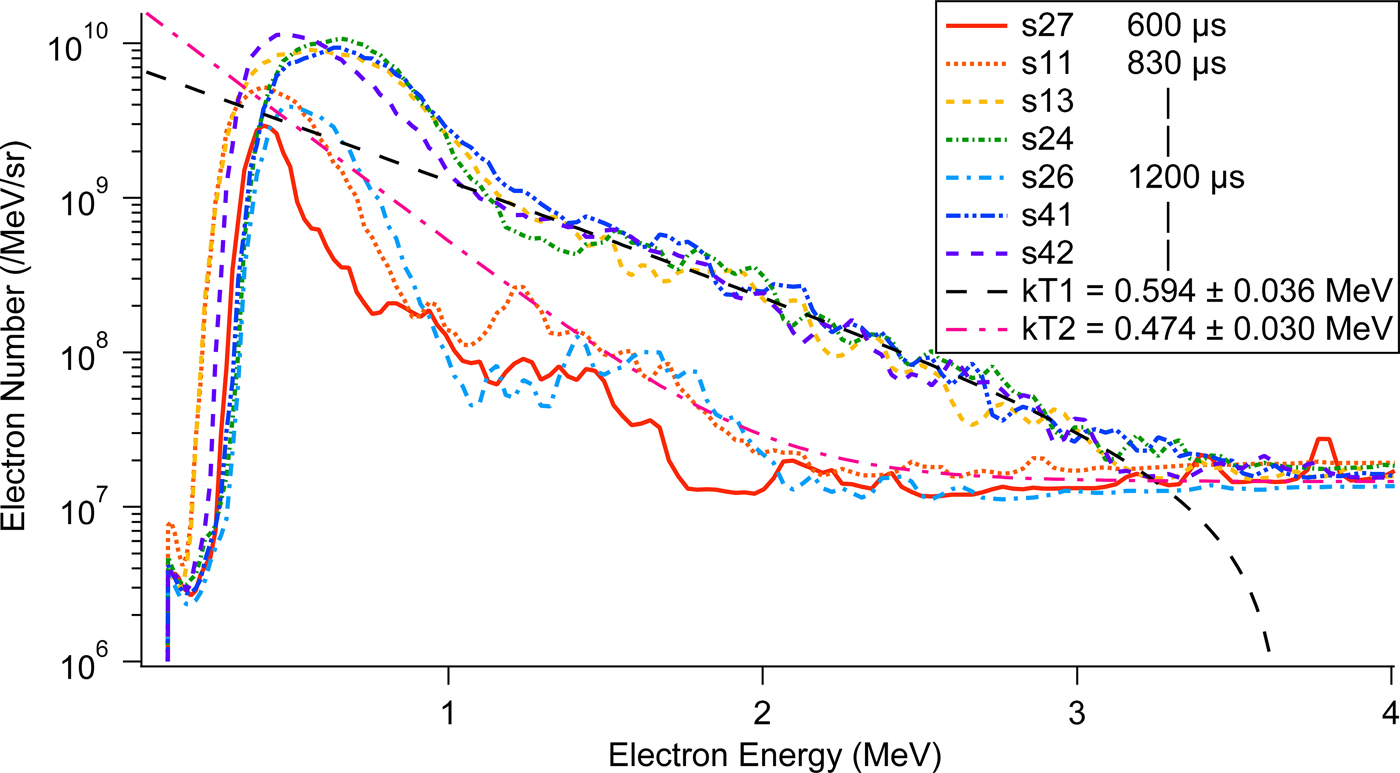
Included in Figure 8 are several exponential fits to the data using y(E) = e −E/kT, with E as electron energy and kT as the temperature of the electrons. These fits indicate slope temperatures of 0.4–0.6 MeV and are consistent with an effective temperature of the “hot electrons,” a fast electron component moving along the laser propagation direction, generated by sub-picosecond lasers at near-relativistic intensities. The scaling of the hot electron temperature with laser intensity and wavelength is well known (Beg et al., Reference Beg, Bell, Dangor, Danson, Fews, Glinsky, Hammel, Lee, Norreys and Tatarakis1997; Chen et al., Reference Chen, Wilks, Kruer, Patel and Shepherd2009)
 $$T_{{\rm hot}} \sim({\rm I}{\rm \lambda} ^2)^{1/3}.$$
For the frequency-doubled Titan laser, Beg's formula (Beg et al., Reference Beg, Bell, Dangor, Danson, Fews, Glinsky, Hammel, Lee, Norreys and Tatarakis1997), T hot ≅ 100(I17λ2[μm])1/3, yields T hot ≅ 580 keV. This estimate agrees with the highest slope temperature of the electron spectra measured in our experiment (Fig. 8).
In contrast to the double mixture and pure Ar, no high energy electrons were detected for any pure Kr gas puff. Therefore, Ar must be a strong factor in the production of high energy (>100 keV) electrons. In mixed gas puffs, it was previously reported (Kantsyrev et al., Reference Kantsyrev, Schultz, Shlyaptseva, Petrov, Safronova, Petkov, Shrestha, Cline, Wiewior and Chalyy2016a, Reference Kantsyrev, Schultz, Shlyaptseva, Safronova, Shrestha, Petrov, Moschella, Petkov, Stafford, Cooper, Weller, Cline, Wiewior and Chalyy2016c) that Ar gas in the targets does not produce clusters, as evidenced by the presence of the cold K α line observed in a non-clustered gas puff. This spectroscopic line in the absence of more thermal X rays (low background noise) indicates an electron beam in the plasma strong enough to produce inner shell vacancies. The EPPS also could not detect electron spectra for Xe and XeKrAr mixture gas puffs. Out of the 11 XeKrAr shots, only one produced an analyzable electron spectrum that peaked sharply at 0.7 MeV (FWHM of 340 keV). Eleven Xe shots produced no measurable spectra. The Faraday cup data show that the Xe and triple mixture plasmas produce electrons with at least 72 keV in energy. It is surmised that the electron beam energy in the pure and mixed Xe gas puffs might not exceed the detection threshold of the spectrometers. Another reason for measurable Faraday cup signals but no detectable spectra may be due to electron beam interactions with gas-plasma-vacuum boundaries or with the plasma itself.
Achievement of a strong X-ray flash and MeV-scale electron beams from a laser-irradiated gas puff
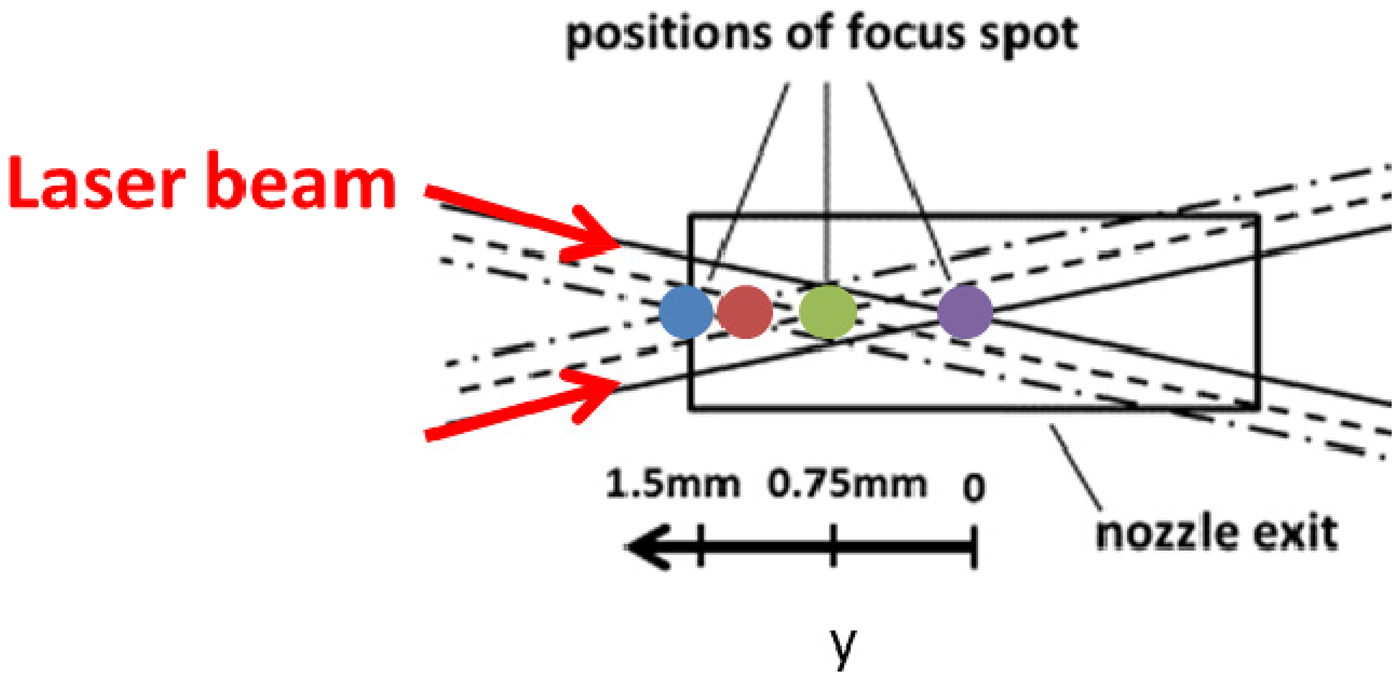
During the experiments described so far, the laser beam was focused in the center of the gas puff (Fig. 1). Additional shots scanned the focal spot position of the laser beam incrementally towards the front edge of pure Xe gas puffs (at a gas delay of 830 µs) as indicated in Figure 9. This produced drastic changes in X-ray emissions and electron-beam generation from Xe laser-irradiated gas-puff plasmas (Kantsyrev et al., Reference Kantsyrev, Schultz, Shlyaptseva, Safronova, Cooper, Shrestha, Petkov, Stafford, Moschella, Schmidt-Petersen, Butcher, Kemp, Andrews and Fournier2016b).
Location of the four shots taken at various values of y overlaid on the supersonic linear nozzle exit. View from the top.
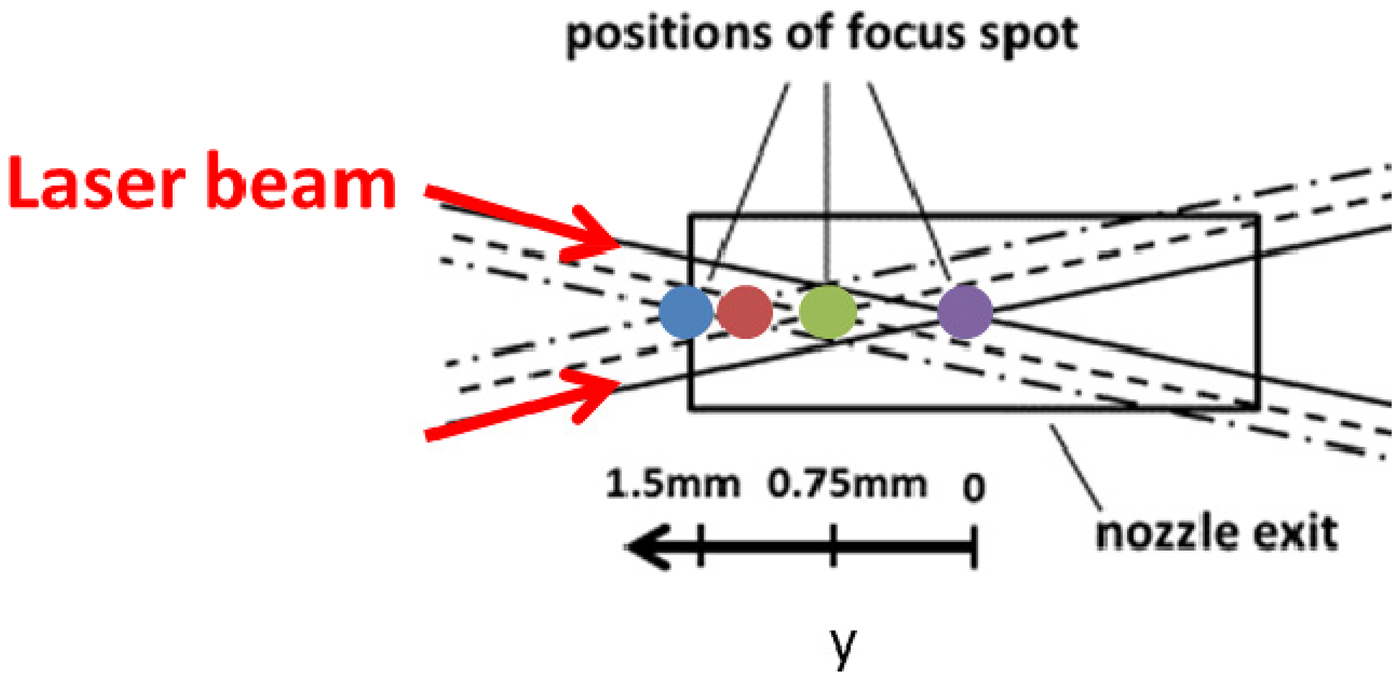
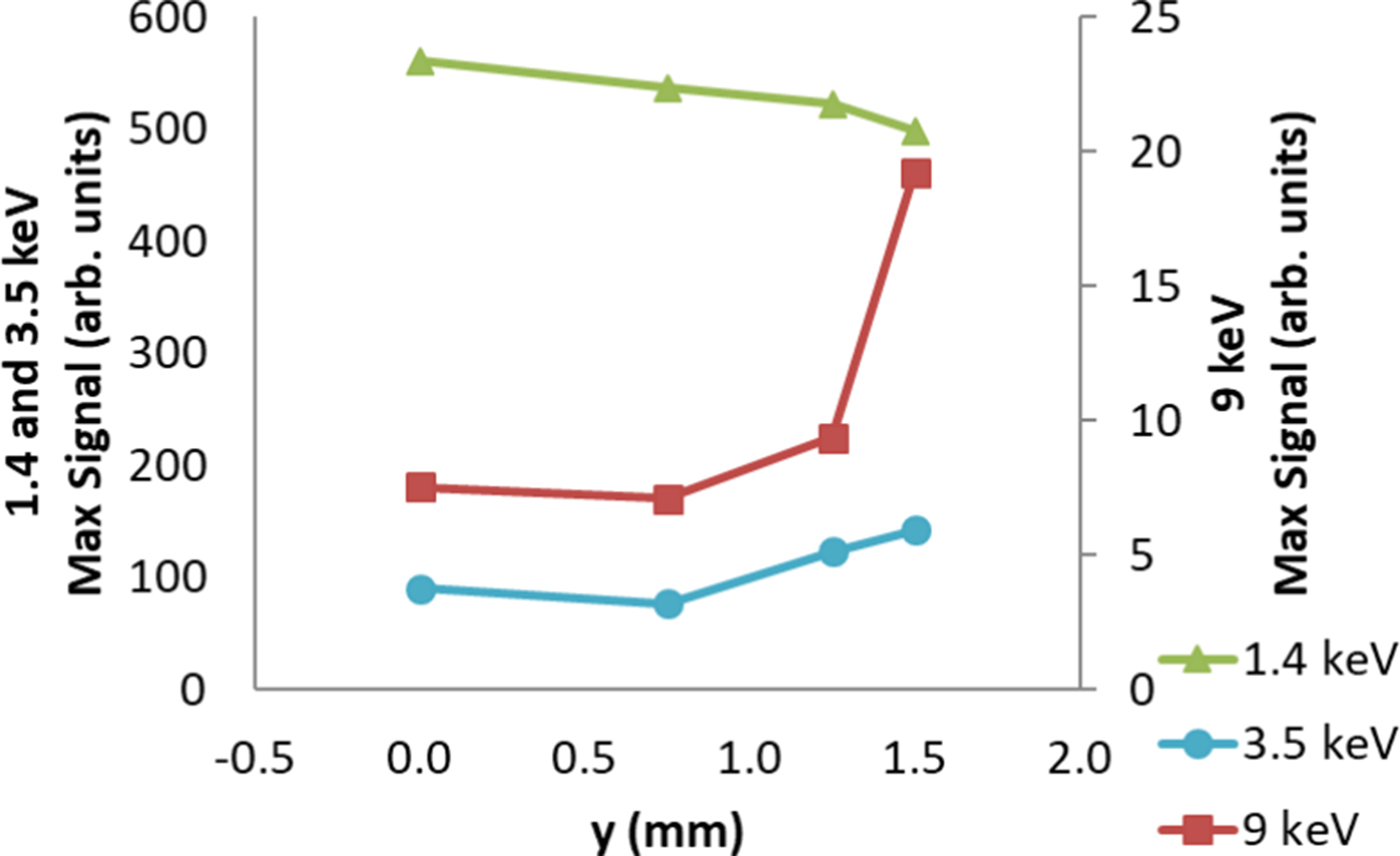
Maximum Si-diode signals for focal scan sequence of shots are summarized in Figure 10 for the detectors located at θ = 130°, though the same trends are seen in all observed directions. In the softer X-ray region (>1.4 keV), the strongest signals are observed for y = 0 mm and decrease with increasing parameter y. In the harder X-ray regions, both the >3.5 keV and >9 keV Si-diodes detected increasing X-ray emission with an increase in the y parameter (Fig. 9). Note that throughout the described experimental campaign, including the results in the previous section, signals on the 9 keV diode were weak, and only occasionally rose above noise levels. A sharp jump in the X-ray yield >9 keV is observed for y = 1.5 mm and saturated the signals on the oscilloscope. Even though the 9 keV signals do not show the true peak measurement, they are still presented to show the drastic difference in signal strength.
Relative intensity of Xe gas-puff plasma X-ray emissions for the scanned laser focal spot positions measured by Si-diodes at 1.4, 3.5, and 9 keV.
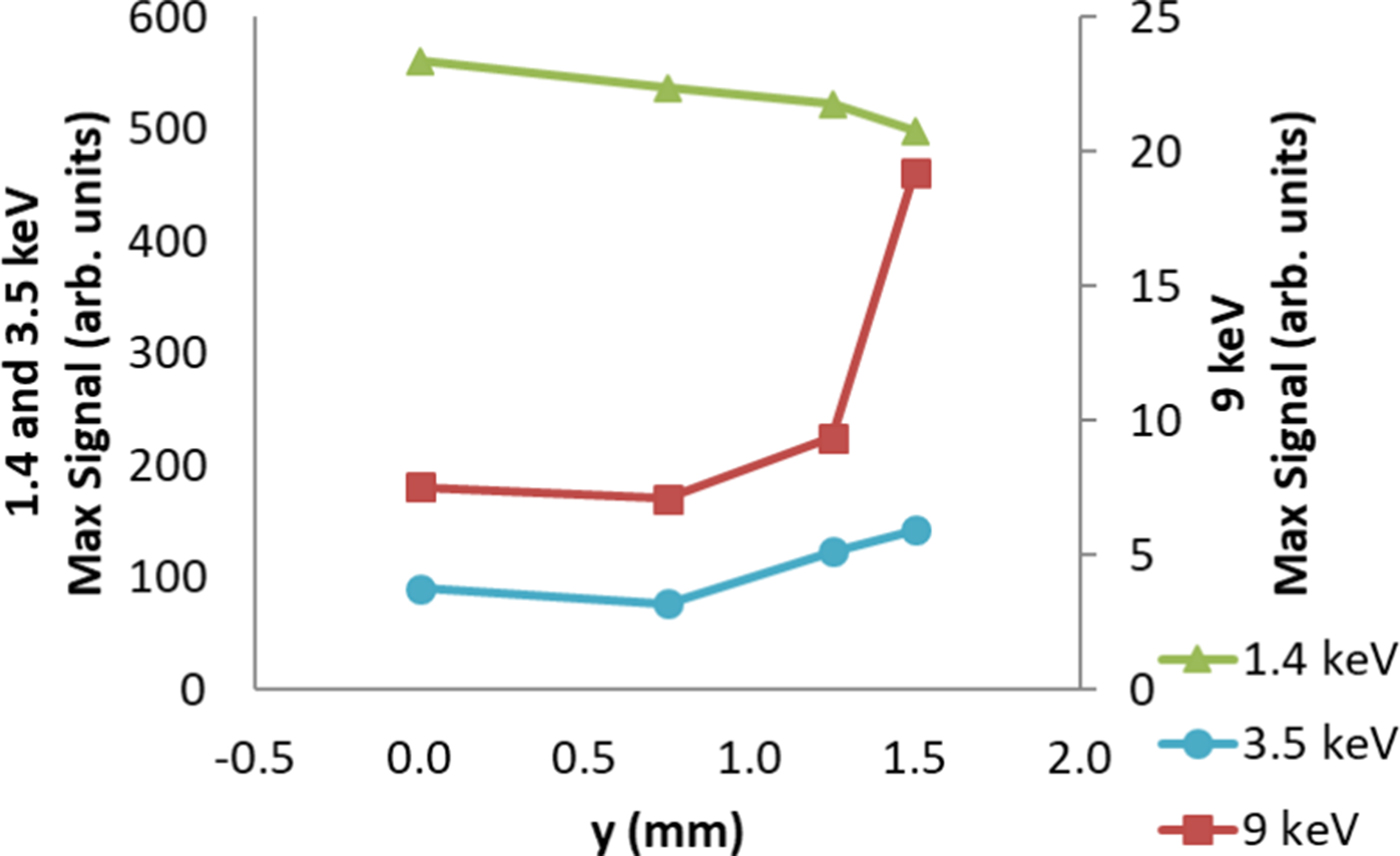
We see a six- to eightfold increase in ε, in the vertical direction, upon moving the focal spot to the front edge of the gas puff with a value for ε of 2.16 × 10⁻³; this comes with no change to the absorption of the gas puff, meaning that another process must contribute to the increase in X-ray efficiency. Titan-irradiated 10-μm-thick Ag and Mo foils served as a comparison for our laser-irradiated gas puffs. Most impressively, the magnified ε at y = 1.5 mm is only 1.5 times smaller for the gas puffs compared to the Ag or Mo foil targets. Additionally, films in both X-ray spectrometers partially blackened during the front-focus shot, indicating the production of X rays with energies in the several tens of keV. In fact, the 1/e cut-off energy of the shielding on the spectrometer's X-ray film was 175 keV. This regime of X-ray generation from clustered Xe gas puffs irradiated by sub-ps laser pulse is termed an “X-ray flash”. Another profound difference occurred in both low and high energy electron emissions. Peak electron current during the Titan campaign hovered around 0.4–0.7 kA for all gas targets. However, laser-irradiated Xe gas puffs at y = 1.125 mm reached a peak current of 1.52 kA, more than doubling the current of previous shots.
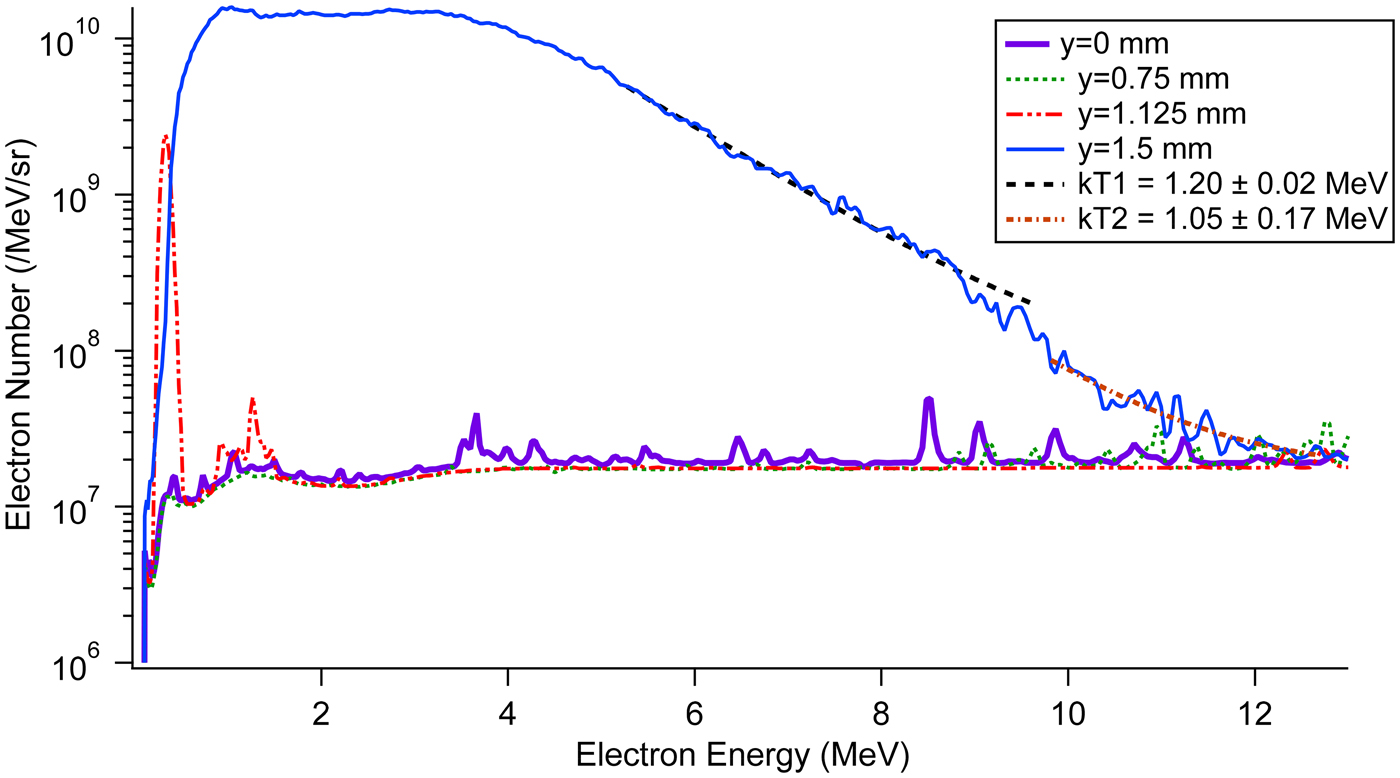
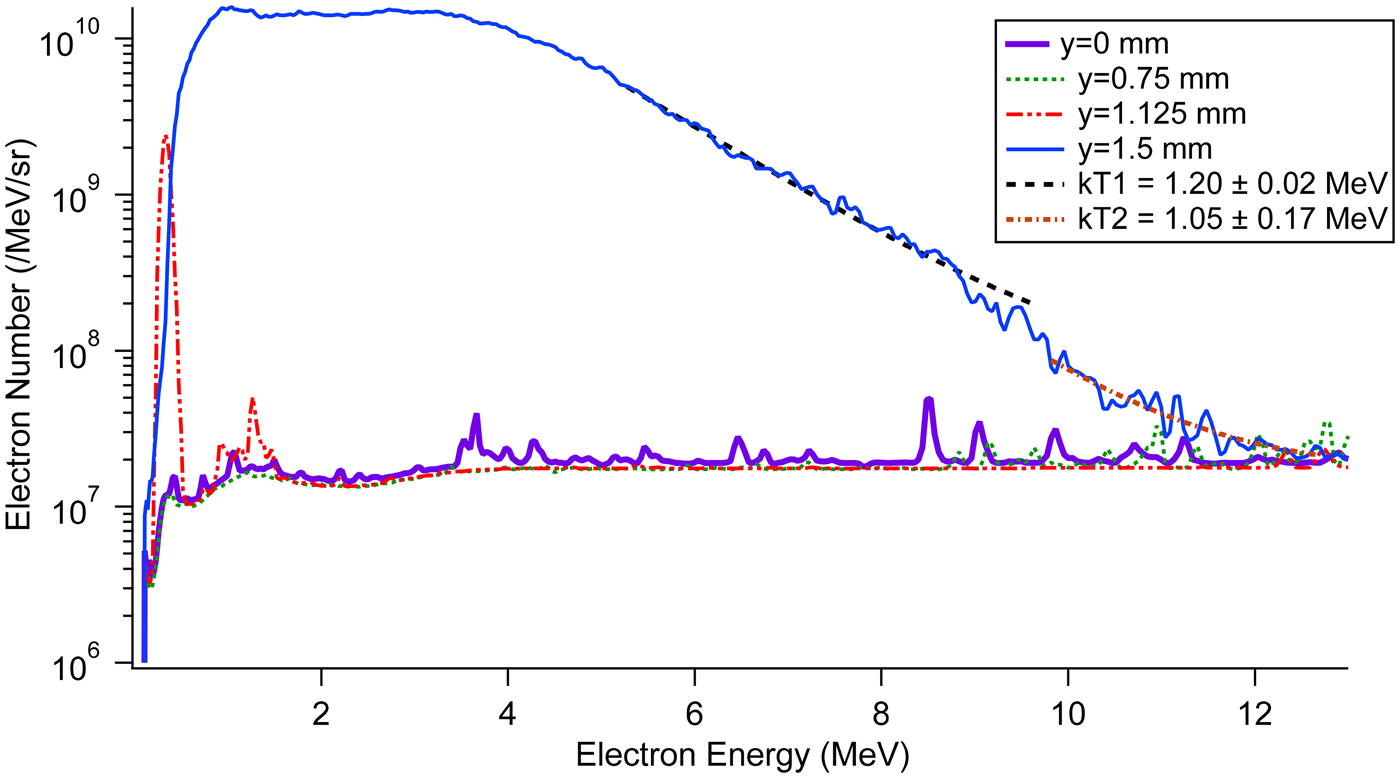
EPPS data for the four focal scan positions, shown in Figure 11, further highlights the regime change. The only y-values with measurable spectra are 1.125 and 1.5 mm. In complete contrast to the narrow energy bandwidth of the other laser-irradiated gas puffs (Fig. 8), a broad, strong spectrum arose for y = 1.5 mm. The FWHM of the electron spectrum at y = 1.5 mm is 4 MeV, an order of magnitude larger than those reported earlier in this work, with the range of the flattop (at ~14 × 109 /MeV/sr) being 0.94–3.30 MeV. The tail of the spectrum shows good agreement with two exponential fits using temperatures of 1.2 and 1.05 MeV.
Xe focal scan electron spectra measured by the EPPS. The y = 0 and 0.75-mm shots demonstrate the lack of measurable spectra for the other Xe gas puffs. The two kT lines are exponential fits of the y = 1.5 mm spectra indicating temperatures of 1.20 and 1.05 MeV.
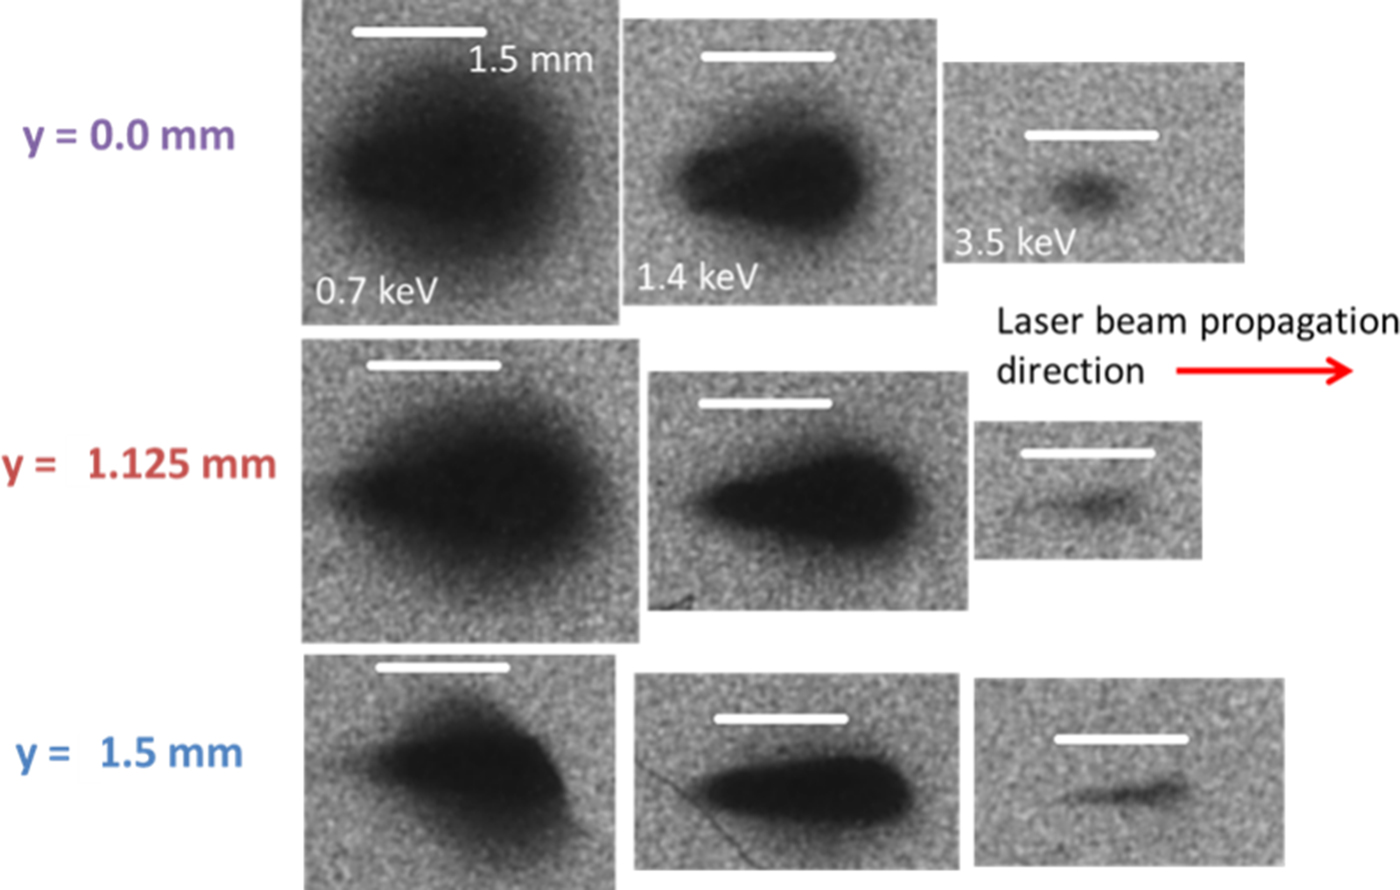
The extreme changes described in the preceding paragraphs are surmised to have resulted from the self-focusing of the laser beam at larger values of y. Figure 12 shows support for this idea found in X-ray pinhole images for several focal spot locations. The three-channel pinhole camera was located at θ = 40° (Fig. 1). The emitting region of the laser plasma exhibits a lack of definition in the lowest energy region (0.7 keV). However, as the filter cut-off energy increases, the X-ray emitting regions decrease in size and have sharper edges. Starting at 1.4 keV, we begin to see evidence of self-focusing in the plasma through the lengthening of the X-ray emitting region along the laser propagation direction; this lengthening is countered by apparent defocusing of the laser. On the downstream side of the images (right side) in Figure 12, the width (on the film) of the emitting region is larger, suggesting defocusing of the laser beam in the plasma.
Xe focal scan pinhole images in the 0.7, 1.4, and 3.5 keV spectral regions (left to right). The gas puff propagates out of the page and the white bar in each image represents 1.5 mm.
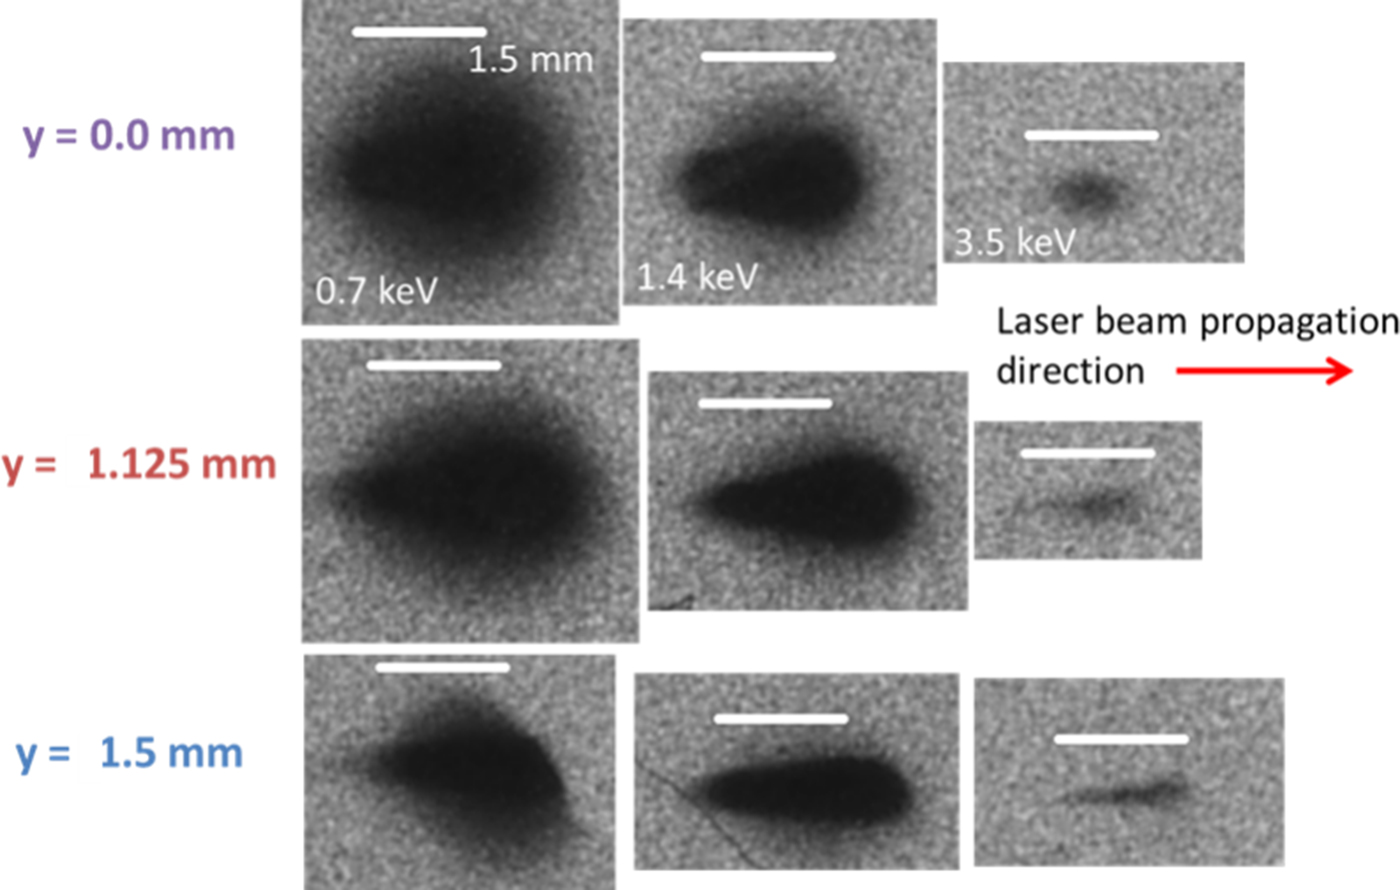
The clearest picture in support of some self-focusing is given at 3.5 keV. The width of the X-ray emitting region has decreased compared to y = 0 mm and the length has increased, which is consistent with self-focusing effects. Table 2 summarizes the FWHM of the length of the emitting region during the focal scan experiments; the angular position of the pinhole camera was taken into account in the lengths of the emitting region. A fivefold increase, compared to y = 0 mm, occurs at y = 1.125 mm and y = 1.5 mm saw a four-fold increase. The Rayleigh length of the frequency-doubled Titan laser when focused to a spot size of ~10 µm is 150 µm. Therefore, we do see evidence of self-focusing at y > 1.125 mm where the X-ray emitting region at least doubles the confocal distance (2z R). The hypothesis of laser beam self-focusing in the gas-puff plasmas is consistent with the generation of hard X rays and accelerated MeV electrons (Alexeev et al., Reference Alexeev, Antonsen, Kim and Milchberg2003; Caillaud et al., Reference Caillaud, Blasco, Bontá, Dorchies and Mora2006; Kim et al., Reference Kim, Milchberg, Faenov, Magunov, Pikuz and Skobelev2006; Chou et al., Reference Chou, Lin, Lin, Lin, Wang and Chen2007). Density gradients on the edges of the gas puff provide the index of refraction variations necessary for relativistic and ponderomotive self-focusing of the laser beam.
Full length at half maximum along the laser beam propagation direction of the X-ray emitting regions at 3.5 keV from Figure 12 for different focal spot locations

Conclusion
In conclusion, pure and mixed supersonic gas puffs were investigated as a controllable X-ray source using the 2ω LLNL Titan laser and were compared to previous experiments with the 1ω UNR Leopard Laser. Gas-puff characterization experiments determined the average density for the tested gases as a function of gas delay timing, an independent experimental variable. Five gases were tested: Ar, Kr, Xe, a mixture of Kr and Ar, and a triple mixture of Ar, Kr, and Xe. The pure Xe gas puffs produced the strongest radiation in each of the observed spectral regions (>1.4, >3.5, and > 9 keV) for the gas-puff targets. Laser beam absorption and gas-puff material both contribute to the efficiency of converting laser energy to >2.4 keV X-ray photons. This is a possible way to optimize X-ray yield; for example, the gas delay time of 830 ms produced the maximum ε for most gases used in the experiments.
X-ray emissions were also found to be anisotropic, emitting less radiation in the direction parallel to gas-puff propagation and with a higher degree of anisotropy for more energetic photons. Surprisingly, the anisotropy had only small variations between gas target types and was constant over the duration of the experimental campaign. Laser beam polarization was ruled out as it changed orientation between experimental campaigns at the Leopard (Schultz et al., Reference Schultz, Kantsyrev, Safronova, Moschella, Wiewior, Shlyaptseva and Weller2016; Kantsyrev et al., Reference Kantsyrev, Schultz, Shlyaptseva, Safronova, Shrestha, Petrov, Moschella, Petkov, Stafford, Cooper, Weller, Cline, Wiewior and Chalyy2016c) and Titan (this work) lasers and the anisotropy persisted. Decreased transmission of photons through the cold gas puff above the nozzle was proposed as an explanation. However, the increased transmission of higher-energy X rays conflicts with the larger degree of anisotropy at 3.5 keV compared to 1.4 keV. X-ray spectroscopic measurements at a position closer to the vertical diode position could shed light on the data in future experiments.
X-ray spectroscopic data further illuminated our findings. The new 2ω Titan results indicate a T e approximately 1.5 times higher and an ne almost two orders of magnitude lower than previous results at the 1ω Leopard Laser (Kantsyrev et al., Reference Kantsyrev, Schultz, Shlyaptseva, Safronova, Shrestha, Petrov, Moschella, Petkov, Stafford, Cooper, Weller, Cline, Wiewior and Chalyy2016c). Moreover, unlike the gas-mixture experiments on the 1ω Leopard laser, where Ar spectra showed only the “cold” Kα line, which indicated that the Ar gas clustered inefficiently, the Ar plasmas produced in Titan experiments manifest ionic lines, which are associated with much hotter K-shell Ar plasmas. Similarly, for the KrAr gas puffs, the Ar Kα and Kr Lα “cold” characteristic lines were not detected.
X-ray pinhole camera images also demonstrate that the plasma has expanded significantly after clusters dissociation, evidenced by the smaller emission region at higher X-ray energies. We conclude that observed X-ray spectral lines in region ~3.7–8 Å (3.4–1.5 keV) are generated in the hot central region of the laser plasma.
The relatively less energetic electron beams (from several keV to tens of keV), responsible for excitation of Ar Kα and Kr Lα “cold” characteristic lines, were not generated or were weak in the Titan-produced plasmas. At the same time, relatively strong, highly energetic non-Maxwellian electron beams with energy from several hundred keV to 1 MeV were observed with the EPPS. These high-energy non-Maxwellian electron beams were responsible for the observed bremsstrahlung radiation (>several hundred keV).
The laser-produced gas-puff plasmas generated high-energy electrons (>1 MeV) and low-energy electron beams (>72 keV). Electron beam current increased more than expected when generated at a laser wavelength of 527 nm and intensity of 7 × 10¹⁹ W/cm2 (Titan laser) compared to previous results with a 1057-nm, 1019 W/cm2-intensity laser pulse (Leopard laser). Gas-puff density also had a strong effect on electron beam current for the pure gas puffs. High-energy electrons were observed reliably on an electron spectrometer for gas puffs containing Ar, but not Xe, with peak energies up to 0.7 MeV.
Interestingly, scanning the focal-spot position towards the front edge of a linear Xe gas puff produced a strong X-ray-flash effect in harder spectral regions and generated a multi-MeV electron beam, coincident with the observation of self-focusing of the laser beam within the plasma. Evidence of X-ray emission with energy >150 keV was observed and electrons with energies >6 MeV were also produced in the Xe gas-puff plasma. More importantly, the maximum X-ray yield from the Xe gas puff, a debris-free source of radiation, is only 1.5 times smaller than that from Mo or Ag solid-foil targets.
Much remains to be understood about the dynamics of the plasma directly after cluster dissociation. MD modeling can estimate charge states of the plasma, but the actual expansion of the clusters and subsequent plasma is beyond the scope of this work. Future work would include a deeper study into the electron beam–plasma interactions and heating.
Acknowledgements
The authors would like to thank J. Moschella of UNR for his contributions to previous work as well as H. Chen of LLNL for the use of the EPPS. Additional thanks are given to the entire staff at the Jupiter Laser Facility at Lawrence Livermore National Laboratory. This work was supported by the Defense Threat Reduction Agency, Basic Research Award # HDTRA1-13-1-0033, to University of Nevada, Reno, and in part by NNSA under DOE grant DE-NA0003877. Work at LLNL was performed under the auspices of the U.S. DOE by LLNL under contract DE-AC52-07NA27344. G. Petrov was supported by the Air Force Office of Scientific Research under award number FA9550-14-1-0282.