Introduction
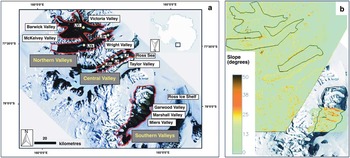
The McMurdo Dry Valleys (MDV) span an ice-free region between the Transantarctic Mountains and the Ross Sea that consists of soils, glaciers, streams and lakes all underlain by permafrost (Kennedy Reference Kennedy1993, Lyons et al. Reference Lyons, Fountain, Doran, Priscu, Neumann and Welch2000, Levy et al. Reference Levy, Fountain, Gooseff, Welch and Lyons2011) (Fig. 1a). The south and central MDV have a total area of 16 400 km2, of which 3800 km2 is ice-free (Levy Reference Levy2013). The MDV is a polar desert with a mean annual temperature of c. -18°C and 3–50 mm of annual precipitation, most of which falls as snow and then sublimates (Doran et al. Reference Doran, McKay, Clow, Dana, Fountain, Nylen and Lyons2002, Fountain et al. Reference Fountain, Nylen, Monaghan, Basagic and Bromwich2010, Hunt et al. Reference Hunt, Fountain, Doran and Basagic2010). However, in the summer, streams convey glacial meltwater to closed-basin lakes on the valley floors. Hydrological processes influence transport of water, energy and matter in the MDV.
Landsat LIMA image of the McMurdo Dry Valleys (MDV), Antarctica. The red polygons indicate the study regions where the analysis took place. Barwick, Victoria and McKelvey valleys represent the northern valleys. Taylor Valley represents the central valley. Garwood, Marshall and Miers valleys represent the southern valleys. The white dots indicate meteorological stations in the MDV. The locations of Lake Vida (LVi), Lake Vanda (LVa), Lake Brownworth (LBr), Lake Bonney (LB), Lake Hoare (LH) and Lake Fryxell (LF) are also shown. b. A slope distribution map in degrees derived from a Digital Elevation Model (DEM). The DEM has full coverage in the northern valleys and central valley, but only partial coverage in the southern valleys.

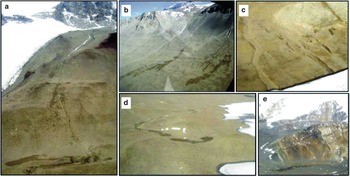
Recent observations of seeps (Lyons et al. Reference Lyons, Welch, Carey, Doran, Wall, Virginia, Fountain, Csatho and Tremper2005, Harris et al. Reference Harris, Carey, Lyons, Welch and Fountain2007), water tracks (Head et al. Reference Head, Marchant, Dickson, Levy and Morgan2007, Levy et al. Reference Levy, Head and Marchant2008, Reference Levy, Fountain, Gooseff, Welch and Lyons2011) and wet patches (Levy et al. Reference Levy, Fountain, Welch and Lyons2012) in the MDV have motivated new interest in examining these features that distribute water through the valleys (Fig. 2). Seeps are typically sourced from up-gradient snow/ice melt and discharge at points where boulders produce a local break in slope, resulting from upslope damming of colluvium (Levy et al. Reference Levy, Fountain, Gooseff, Welch and Lyons2011). Water tracks are zones of high soil moisture that route snow melt downslope over the ice table in polar environments in the absence of well-defined channels (Hastings et al. Reference Hastings, Luchessa, Oechel and Tenhunen1989, McNamara et al. Reference McNamara, Kane and Hinzman1999, Levy et al. Reference Levy, Fountain, Gooseff, Welch and Lyons2011). Wet patches are partly to fully saturated soils surrounded by dry soil, suggesting a lack of hydrological connectivity with surface/near-surface waters and are most probably supplied by deliquescence (a process by which a substance absorbs moisture from the atmosphere) of soil salts and fluid growth by vapour deposition (Levy et al. Reference Levy, Fountain, Welch and Lyons2012).
Wetted soils in Taylor and Victoria valleys: a. south-facing slope near LaCroix Glacier, b. water tracks on the south-facing slopes above east lobe of Lake Bonney, c. north-facing slopes above west lobe of Lake Bonney, d. wet patch on the valley bottom location south of Lake Hoare, and e. wetted soils at base of outcrop, north-facing slope near Lake Vanda.

Seeps and water tracks appear to be supplied by melting of snow patches or ground ice that has accumulated in the subsurface or buried glacier ice (Harris et al. Reference Harris, Carey, Lyons, Welch and Fountain2007, Head et al. Reference Head, Marchant, Dickson, Levy and Morgan2007, Levy et al. Reference Levy, Head and Marchant2008). Seeps and water tracks may wick saline water (2–4 dS m-1) into the MDV soil ecosystems, providing solute transport that is up to two orders of magnitude faster than in adjacent dry or damp soil (Levy et al. Reference Levy, Fountain, Gooseff, Welch and Lyons2011). The MDV seeps, water tracks and wet patches represent a newly appreciated feature in the morphological continuum between surface flow in streams and shallow active layer flow, and a source of moisture and solutes to soil ecosystems (Levy et al. Reference Levy, Fountain, Gooseff, Welch and Lyons2011). Wetted soil features can be observed in aerial photographs extending back to 1959, and even in Griffith Taylor’s photographs of the MDV from 1910, suggesting that the wetted soils are not a new feature of the MDV, despite the recent research focus on them (Levy et al. Reference Levy, Fountain, Gooseff, Welch and Lyons2011).
There are differences in the spatial and temporal coverage in wetted soil area across the MDV landscape, which probably depend upon the amount of source water availability occurring across each valley, and surface energy balance to cause melt (rather than sublimation). Stream flow runoff generation from glaciers in the MDV is strongly affected by valley position (i.e. solar radiation, winds, air temperature and snowfall) and by surface roughness that alters turbulent heat exchange with the atmosphere (Gooseff et al. Reference Gooseff, McKnight, Doran, Fountain and Lyons2011).
In the MDV, the permafrost landforms provide a structure to the nematode-dominated ecosystem by controlling the distribution of liquid water, salts and heat in the soil (Virginia & Wall Reference Virginia and Wall1999, Barrett et al. Reference Barrett, Virginia, Wall, Parsons, Powers and Burkins2004, Nkem et al. Reference Nkem, Virginia, Barrett, Wall and Li2006, Poage et al. Reference Poage, Barrett, Virginia and Wall2008, Levy et al. Reference Levy, Fountain, Gooseff, Welch and Lyons2011). Field analyses suggest that the wetted soils are a major source of water to MDV soil ecosystems across the landscape (Levy et al. Reference Levy, Fountain, Gooseff, Welch and Lyons2011). However, the salinities of wetted soils (2–4 dS m-1) greatly exceed the limits for nematode habitat suitability observed in the field and act as barriers to nematode colonization (Courtright et al. Reference Courtright, Wall and Virginia2001, Poage et al. Reference Poage, Barrett, Virginia and Wall2008, Levy et al. Reference Levy, Fountain, Gooseff, Welch and Lyons2011). Quantifying the amount of soil moisture from the wetted soils is necessary for understanding habitat suitability across the MDV landscape.
The objective of this study was to quantify the spatial and temporal distribution of water tracks, seeps and wet patches (‘wetted soils’) within the MDV through the use of high resolution satellite imagery collected over the MDV from 2009–10 to 2011–12 summers. The spatial and temporal variation of wetted soils at the landscape scale was quantified, and the controls of topography and microclimates for which satellite imagery is available were assessed. We propose that the wetted soils deliver a significant amount of water to MDV soils and ecosystems, far beyond the edges of lakes and streams.
Methodology
Image acquisition and study area
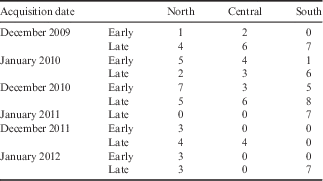
Over 3500 high resolution satellite images, spanning summers (October to March) from 2004–12, were provided to us by the Polar Geospatial Center (PGC). These images came from four primary DigitalGlobe and GeoEye products: QuickBird, WorldView-1, WorldView-2 and GeoEye-1 spanning different resolutions and image swaths (Table I). Beginning in 2009, revisit frequencies were 1–2 times per week in the MDV and overlap swaths with other satellites. Some of the satellite images could not be used due to heavy shadowing that occurred frequently when the sun was at low angles (i.e. late at night or during the early and later months of the summer). Satellite images meeting a criterion of <80% cloud cover were used and also visually verified using a low resolution version of the imagery prior to analysis. December and January were the months of interest because of the high activity of melt and high temperatures. Only the panchromatic satellite images were processed because of the higher resolution (45–65 cm) compared to the multispectral imagery (1.8–2.62 m). In the end, 106 satellite images were analysed, spanning summers from 2009–12 (Table II).
Satellite sensor features for QuickBird, WorldView-1, WorldView-2 and GeoEye-1. Only the panchromatic band was used for this study and the multispectral sensor information is not listed.

Satellite image acquisition dates for each study region.
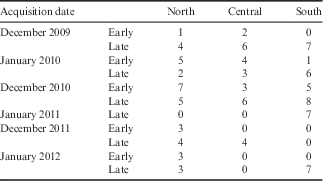
‘Early’ indicates imagery acquired in the first 15 days of the month, ‘late’ indicates imagery acquired later in the month.
Taylor Valley has been the focus of the MDV Long-Term Ecological Research (MCM-LTER) project since 1993, with lesser emphasis on Victoria, Wright, Garwood and Miers valleys. These five valleys plus Barwick, McKelvey and Marshall valleys provided the scope for quantification of the spatial and temporal patterns of wetted soils. Temporal and spatial coverage of these regions by high resolution satellite imagery was variable; hence a single ‘snap-shot’ of any of the landscape required several images, acquired over a few days, to be ‘stitched’ together for analysis. The MDV landscape was divided into three regions based upon the available satellite images to completely cover each valley (Fig. 1a). The three regions include: i) northern valleys: Barwick, McKelvey, Victoria and Wright valleys, ii) central valley: Taylor Valley, and iii) southern valleys: Garwood, Marshall and Miers valleys.
Image processing
Georeferencing and orthorectification of images was completed in different ways depending on satellite platform. QuickBird imagery was obtained as standard product (level 1B) that was already processed with regard to radiometric, geometric and sensor corrections. The level 1B georeferenced images were corrected for systematic distortions due to the sensor, platform and earth rotation but were not orthorectified. Environment for Visualizing Images (ENVI) orthorectification tools were used to rectify data from specific sensors using a Rational Polynomial Coefficient (RPC) model. The only input into the RPC model is a Digital Elevation Model (DEM). The 30 m DEM made from a United States Geologic Survey (USGS) topographical map of the MDV (http://mcmleter.org) was used for the RPC model.
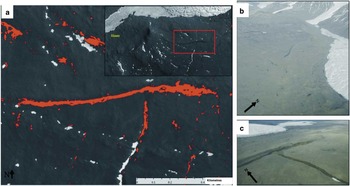
After orthorectification, analyses of the satellite images were confined to areas of only wetted soils by discarding other features in the satellite images (i.e. streams, glaciers, snow, etc. were masked out). This was accomplished by comparing ground and aerial photographs of wetted soils (Fig. 3a & b) and previous studies (Levy et al. Reference Levy, Fountain, Gooseff, Welch and Lyons2011, Reference Levy, Fountain, Welch and Lyons2012). The image classification of wetted soils was performed under the assumption that wetted soils do not occur outside the masks. Ground-truthing was performed in one year (2011–12) in Taylor and Wright valleys. Pictures from helicopters documented several features, and the wetted soils can be clearly resolved in the ground and aerial images (examples shown in Fig. 3b & c). In addition, current imagery for part of this region in Google Earth (available from January 2010) also clearly shows the dark, wetted soils across the landscape.
ENVI feature extraction method applied to a panchromatic WorldView-2 image of wetted soils near Lake Hoare in Taylor Valley. The red features indicate the wetted soils that are produced by ENVI feature extraction and are exported as a vector file. b. Aerial view taken from a helicopter over the same location; the wetted soil can be clearly resolved in the middle of the digital image. c. Ground view of the same wetted soil in a. and b.

Topographical analysis
To evaluate the topographical controls or relationships on the wetted soils, the elevation, slope and aspect were evaluated using DEMs for each of the study regions. Two sets of DEMs are available: a 30 m DEM for most of the MDV landscape, and a 2 m light detection and ranging (LiDAR) DEM, which provided partial coverage of the southern valleys (Fig. 1b). The elevation, slope and aspect were obtained for each cell in each DEM. The DEMs were converted to vector files by setting a threshold for elevation, slope and aspect.
The elevation data were split up into 50 m sections ranging from 0–1500 m. Slope for each cell in the DEM was estimated in ArcGIS spatial analyst, which identifies the maximum change in z-value from each cell of the DEM and is output into a range of slope values from 0–90°. The slope data were split into 5° sections ranging from 0–50° for all valleys. Aspect was also evaluated using the ArcGIS spatial analyst tool by identifying the downslope direction of the maximum rate of change in value from each cell to its neighbours, and is expressed in positive degrees from 0–359.9 (clockwise to north). These are expressed as eight cardinal directions (north, south, east, west and their intermediates).
Image classification
An object-based classification (i.e. assigning classes to image objects which are the result of segmentation of an image into discrete non-overlapping units based on specific criteria; Mitra et al. Reference Mitra, Shankar and Pal2004, Gibbes et al. Reference Gibbes, Adhikari, Rostant, Southworth and Qui2010) was found to be most appropriate to extract the patterns of wetted soil distribution in the valleys. An extension to ENVI called feature extraction is used to perform the object-based classification. Feature extraction is the combined process of segmenting an image into regions of pixels, computing attributes for each region to create objects, and classifying the objects based on those attributes to extract features. There are three general types of surfaces within the subset satellite images: snow, dry soils and wet soils.
The work flow for the feature extraction consists of two primary steps: find objects and extract features. The find objects task is divided into four steps: i) segment, ii) merge, iii) refine, and iv) compute attributes. The segmentation size was adjusted to be able to represent the minimum-sized wetted soil feature from satellite imagery (c. 10 m2). Merging involves grouping small and contiguous segments within the minimum-sized wetted soil into larger objects. Each satellite image had a different scale and merge value based upon the wetted soils within the image, which was based on testing parameters interactively.
After the objects are found by scale and merge, extraction is performed using a rule-based classification and by exporting the results to vector files. The spectral classification was chosen because it best captures the wetted soils when setting the threshold of brightness and colour. After an appropriate threshold was set, the features were exported into a vector format (Fig. 3a). Features created under 10 m2 were considered classification noise and removed from the analysis. An accuracy assessment of the classification results will be needed in future studies by performing ground-truthing. Visual inspection of the results indicates that the feature extraction accurately delineates both small (<30 m2) and large (>100 m2) wetted soil patches.
Possible sources of moisture for wet soils
When using satellite imagery, surface snow and ice are the easiest potential source of soil moisture to assess. If snow patches or surface ice were observed early in the summer (October–November) within a topographical contributing area upslope of an observed wetted soil patch observed later in the summer (December–January) it would be expected that the snow or ice could be a contributor of moisture to the wetted soil patch. The ArcGIS 10 hydrology toolset was used to determine upslope contributing areas and flow directions across the valleys in order to find possible sources of the wetted soils. Satellite images acquired in October or November were analysed to extract snow and ice cover (at the surface) from the feature extraction method. Due to the limited number of satellite images in early summer (October–November), this source analysis was only performed for the 2010–11 summer.
A flow-direction raster was computed from the DEMs using the ArcToolbox flow-direction function, which creates a raster of flow direction from each cell to its steepest downslope neighbour. To determine the contributing area above each wetted soil polygon, only a flow-direction raster and a point to specify where to start the analysis are needed. Within each wetted soil polygon, the highest elevation point was chosen to compute flow directions from upslope areas. The ArcToolbox watershed function was then used to calculate the contributing area above a set of cells of the wetted soils. The point distance tool in ArcGIS was used to determine the distance between wetted soils and melting sources (snow and ice) within the contributing area.
For the central valley region, 992 points were chosen for analysis from the wetted soil polygons identified in late December 2010. The contributing area polygons for each wetted soil polygon had an average size of 576 m2 (maximum 6.98 km2). Five images were chosen from 23–25 October 2010 from which to extract the coverage of snow and ice. The snow and ice polygons in the central valley region ranged in area from 28 m2 to 1.41 km2 (mean area 1400 m2).
For the northern valleys, 1362 points were selected from wetted soil polygons identified in December 2010. However, only 1110 contributing area polygons were produced because some wetted soils had no upslope contributing area. The non-zero upslope areas contributing to wetted soil patches ranged from 8 m2 to 5.78 km2. Sixteen images acquired in October 2010 were chosen from which to extract the snow and ice coverage. The snow and ice polygons that coincided with wetted soil patch contributing areas in the northern valleys ranged in area from 11 m2 to 0.42 km2 (mean area 560 m2).
For the southern valleys, 734 points were selected from wetted soil polygons identified in December 2010. From these, 530 contributing area polygons were produced, ranging from 16 m2 to 2.75 km2. Three images acquired in October 2010 were chosen from which to extract the snow and ice coverage. The snow and ice polygons coinciding with wetted soil patch contributing areas ranged in size from 13 m2 to 0.26 km2.
Finally, the potential controls of meteorology on wetted soil patch occurrence and coverage were analysed. Daily mean air temperature, wind speed and solar radiation data were analysed for each summer in 2009 and 2010 (October–February), and for the beginning of summer in 2011 (data available from the MCM-LTER online database). Data were taken from six meteorological stations across these regions: Lake Bonney, Lake Hoare, Lake Fryxell, Lake Vanda, Lake Vida and Lake Brownworth stations (Fig. 1a). No meteorological stations are located in the southern valleys.
Results
Northern valleys region
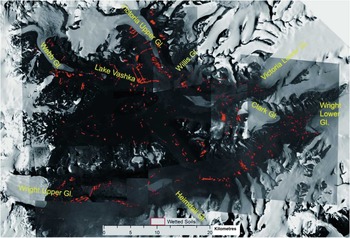
The northern valleys region has an area of 1000 km2 and is the largest of the three study regions. Wright and Victoria valleys have the most occurrences and largest cumulative area of wetted soils (Fig. 4). Little snow accumulates in Barwick and McKelvey valleys that can be observed through the satellite imagery. Most of the wetted soil patches in Wright Valley occur between Heimdall and Wright Lower glaciers, with a greater area of wetted soil towards lower Wright Valley. In the Victoria region, most of the wetted soil patches occur between Willis and Victoria Lower glaciers, increasing towards Victoria Lower Glacier, similar to Wright Valley. Most of the wetted soils in the Barwick region occur in Barwick Valley, near Webb Glacier and Lake Vashka.
Northern valleys wetted soil locations for 7–25 December 2010. Red polygons indicate wetted soils and are not to scale.

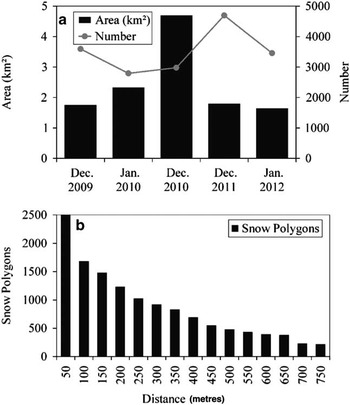
The largest cumulative area of wetted soils across the northern valleys region was found in December 2010 with 4.69 km2, and the smallest in January 2012 with 1.64 km2 (Fig. 5a). The number of wetted soil patches for December 2010 was 2979, which was the second lowest following January 2010. The highest number of wetted soil patches (4698) was observed in December 2011, but the wetted soil area was only 1.80 km2. Northern valleys satellite imagery analysis saw an overall increase of wetted soil area between 2009–10 and 2010–11, but a decrease between 2010–11 and 2011–12 (Fig. 5a).
Northern valleys area and number of the total amount of wetted soil polygons for that period, and b. distribution of distance of the number of snow/ice polygons from wet soil patches.

The variability in wetted soil area can partly be explained by the meteorological analysis. Meteorological data were not available from the MCM-LTER sites in the northern valleys for December 2010 and January 2012 (contributing the most and least extensive areas of wetted soil, respectively), but were available in the central valley region. The mean air temperature, net radiation and wind speed for Lake Hoare station for December 2010 ranged from -7.8–6.0°C (10 days above 0°C), 177.8–430.1 W m-2 (mean 339.2 W m-2), and 1.1–10.0 m s-1 (mean 3.2 m s-1), respectively.
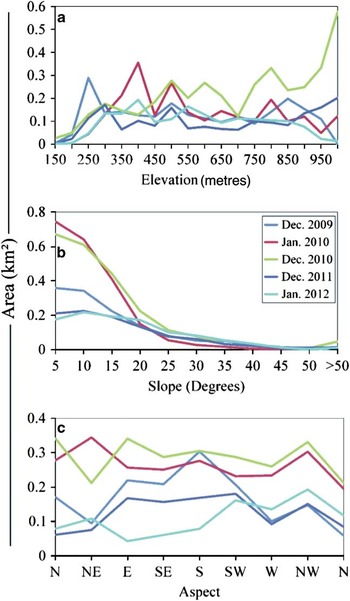
Cumulative area of wetted soils of at least 0.30 km2 occurred at both low and high elevations ranging from 400–1000 m (Fig. 6a). However, most of the wetted soils occurred at low elevations (200–500 m) throughout the study period (Fig. 6a). This suggests that, in the northern valleys region, most wetted soils occur near the valley floor, particularly near Lake Vashka and Wright Lower Glacier (Fig. 4). The wetted soils occurring at high elevations (550–1000 m) were routing water downslope, particularly near Victoria Upper Glacier and Webb Glacier (Fig. 4).
Northern valleys Digital Elevation Model analyses of wetted soil area with respect to a. elevation, b. slope, and c. aspect at times when satellite imagery coverage was available to evaluate the entire region.

Each year shows similar distributions of wetted soils with respect to slope; occurring most frequently on relatively flat slopes of 5 or 10°, gradually decreasing on slopes of 10–20°, and rarely on slopes of 20–50° (Fig. 6b). The relatively flat slopes of 5–10° typically occur at the valley floors (Fig. 1b). A clear relationship between wetted soils and aspect was not established (Fig. 6c).
More than half of the number of snow polygons occurred at a distance of 0–250 m from water tracks (Fig. 5b). Most of the snow accumulation occurs near the coast of Wright and Victoria valleys. The short distances (0–50 m) between snow patches and wet soils in upper Wright Valley indicate that snow melt on the valley floor is probably a significant contributor to the wetted soils in this region. In lower Wright Valley, based on the distribution of snow and wet spots, the moisture in the soil may come from snow at higher elevations running down the valley walls (e.g. Fig. 2e). This potential may not be represented by the contributing area analysis, perhaps because the 30-m DEM is too gross to capture the finer-scale topology in this region. In Barwick and McKelvey valleys, very little snow is present in the contributing area polygons for wet spots and the majority of the snow accumulations are near Webb Glacier and Lake Vashka.
Central valley region
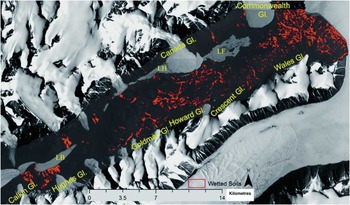
The central valley region has an area of 279 km2 and is the smallest of the study regions. Wetted soils are most frequent near Lake Hoare and Lake Fryxell, and less frequent near Lake Bonney (Fig. 7). The majority of wetted soils that occur near Lake Hoare are found between Goldman and Howard glaciers (Fig. 7). The majority located near Lake Fryxell occur between Commonwealth and Wales glaciers towards McMurdo Sound (Fig. 7). Most of the wetted soils near Lake Bonney are probably associated with surface ice debris collections occurring beneath higher elevation ice between Calkin and Hughes glaciers because little snow accumulates in this region.
Central valley wetted soil spatial locations for December 2010. Red polygons indicate wetted soils and are not to scale. LB=Lake Bonney, LF=Lake Fryxell, LH=Lake Hoare.

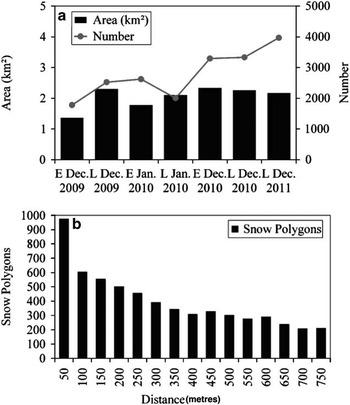
The greatest cumulative area of wetted soil occurred in early December 2010, with a total area of 2.34 km2 (Fig. 8a). The number of wetted soil patches observed during early December 2010 was 3290. In late December 2011 there were more occurrences of wetted soils with 3964, and the total area was 2.17 km2. The smallest cumulative area of wetted soil occurred during early December 2009, having a total area of 1.36 km2. The number of wetted soils during early December 2009 was 1779 and was the lowest amount relative to the other years in central valley. The number and total area of wetted soils increased between 2009–10 and the beginning of the 2011 summer (Fig. 8a).
Central valley area and number of the total amount of wetted soil polygons for that period, and b. distribution of distance of the number of snow/ice polygons from wet soil patches.

The temporal variability of wetted soil area can partly be explained by the meteorological data recorded at Lake Bonney station. During December 2010 (associated with the greatest cumulative area of wetted soil), mean air temperature, net radiation and wind speed ranged from -6.9–3.2°C (19 days above 0°C), 182.9–363.0 W m-2 (mean 316.3 W m-2) and 3.8–10.9 m s-1 (mean 4.9 m s-1), respectively. During December 2009 (associated with the smallest cumulative area of wetted soil), mean air temperature, net radiation and wind speed ranged from -5.2–2.6°C (11 days above 0°C), 157.6–379.6 W m-2 (mean 286.8 W m-2) and 2.5–6.1 m s-1 (mean 4.5 m s-1), respectively.
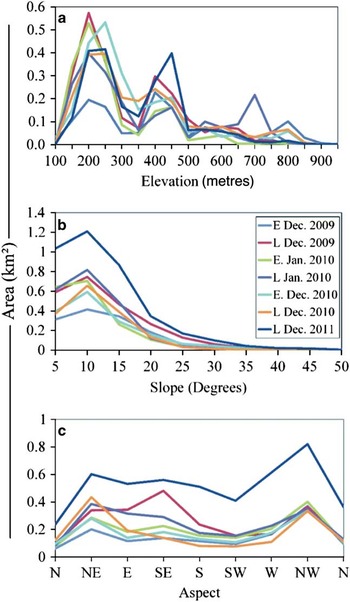
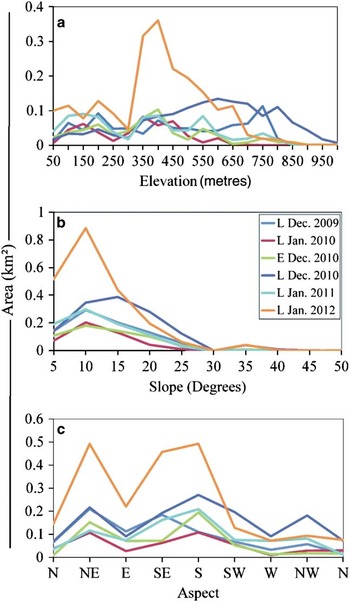
The total wetted soil area in the central valley region has a bimodal distribution with respect to elevation. The first peak, generally ≥0.30 km2, occurs at elevations ranging from 200–250 m (Fig. 9a). These elevations are near the valley floor, particularly near Lake Fryxell and Lake Hoare, indicating that most wet spots occur near or on the valley floor. The second peak occurs at elevations ranging from 400–450 m, with areas between 0.1–0.2 km2. Each summer shows a variability of wetted soil area with respect to elevation, with a sharp increase from 100–150 m, decrease from 250–350 m, another increase from 350–450 m, and a decrease from 500–950 m. This implies that the distribution of wetted soil area is relatively similar from year to year.
Central valley region Digital Elevation Model analyses of wetted soil area with respect to a. elevation, b. slope, and c. aspect at times when satellite imagery coverage was available to evaluate the entire region.

Each year also shows similar distributions of cumulative area of wetted soil with respect to slope and aspect (Fig. 9b & c). The distribution of wetted soils with respect to slope gradually increases to a peak at 10° and then decreases from 10–20°, with very little accumulation from 20–50° (Fig. 9b). The gradual slopes of 10° typically occur on the valley floor and at low elevations. The aspects with the greatest areas of wetted soils were north-east and north-west, with a variability of 0.3–0.8 km2 on north-east aspects, and fairly consistent 0.4 km2 on north-west aspects for each year (Fig. 9c). These peaks are largely due to the fact that most of Taylor Valley has a north-east or north-west aspect where slopes are low and snow tends to accumulate providing moisture for nearby soils. The majority of snow polygons occurred at a distance of 0–300 m from the wetted soils (Fig. 8b).
Southern valleys region
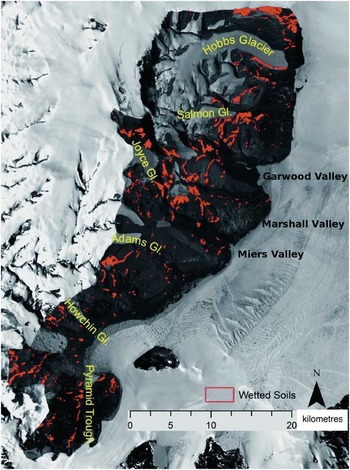
The southern valleys region has an area of 818 km2. The highest contribution of wetted soils in this region is associated with melting of snow and ice fields which are visible from the satellite imagery. Marshall and Garwood valleys have the most occurrences and largest area of wetted soils (Fig. 10). Most of the wetted soils in Garwood and Marshall valleys are from ice field melting occurring at high elevations. South of Miers Valley, the wetted soils are generally located in valley bottom locations between Adams and Howchin glaciers and in the Pyramid Trough.
Southern valleys wetted soil locations for 15–20 January 2012. Red polygons indicate wetted soils and are not to scale. Most of the wetted soils in Garwood and Marshall valleys are from ice field melting occurring at high elevations.

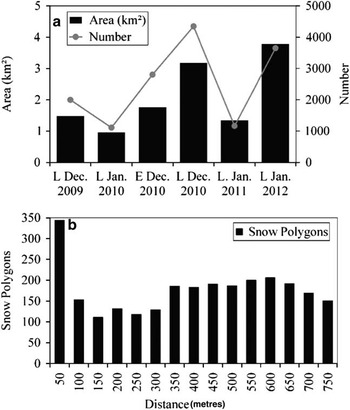
The greatest occurrence of wetted soils was observed during late January 2012 with 3.77 km2 total wetted soil area and the lowest occurrence during late January 2010 with 0.95 km2 (Fig. 11a). The number of wetted soil features for late January 2012 was 3650 which was the second highest, with late December 2010 having the highest number (4358). The southern valleys region had a decrease of wetted soil area between 2009–10 and 2010–11, but an increase between 2010–11 and 2011–12 (Fig. 11a). This interannual variability is certainly a function of the number of satellite observations for each year (four for 2009–2010 compared to one for 2010–11). There are currently no meteorological observation stations in the southern valleys region.
Southern valleys area and number of the total amount of wetted soil polygons for that period, and b. distribution of distance of the number of snow/ice polygons from wet soil patches.

Wetted soils tend to accumulate uniformly with respect to elevation but in high wetted soil summers (2010–11 and January 2012) the cumulative wetted soil area was found at higher elevations 450–850 m (Fig. 12a). The cumulative area of wetted soil peaks between 10 and 15° slope, and decreases as slopes approach 50° (Fig. 12b). The wetted soil area relationship with aspect tends to peak around the north-east and south directions (Fig. 12c). The majority of snow polygons occur at a distance of 0–100 m, suggesting local contributions of snow melt dominate contributions to wet soil patches (Fig. 11b). Most of the snow accumulation from the contributing areas to wet soil patches occurs at high elevations (900 m) which occur between valleys.
Southern valleys Digital Elevation Model analyses of wetted soil area with respect to a. elevation, b. slope, and c. aspect at times when satellite imagery coverage was available to evaluate the entire region.

Discussion
Wetted soils across each valley move liquid water through the active layer during summer months over distances of a few metres to, potentially, kilometres. Wetted soil dynamics in the MDV are influenced by processes that occur at a range of spatial scales. Regional topography controls the occurrence of wetted soils with respect to elevation, slope and aspect by influencing the energy fluxes into the soil. Comparing the 2009–10 to 2011–12 summers, it seems the wetted soils generally occur in the same location for each year and are controlled by the topography and source (snow patches collecting in the same locations). The variations in size of individual wetted soil patches can occur at a smaller scale due to micrometeorological conditions when comparing each summer. Most of the wetted soils occur at low elevations where air temperature and wind speed are greatest (Doran et al. Reference Doran, McKay, Clow, Dana, Fountain, Nylen and Lyons2002). The wetted soils that do occur at high elevations are mostly due to surface ice melt.
In Taylor and Wright valleys, there are more wet soil occurrences near the coast than further inland. This is probably because of a greater occurrence of snow accumulation in these regions (Eveland et al. Reference Eveland, Gooseff, Lampkin, Barrett and Takacs-Vesbach2013). If the wetted soils are driven by snow melt then this explains the low area accumulation of wetted soils near Lake Bonney (0.19–0.61 km2), with snow rarely lasting more than a few weeks (Gooseff et al. Reference Gooseff, McKnight, Doran, Fountain and Lyons2011, Eveland et al. Reference Eveland, Gooseff, Lampkin, Barrett and Takacs-Vesbach2013). Snow-covered area in the eastern central valley region near the coast represents as much as 25% of the landscape and could explain the high concentrations of wetted soils in this region (Eveland et al. Reference Eveland, Gooseff, Lampkin, Barrett and Takacs-Vesbach2013). The meteorological gradients in both these valleys are such that temperature and wind speed increase with distance from the coast (Eveland et al. Reference Eveland, Gooseff, Lampkin, Barrett and Takacs-Vesbach2013). The pattern of air temperature favours melting of snow at particular locations, thereby wetting soils in or near specific locations.
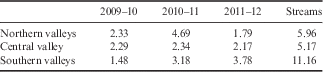
Consistent distribution of the wetted soil polygons between years suggests that they occur at the same locations within each study region. Table III shows the spatial consistency of wetted soil presence by comparing the highest amount of melt for each summer. Projection issues arise when comparing the location of wetted soils because of the small scale (10 m2). This issue plays a bigger role in the larger study regions (northern and southern valleys), but visual inspection shows a high occurrence of spatial consistency in the locations of wetted soil patches.
Spatial consistency of wetted soil area (km2) over multiple summers.

*Analysis of spatial consistency in the southern valleys was performed using December 2010 and January 2012 wetted soil polygons.
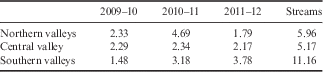
How does the cumulative area of wetted soils compare to that of wetted margins of streams, and to what extent do wetted soil patches affect the total wetted soil area? Stream wetted margins were classified in each region using the same process described above for wetted soils. The satellite images for one particular period that corresponded to the most wetted area for each region were used for the stream margin classification. For example, central valley streams were classified from images collected in December 2010 during the same period of the greatest observed wetted soil area (Fig. 8a). Table IV shows how the stream classification compared to the most wetted area for one month (i.e. early December 2010 for central valley) for 2009–10 to 2011–12. The cumulative wetted soil areas presented are the maximum for each year. The northern valleys cumulative wetted soil area for 2010–11 was 4.69 km2 and was close to the amount of area contributed by streams (5.96 km2). Central valley total wetted soil area for 2010–11 was 2.34 km2, around half of the stream margin area (5.17 km2). The southern valleys total wetted soil area for 2011–12 was 3.78 km2, less than half of the stream wetted margins in that region (11.16 km2).
Greatest cumulative wetted soil area (km2) observed in each summer, and compared to stream margin areas.
The MDV is a mosaic of various surface types and it is sometimes difficult to distinguish the transition from dry to wet soil accurately; therefore, the assumption of the simple surface types (snow, dry soil and wet soil) from the feature extraction method creates uncertainties regarding the exact spatial and temporal coverage of the wetted soils. Furthermore, it is necessary to classify and separate different surface wetness stages from very wet to partially wet. For future studies, it would be valuable to be able to classify the different wetness stages using satellite imagery for accuracy assessment, and field validation should be incorporated for comparison with the satellite image classification of wetted soil area.
Climate models predict significant future warming in polar regions. Polar ecosystems are sensitive to climate change, and small fluctuations in temperature result in substantial changes in local hydrology (Chapin et al. Reference Chapin, Grens, Katsnelson, Gawrlewski, Zielinska and Scheff2008, Simmons et al. Reference Simmons, Wall, Adams, Ayres, Barrett and Virginia2009). Future warming of only 1–2°C (possibly occurring by the end of this century) in the MDV could significantly increase meltwater from surface and ground ice. Consequently, the occurrence of, and flow through, wetted soils would also increase (Shindell & Schmidt Reference Shindell and Schmidt2004, Arblaster & Meehl Reference Arblaster and Meehl2006, Chapman & Walsh Reference Chapman and Walsh2007, Levy et al. Reference Levy, Fountain, Gooseff, Welch and Lyons2011). These increases may drive changes in soil ecosystem function and community composition. For example, increases in air temperature and water availability may have a negative effect on resident nematode populations (Simmons et al. Reference Simmons, Wall, Adams, Ayres, Barrett and Virginia2009).
Conclusions
The remote sensing-based analyses of wetted soil area in the MDV for three summers (2009–10, 2010–11 and 2011–12) have shown the magnitude to vary greatly, and have identified how topography and regional microclimates influence their distribution. The magnitude of accumulated snow and temporal dynamics in weather for each summer controls the amount of melting and moisture supply to the soils. The greatest extent of wetted soil area appears to occur mid- to late December and early January. The 2010–11 summer provided the most wetted soil area and 2009–10 covered the least wetted soil area. The highest total wetted soil area in the northern valleys was 4.69 km2 during December 2010. The highest total wetted soil area in central valley was 2.34 km2 during early December 2010. The highest total wetted soil area in the southern valleys was 3.77 km2 during late January 2012. In the central valley region, the high cumulative wetted soil area for the 2010–11 summer and low cumulative wetted soil area for 2009–10 summer can partly be explained by the mean air temperature recorded at Lake Bonney station in December 2010 (c. 19 days above 0°C) and in January 2010 (c. 7 days above 0°C).
Ideally, four sets of satellite imagery for early and late periods in December and January are needed to fully understand the dynamics of the wetted soils across the summer. Unfortunately, this ideal situation was not available in each of the summers analysed in this study. More high resolution satellite imagery for future years will help fill in critical spatial and temporal gaps in understanding the dynamics of wetted soils to determine whether the study regions are getting wetter. Acquiring low resolution satellite images and aerial photographs prior to 2002 may help bridge the gaps to high resolution satellite sensors. Furthermore, ground-truthing will need to be performed during future field campaigns to assess the accuracy of the feature extraction method, and to develop the ability to classify the different wetness stages.
Snow melt that infiltrates into the soil and melting of ground ice are the primary sources of wetted soils. Hence, wet soil occurrence during the melt year is, in part, a function of the variability of snow accumulation in the winter and conditions favourable for generating melt from surface and subsurface sources. Quantifying the amount of snow in the MDV during earlier periods using remote sensing data, and identifying a correlation to wetted soils, will uncover the sources. Furthermore, quantifying the amount of soil moisture that wetted soils provide will be necessary to understand the effects on microbial communities and biogeochemical cycling.
Acknowledgements
The authors wish to acknowledge the helpful suggestions of two anonymous reviewers. This project is funded through the National Science Foundation’s Office of Polar Programs under grant number ANT-1045215 and the satellite imagery was provided by the PGC. The opinions, findings, and conclusions or recommendations expressed in this material are those of the authors and do not necessarily reflect the views of the National Science Foundation. The submitted manuscript has been authored by a contractor of the US Government under Contract No. DE-AC05-00OR22725. Accordingly, the US Government retains a non-exclusive, royalty-free license to publish or reproduce the published form of this contribution, or allow others to do so, for US Government purposes.
Author contributions
All authors contributed extensively to the work presented in this paper.