I. INTRODUCTION
A detailed knowledge of the structure and energy of surfaces is important for the understanding of many surface phenomena such as adsorption, oxidation, corrosion, catalysis, crystal growth, etc.Reference Zhang, Wang and Xu1–Reference Jiang, Lu and Zhao4 Controlling the shape of metallic nanostructures has been a subject of intensive research in recent years because it provides an effective strategy for tuning the electronic, magnetic, optical, and catalytic properties of a metal.Reference Li, Li, Liao and Wang5–Reference Duan, Jia and Zhao7 Magnetic cobalt nanoparticles have attracted special attention because of their high saturation magnetization and chemical activity. Hence, exhaustive research has been focused on the effect of Co morphologies on its properties.Reference Cao, Zhang, Fan, Hu, Bai, Zhang, Yuan and Chen8–Reference Duan, Jia, Cheng and Zhao11 So far, there are rare reports about the Co sewage treatment ability, and especially the ability is influenced by the crystal structure of Co. In this paper, the magnetic properties and Congo red (CR) removal ability of Co crystals with different crystal structures are carefully investigated.
The pollution of water resources by the dyes from the textiles industries has become a serious environmental problem attracting much more attention.Reference Nguyen, Phan, Do and Ngo12 Adsorption and chemical catalytic oxidation have been the promising methods for removing hazards such as azo dyes.Reference Wu and Qu13 Compared with conventional materials, magnetic materials used as an adsorbent in sewage treatment have the advantages of high accuracy and simplicity removal from the water. Therefore, in recent years, more and more research has occurred on the use of magnetic materials in wastewater treatment, including the removal of dye,Reference Iram, Guo, Guan, Ishfaq and Liu14–Reference Afkhami, Tehrani and Bagheri16 phosphate,Reference Xiong, He, Mahmood, Liu, Yang and Islam17 heavy metal ions,Reference Shen, Tang, Nie, Wang, Ren and Zuo18–Reference Liu, Zhang and Sasai20 fluoride,Reference Zhao, Wang, Wu, Wang, Cai, Shi and Jiang21 and sulfonamidesReference Sun, Chen, Sun, Du, Yue, He, Xu, Zeng, Wang and Ding22 from wastewater. Co is an important ferromagnetic metal, which can crystallize in three structures: the hexagonal close-packed (hcp), the face centered cubic (fcc), and the epsilon (ε) phases. Generally, the hcp phase with a high coercivity is of interest in the field of permanent magnets, whereas the fcc phase with a low coercivity can be used as a soft magnetic material.Reference Dmitry and Bawendi23 In this contribution, the crystal structure of Co was regulated by the dosages of N2H4·H2O. The Co crystal with mixed structure shows excellent CR removal ability. Herein, the removal mechanism is deeply studied.
II. MATERIALS AND METHODS
All chemicals were of analytical grade and were used without further purification. The chemicals were obtained from Beijing Chemicals Co. (Beijing, China).
A. Synthesis of Co crystals
In the first step, 0.1 g of CoCl2·6H2O was dissolved in 20.0 mL of ethylene glycol (EG) with magnetic stirring at 20 °C for 30 min. Quantified H2C2O4 (0.1 g) and NaOH (0.2 g) were added to the solution, and then a certain amount of N2H4·H2O (55 vol% analytical reagent) was added dropwise with vigorous stirring for 30 min. Subsequently, the solution was transferred into a 30 mL Teflon-lined stainless steel autoclave. The autoclave was sealed and maintained at 200 °C for 12 h and then cooled to room temperature naturally. The products were collected by filtration, washed several times with distilled water and absolute ethanol, and finally dried in a vacuum oven at 60 °C for 4 h. The above-mentioned dosages of N2H4·H2O are separately 0, 1, and 2 mL, and then the S1, S2, and S3 samples were synthesized, respectively.
B. Characterization methods
The phases were identified by x-ray diffraction (XRD) with a Rigaku D/max 2500pc x-ray diffractometer (Rigaku Corporation, Tokyo, Japan) with Cu Kα radiation (λ = 1.54156 Å) at a scan rate of 0.02°/1 s. Morphologies were characterized by a JEOL JSM-6700F field-emission scanning electron microscopy (FESEM; JEOL Ltd., Tokyo, Japan) operated at an acceleration voltage of 10.0 kV. Transmission electron microscopy (TEM), high-resolution TEM (HRTEM) observations, and selected area electron diffraction (SAED) patterns were obtained on a JEOL 2100F with an emission voltage of 200 kV. Infrared spectra of the samples were characterized using a Fourier transform infrared spectroscopy (FTIR; NEXUS, 670, Thermo Nicolet Corporation, Madison, WI) in KBr pellets. Hysteresis loops were measured on a vibrating sample magnetometer (VSM-7300; Lakeshore, Columbus, OH) at room temperature. N2 adsorption–desorption isotherms were measured at the liquid nitrogen temperature (77 K) using a JW analyzer (JW-RB224, Beijing JWGB Sci. & Tech. Co., Ltd., Beijing, China). Samples were degassed at 60 °C overnight before measurements. Specific surface areas were calculated using the Brunauer–Emmett–Teller (BET) model. An Agilent Cary 50 UV-vis spectrophotometer (Agilent, Palo Alto, CA) was used for determination of CR concentration in the solutions.
C. Batch adsorption experiments
The stock solution of CR (1 g L−1) was prepared in deionized water and desired concentrations of the dye were obtained by diluting the same with deionized water. The calibration curve of CR was prepared by measuring the absorbance of different predetermined concentrations of the samples at λmax = 497 nm using UV-vis spectrophotometer (CR has a maximum absorbency at a wave length of 497 nm on a UV-vis spectrophotometer). The amount of adsorbed CR (mg g−1) was calculated based on a mass balance equation as given below:
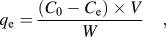 $${q_{\rm{e}}} = {{({C_{\rm{0}}} - {C_{\rm{e}}}) \times V} \over W}\quad ,$$
where q e is the equilibrium adsorption capacity per gram dry weight of the adsorbent, mg g−1; C 0 is the initial concentration of CR in the solution, mg dm−3; C e is the final or equilibrium concentration of CR in the solution, mg dm−3; V is the volume of the solution, dm3; and W is the dry weight of the hydrogel beads, g.
Take one adsorption of CR for example. Standard solution with initial concentrations of 100 mg L−1 was prepared. Then, 5 mg of cobalt crystals was added to 50 mL of the above solution under stirring. After a specified time, the solid and liquid were separated by a magnet and UV-vis adsorption spectra were used to measure the CR concentration in the remaining solutions.
III. RESULTS AND DISCUSSION
A. Studies of structure and microstructure
The dosage of N2H4·H2O has a significant influence on both the morphology and structure of Co crystals, as shown in Fig. 1. Distinctive TEM images of S1 to S3 are displayed in Figs. 1(a)–1(c). Figure 1(d) shows XRD patterns of as-prepared S1 to S3. The diffraction peaks at 2θ = 41.63, 44.57, 47.51, and 75.97°, which match the reflection planes of (100), (002), (101), and (110), respectively, could be indexed to a pure hcp cobalt phase (JCPDS 05-0727). The diffraction peaks for the as-formed sample at 2θ = 44.20, 51.54, and 75.89°, which match the reflection planes of (111), (200), and (220), respectively, could be indexed to a pure fcc cobalt phase (JCPDS 15-0806). In summary, S1 and S2 possess fcc and hcp mixed structure, whereas S3 displays pure hcp structure. Moreover, by comparing the intensity of (200) reflection planes for S1 and S2, the fcc phase is decreasing. The dosage of N2H4·H2O directly relates to the reduction rate during the formation process of metallic Co, because Co(N2H4)m2+ complexes (where m is the amount of N2H4·H2O) may be formed.Reference Li, Li, Liao and Wang5 The different reduction rate may limit the growth rate of Co particles, so Co crystals with various morphologies were prepared. Furthermore, the amount of N2H4·H2O will produce an effect on the “m” in the Co(N2H4)m2+ complexes, consequently the activation energy for the decomposition of Co(N2H4)m2+ complexes may be changed. Both hcp and fcc phases of Co are close-packed structures, and the only difference between them is the stacking sequence of atomic planes in the <111>direction. Lower activation energy for the formation of stacking faults often leads to the presence of two phases in the same substance.Reference Liu, Li and Liu24 Therefore, no or lower dosage of N2H4·H2O facilitates the formation of Co crystals with hcp and fcc mixed structure.
TEM images of (a) S1, (b) S2, (c) S3 and (d) XRD patterns of S1 to S3.

Further insight into the hcp and fcc phases of Co microstructures was gained using HRTEM. HRTEM and SAED were performed in the region of particles fringe as labeled in Figs. 1(a)–1(c), and the micrographs are shown in Fig. 2, respectively. The HRTEM image in Fig. 2(a) shows that the spacing at the lattice fringes was 2.05 Å (outside) corresponding to the (111) plane of the fcc Co. Fast Fourier Transform (FFT) of red square region of dark set can be observed from Fig. 2(b). FFT (yellow circles) exhibits a hexagonal symmetry which represents hcp diffraction spots. It is emphasized that the surface is fcc structure and the interior is hcp structure for S1. Figure 2(c) gives us the information that S2 is composed of hcp Co and fcc. As shown in Fig. 2(d), S2 comprises two parts: diffraction rings and diffraction spots. By measurement and calculation, the diffraction rings correspond to the polycrystalline Co nanosheets with hcp structure. Otherwise, the diffraction spots match the single-crystalline Co spheres with fcc structure. Figures 2(e) and 2(f) help us ascertain that S3 is pure phase Co with hcp structure which is clearly shown in FFT of red square region [Fig. 2(f)].Reference Sato, Kitakami, Sakurai, Shimada, Otani and Fukamichi25–Reference O’Handley, Corb and Grant28 For all the samples, consistent experimental results are obtained from the HRTEM and XRD characterizations. S1 and S2 are hcp and fcc mixed structure, whereas S3 is pure hcp structure. With the increasing dosages of N2H4·H2O, the hcp phase is increased.
(a), (c), and (e) are the HRTEM images of S1, S2, and S3, respectively; (b) and (f) are the corresponding Fourier transforms of S1 and S3, respectively; (d) is the SAED pattern of S2.
In the present case, all the three samples are with rough surfaces. The surface roughness of S1 is more serious than that of S3. The rough surface directly leads to somewhat extended defects like dislocations and stacking faults along the surface. Moreover, a distinct interface is observed from the HRTEM image of S2 [Fig. 2(c)]. The presence of interface results in accumulation of a certain amount of stacking faults. The defects and stacking faults will not only provide better catalytic activity and selectivity but also some unpredictable new characteristics, for instance, sewage treatment ability. All of these characteristics deserve further research.
B. Morphologies and magnetic properties
Magnetic property is the basic performance of cobalt crystal, which is a key factor to decide its future application. Generally, metallic Co can crystallize in three structures: hcp, fcc, and ε phases. Among them, hcp and fcc phases are known to exist at room temperature, whereas ε phase is considered as a metastable phase. All of them have different magnetic properties.Reference Dmitry and Bawendi23
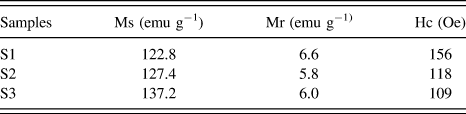
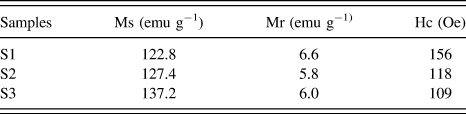
Figure 3 shows the room-temperature hysteresis loops and SEM images of S1 to S3. Furthermore, the magnetic parameters of samples obtained from hysteresis loops were listed in Table I. It can be concluded that the structure of Co has an influence on its morphologies and magnetic properties. S1 is composed of dendritic and spherical mixed shapes which are covered with mangy irregular protuberances, and their diameters are in the range of 1.5–3 μm. Furthermore, S2 consists chiefly of sphere about 200–500 nm in diameter, and its surface is blanketed with around 5 nm of nanosheets which can be estimated from the standing ones in the SEM images. S3 with hcp phase is made up of 300–600 nm of submicrometer spheres with rough surfaces about 300–600 nm in diameter. The particle sizes and shape anisotropy of Co crystals correspond to their different magnetic properties. Generally speaking, the excellent magnetism of Co crystal may make for improving its callback efficiency after CR removal.
(a) Room-temperature hysteresis loops; (b) SEM images.
Magnetic parameters obtained from hysteresis loops.
C. Evaluation of CR removal ability by S1 to S3
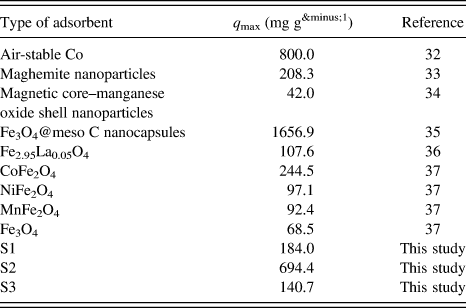
By the above investigation on the structure and magnetism, it may be meaningful to evaluate sewage treatment ability of S1 to S3. Herein, the Co crystals were used to remove CR from aqueous solution. CR removal is relatively difficult because of its good water solubility and large and complicated structure. The CR removal abilities of S1 to S3 are shown in Fig. 4(a). Aqueous solutions with initial CR concentration 100 mg L−1 were used for the experiment at neutral pH = 7.0, with adsorption times from 0 to 240 min, and T = 20 °C. The final CR removal abilities of S1 to S3 are 184.0, 694.4, and 140.7 mg g−1, respectively. Among the three samples, S2 exhibits the highest CR removal ability. The surface nanosheets make S2 show the much higher specific surface area than those of the other samples; therefore, S2 has the biggest CR adsorption capacities. However, the crystal structure of Co also has an influence on the CR removal ability. In addition, Co particles loaded with CR can be quickly separated by a magnet, leaving a clear and colorless solution.
(a) Adsorption capacity of S1 to S3; (b) FTIR spectra of metallic cobalt, after adsorption and CR from bottom to top.
To understand the CR removal process by Co crystals, FTIR was used to investigate the surface changes of S2 before and after CR removal, as shown in Fig. 4(b). For the FTIR spectrum of S2 (green line), there are no bonds of metal oxides, indicating that the obtained cobalt particles were not oxidized in the synthesis process. The bond at 1628 cm−1 was undoubtedly due to the O–H bend vibration of the absorption water, but the bond at 1351 cm−1 derives from the existence of the O–H bond of constitution water.Reference Li, Bao, Chai, Zhang, Han and . Niu29 As seen from the Co + CR spectrum (sky blue line), the weak bond at 560 cm−1 is believed to be associated with the stretching vibrations Co2+–O2–. Hence, oxidation and reduction reactions took place during the CR removal process. The weak bond at 3440 cm−1 can be attributed to N–H stretching vibration. The new bond at 1620 cm−1 can be attributed to C=C stretching vibration in benzene. New signals around 1380 and 1180 cm−1 are due to the framework vibration of benzene rings. Furthermore, the S=O stretching vibration in CR is still observed from the Co + CR spectrum, but it shifts to a low wave number of 1024 cm−1.Reference Deng, Li and Fu30,Reference Zhang, Qu, Liu, Cooper and Wu31 Compared with FTIR spectroscopy of CR (red line), the obvious decrease in aromatic rings' absorption peak of S=O bond after treatment indicated the destruction of CR structure by the Co crystals. By contrastive analysis of the FTIR spectra, we are certain that CR molecules were loaded on the surface of Co crystal by physical adsorption and chemical reduction at the same time.
A schematic adsorption process of CR by the Co crystals is as illustrated in Scheme 1. First, the CR molecules contact with the surface of Co with hcp structure and gradually interact with the interface of hcp and fcc structures. Finally, physical adsorption occurred between the CR molecules and the surface of Co with fcc structure. The reduction reaction may occur on the surface and interface of S2, because its surface is composed of 5 nm of nanosheets, which may make S2 possess high reaction activity.
Schematic adsorption process on Co crystals.
What is causing the differences of CR removal abilities for the three samples? Generally speaking, specific surface area is an important factor to decide the sewage treatment ability. The test results of BET show that the surface areas of the synthesized adsorbents from S1 to S3 are 9.5, 19.1, and 12.3 m2 g−1, respectively. However, the CR removal abilities of S1 and S3 did not quite fit with the result of BET test. From the results of HRTEM and XRD, the sequence for mixing extent of crystal structure is S2, S1, and S3, which accords with the sequence of CR removal ability. Hence, the crystal structure of Co has an important influence on the CR removal ability. Surface energy relates to the compact degree of atoms arrangement on the crystal surface. The close packing surface has the minimal surface energy. Therefore, the mixing structure of Co crystals may increase their surface energy, which may facilitate their CR removal ability.
Moreover, the presence of large amount of nanosheets on the surface of S2 is the most important factor for its very high CR removal ability relative to S1 and S3. And the S2 with submicrometer fcc Co spherical core will be good for its magnetic callback after CR removal.
D. Performance evaluation
The reported q max values of other magnetic adsorbents for CR adsorption are listed in Table IIReference Liang and Zhao32–Reference Wang, Li, Wang, Zhao and Jiang37. Afkhami et al. investigated CR adsorption on maghemite nanoparticles and fitted the equilibrium data well with the Langmuir model with maximum monolayer adsorption capacity of 208.3 mg g−1.Reference Afkhami and Moosavi33 Zhai found that the Langmuir model best fitted the CR adsorption on magnetic core–manganese oxide shell nanoparticles and the saturation adsorption capacity is 42.0 mg g−1.Reference Zhai, Zhai, Zhou and J. Dong34 Except for Fe3O4@meso C nanocapsules [its saturation magnetization (Ms) value is 5.5 emu g−1 which will be against the separation rate]Reference Zhang, Xu, Luo, Pan, Ding and Li35 and air-stable cobalt,Reference Liang and Zhao32 the S2 (Ms = 127.4 emu g−1) used in this study has the highest q max values (694.4 mg g−1). In addition, all the particles can be easily separated after adsorption by a magnet. This is an important feature that makes the metallic cobalt suitable for economic operations in industrial wastewater treatment.
Adsorption capacities of CR dye on various magnetic adsorbents.
IV. CONCLUSIONS
Cobalt crystals with hcp and fcc mixed structure and hcp structure were prepared by a solvothermal process. The hcp phase is increased with the dosages of N2H4·H2O. The Co crystal with hcp and fcc mixed structure has the highest CR removal ability (694.4 mg g−1). Reduction and physical adsorption occurred at the same time during the CR removal process by Co crystals. The submicrometer Co crystal may facilitate it to keep higher magnetism after CR removal, which is of vital importance for its practical application in wastewater treatment.
ACKNOWLEDGMENT
The financial support from the Foundation of Liaoning Province (L2011198), Natural Science Foundation of Jilin Province (20101542) of China, and the National Foundation of Doctoral Station (Grant No. 20100061110019) are acknowledged.