1 Introduction
In the metrical description of phonological words, an intermediate foot level has been adopted between syllables and words in order to account for the tendency of strong and weak syllables to alternate. This concept of the foot involves maximally two syllables, the first one of which is strong. It is the grouping of syllables into feet and of feet into prosodic words that determines the potential position of primary stress in a word, i.e. the strong syllable of a strong foot bears the main stress.
According to metrical stress theories (Liberman Reference Liberman1975, Liberman & Prince Reference Liberman and Prince1977, Selkirk Reference Selkirk1980, Giegerich Reference Giegerich1985, Hayes Reference Hayes1985, Reference Hayes1995, Nespor & Vogel Reference Nespor and Vogel1986, Kager Reference Kager and Goldsmith1995, Alber Reference Alber, Booij and van de Weijer1997, Reference Alber2005, Trommelen & Zonneveld Reference Trommelen and Zonneveld1999), one function of stress is the hierarchical organisation of rhythmic units. In this respect, stress is a relation between prominent and weak syllables that is realised via phonetic parameters such as fundamental frequency (F0), duration and intensity. The relational property of stress can be expressed by means of metrical feet, which assign strong and weak syllables to metrical patterns. In this way, different foot-types can be derived on the basis of the number of syllables, syllable quantity and the direction in which feet are constructed (right- or leftwards). For example, Hayes (Reference Hayes1995) assumes a strictly binary foot structure, involving either trochees (initial stress) or iambs (final stress). Binary feet consist either of two light syllables (monomoraic) or of one heavy syllable (bimoraic).Footnote 1 Exceptions are degenerate feet, which consist of one syllable only, and extrametrical syllables, which fall outside the rhythmic pattern. In this approach, the prosodic structure of words consists of a two-level hierarchy: (i) strong and weak syllables are parsed into feet, and (ii) strong and weak feet are parsed into prosodic words. An example of the resulting metrical structure is given for final-stressed Vitaˈmin ‘vitamin’ in (1).
(1)

Although such a prosodic hierarchy has proved useful in describing prosodic structure from a theoretical perspective, there is still a strong tradition in the description of stress patterns in which the foot as a prosodic category is not used, as in the IPA stress classification, which provides for up to three degrees of inherent prominence (IPA Handbook 1999: 15). Grid-only approaches, as proposed by Liberman & Prince (Reference Liberman and Prince1977), do not make use of the foot or a similar category.
In the present paper, we explore whether the metrical foot is indeed a structural unit within prosodic systems, presenting empirical findings from language-comprehension studies on German word stress.
1.1 The German word-stress system
In the model of metrical theory adopted by Hayes (Reference Hayes1995), the crucial prosodic parameter of a language is its foot type (trochee or iamb), according to which syllables are grouped within a prosodic word. It is generally accepted (e.g. Jessen Reference Jessen1999) that Modern Standard German is a trochaic language, meaning that a foot consists of two moras or syllables. Thus, the minimal German word consists of a bimoraic syllable (e.g. Wort ‘word’) or of two monomoraic syllables (e.g. Mama ‘mummy’).
Despite the fact that there seems to be a preference for specific stress patterns in Modern Standard German, the position of main stress in monomorphemic words is variable, as it can be assigned to one of the last three full syllables of a prosodic word. Although there are a few exceptions to this three-syllable rule (Vennemann Reference Vennemann1990; e.g. grammatical terms such as ˈNominativ ‘nominative’, ˈAkkusativ ‘accusative’), this rule is the most reliable one within the description of the German stress system. Though proposals trying to account for the variability of main stress within the three-syllable window are somewhat controversial, we will introduce several of them in the following.
Within his comprehensive theory of the prosodic phonology of Standard German, Wiese (Reference Wiese1996) assumes that stress is exclusively defined through the definition of a strong–weak relationship between syllables and feet within a prosodic hierarchy. Wiese argues that stress assignment in German requires (i) default rules according to which binary trochaic feet are constructed and the final foot within a prosodic word is strong (resulting in penultimate stress, as in Veˈranda ‘veranda’), and (ii) a number of lexical specifications (resulting in final stress, as in Samuˈrai ‘samurai’, or antepenultimate stress, as in ˈKimono ‘kimono’). Alternatively, other phonologists have proposed that most stress positions in German words can be derived on the basis of the structure of the final and prefinal syllable (e.g. Giegerich Reference Giegerich1985, Féry Reference Féry1998). According to these approaches, words with a heavy final syllable have final stress, and those with a light final syllable are stressed on the penultimate syllable. Furthermore, stress cannot be retracted beyond a heavy penult.
Alber (Reference Alber, Booij and van de Weijer1997) proposes a metrical analysis of German polysyllabic words that also involved principles of foot construction. In her analysis, constraint interactions demand that feet be binary and left-headed. Main stress has to be realised as far to the right as possible, whereas in words with at least two feet secondary stress is aligned with the left edge of a prosodic word. Furthermore, exhaustive parsing of syllables into feet is influenced by the avoidance of stress clash and, where possible, by heavy syllables attracting stress.
In some other accounts it is argued that the default stress pattern in German is mainly determined by the statistical distribution of the three possible stress patterns (e.g. Levelt Reference Levelt1999, Levelt et al. Reference Levelt, Roelofs and Meyer1999). The observation that penultimate stress is the most frequent stress pattern has led to the assumption that penultimate stress is the only unmarked stress pattern, whereas the other patterns have to be specified lexically. However, a closer look reveals that the overwhelming occurrence of penultimate stress results from the fact that the German vocabulary largely consists of bisyllabic words ending in a reduced syllable. Consequently, Levelt (Reference Levelt1999) and Levelt et al. (Reference Levelt, Roelofs and Meyer1999) propose that main stress on the first stressable syllable of a word can be assigned by default without lexical specification, whereas all other stress patterns are irregular and have to be stored as part of the idiosyncratic phonological representation of a word. A CELEX-based (Baayen et al. Reference Baayen, Piepenbrock and Gulikers1995) corpus analysis performed by Féry (Reference Féry1998) revealed that 73% of bisyllabic German words are indeed stressed on the first syllable. However, considering only words with two full vowels, the frequency distribution of initial and final stress changed. Of 1495 words with two stressable syllables, 61% were stressed on the final syllable. For trisyllabic words, a similar distribution of stress patterns holds (Féry Reference Féry1998): in a corpus of 1312 words including both reduced and full final syllables, the penult was stressed in 51% of cases, whereas within a corpus of words with stressable final syllables, primary stress was realised on the penult in 18% of cases, on the antepenult in 29% of cases and on the final syllable in the remaining 53%. These proportions show that the type of stress pattern depends on the structure of the final syllable rather than on the frequency of a specific stress pattern alone, since only words with a reduced final syllable are generally stressed on the penult, while this is not necessarily the case for words with a full final syllable. This observation was confirmed by a corpus analysis of trisyllabic German nouns reported in Janßen (Reference Janßen [Domahs]2003), in which words with superheavy syllables (-VVC, -VCC) received final stress in 88% of all cases.
A further crucial question relates to the concept of syllable weight and quantity-sensitivity of German more generally. Phonologists who support the quantity-sensitive account of German word stress provide different definitions of syllable weight. For instance, Giegerich (1985) adopts the traditional notion of syllable quantity, assuming that bi- and trimoraic syllables are heavy (i.e. -VV, -VC, -VVC, -VCC).Footnote 2 In contrast, Féry (Reference Féry1998) only considers syllables with the structure -VVC and -VCC (classified as superheavies by e.g. Giegerich Reference Giegerich1985 and Kager Reference Kager1989) to be heavy and to attract primary stress. In another proposal, that of Vennemann (Reference Vennemann1990, Reference Vennemann, Bertinetto, Kenstowicz and Loporcaro1991), only closed syllables are heavy, i.e. -VV syllables are light. Given the distribution of stress in German words, the large number of lexical exceptions arising within each theory makes it difficult to decide which syllables are heavy and which are not. These controversies have led other phonologists to propose that German is not quantity-sensitive at all (e.g. Kaltenbacher Reference Kaltenbacher1994, Wiese Reference Wiese1996). By contrast, Janßen (Reference Janßen [Domahs]2003) shows that concepts of weight that were originally posited for Dutch (e.g. Kager Reference Kager1989, Trommelen & Zonneveld Reference Trommelen and Zonneveld1999) can also account for empirical findings (in a pseudo-word experiment and a corpus study) in German. According to these proposals, only closed syllables are heavy, since open syllables are obligatorily long. In German, Janßen observes that pseudo-words with a closed final syllable were mainly stressed on the final or antepenultimate syllable, while pseudo-words with an open final syllable were mainly stressed on the penultimate syllable.
To summarise, accounts of German word stress differ as to whether they refer to foot structure and how feet are constructed. In the present paper, we explore whether metrical foot effects can be detected in language comprehension. Are stress-violation effects sensitive to prosodic structures or rather to the relative frequency of different stress positions? If prosodic structure does matter, then we must still establish which kind of foot structure can best explain the results.
1.2 Prosodic structure: empirical data
While the role of prosody in general is well established in psycholinguistic studies of word processing, it is unclear whether feet are psychologically real concepts. Most experimental studies on prosody have attempted to elucidate the importance of prosody in the identification and segmentation of linguistic units such as words or phrases. For instance, it has been shown that prosodic information plays a crucial role in word segmentation in early language acquisition (e.g. Mehler et al. Reference Mehler, Jusczyk, Lambertz, Halsted, Bertoncini and Amiel-Tison1988, Nazzi et al. Reference Nazzi, Bertoncini and Mehler1998) and in spoken word recognition in adults (the Metrical Segmentation Strategy: Cutler & Clifton Reference Cutler, Clifton, Bouma and Bouwhuis1984, Cutler & Norris Reference Cutler and Norris1988, Cutler & van Donselaar Reference Cutler and van Donselaar2001). Likewise, Grosjean & Gee (Reference Grosjean and Gee1987) propose that the recognition of a word is guided by its particular stress pattern. A word is accessed when a stressed syllable is encountered. Furthermore, it has been observed that every strong syllable, whether it bears primary or secondary stress, has an impact on word recognition (Cutler & Norris Reference Cutler and Norris1988, Norris et al. Reference Norris, McQueen and Cutler1995, Mattys Reference Mattys2000).
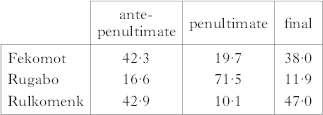
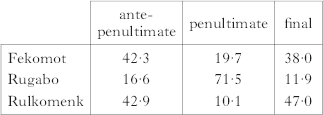
Previous empirical evidence for foot structures has been mainly derived from a few observations of phonological or morphophonological phenomena. For instance, Wiese (Reference Wiese1996) claims that the foot can be determined by the occurrence and distribution of the glottal stop in German words: syllable-initial vowels are avoided by the insertion of a glottal stop, but only in foot-initial position (e.g. [tri.o] Trio ‘trio’ vs. [di.ʔo.də] Diode ‘diode’). McCarthy & Prince (Reference McCarthy, Prince, Spencer and Zwicky1998) and others investigate prosodic constraints on morphological processes and show that, in a variety of languages, certain morphological output forms are constrained by the minimal word, which consists of at least one bimoraic foot. In language acquisition, Gerken (Reference Gerken1994, Reference Gerken1996) observes that the vulnerability of a syllable in child language depends on the integration of that syllable within the prosodic structure of a word. For instance, weak syllables embedded in a foot structure (σs σw)Ft are less prone to omission than unparsed weak syllables (σw (σs σw)Ft). Further empirical evidence for the psychological reality of foot structures stems from a production task using trisyllabic pseudo-words that was performed with speakers of German (Janßen Reference Janßen [Domahs]2003). Pseudo-words varying in syllable structure were stressed predominantly on the penultimate syllable only if words ended with an open final syllable, while words with a closed final syllable were realised either with antepenultimate or final stress (see Table I). Thus the distribution of stress patterns suggests that the former case involves a single foot (final trochee), whereas the latter involves two feet (final monosyllabic foot preceded by a trochee), both of which may attract main stress. With respect to words with penultimate stress and an open final syllable, it is assumed that the final syllable does not build a non-branching foot (even if it consists of a long vowel), because such a structure would lead to a stress clash.
Distribution of stress patterns (in %) in a production task with pseudowords that varied according to syllable structure (Janßen 2003).
The present experiments provide further empirical support for the assumption of an intervening foot level between syllables and prosodic words. We used the event-related potential (ERP) technique, an online method which has been successfully applied in the investigation of language processing. ERPs (event-related potentials) are small changes in the spontaneous electrical activity of the brain occurring in response to sensory or cognitive stimuli, which may be measured non-invasively by means of electrodes applied to the scalp. ERPs provide a very high temporal resolution, which is particularly useful in tracking real-time language processing. Furthermore, ERP patterns (‘components’) can be characterised along a number of different dimensions, thus providing a qualitative measure of the different processes involved in language comprehension. These dimensions are polarity (negative vs. positive), topography (at which electrode sites an effect is visible), latency (the time at which the effect is visible relative to the onset of a critical stimulus) and amplitude (the ‘strength’ of an effect). ERP components are typically named according to their polarity (N for negativity vs. P for positivity) and latency (an N400, for example, is a negativity with a peak latency of approximately 400 ms relative to the critical stimulus onset).
For instance, violations of phrase structure (e.g. Friederici Reference Friederici2002, Hahne & Friederici Reference Hahne and Friederici2002) or morphosyntactic structure (e.g. Penke et al. Reference Penke, Weyerts, Gross, Zander, Münte and Clahsen1997, Gross et al. Reference Gross, Say, Kleingers, Clahsen and Münte1998, Gunter et al. Reference Gunter, Friederici and Schriefers2000) yield left anterior negativity with latencies between 150 and 250 ms (early left anterior negativity) and 300 and 500 ms (left anterior negativity) post stimulus onset respectively. By contrast, problems in lexical or semantic integration typically elicit a centro-parietal negativity (N400) within the same time window (see Kutas & Federmeier Reference Kutas and Federmeier2000 for a review).Footnote 3
With respect to prosodic processing, most ERP-based research has been concerned with sentence prosody (e.g. Steinhauer et al. Reference Steinhauer, Alter and Friederici1999), where the processing of intonational phrase boundaries evoked a positivity effect (Closure Positive Shift; CPS) and violations of intonational phrase contours led to an N400 followed by a late positive deflection (P600).
To date, only a few ERP studies have investigated the role of metrical properties of words. Some of these were performed to examine how prosodic information contributes to word retrieval, whereas others investigated the influence of frequency distributions on the processing of different stress patterns.
In an ERP study using cross-modal word fragment priming, Friedrich et al. (Reference Friedrich, Kotz, Friederici and Alter2004) found a reduction of a P350 effect whenever an auditory word fragment prime like [re] matched a target like [reˈgaːl] Regal ‘shelf’ in terms of suprasegmental information. These findings were taken as evidence that lexical identification benefits from suprasegmental information such as pitch contours. However, in contrast to a segmental mismatch, a prosodic mismatch did not lead to an N400 effect, indicating an increase in lexical integration costs. The main finding of this experiment was that stress information contributes to the lexical retrieval of words. This assumption has been confirmed by a recent study reported by Knaus et al. (Reference Knaus, Wiese and Janßen [Domahs]2007), in which incorrect stress patterns in auditorily presented words yielded an N400 effect as a reflex of difficulties in lexical access.
Previous ERP studies investigating the processing of words with frequent or infrequent stress patterns (e.g. Böcker et al. Reference Böcker, Bastiaansen, Vroomen, Brunia and de Gelder1999, Friedrich et al. Reference Friedrich, Alter and Kotz2001) revealed that different stress patterns in bisyllabic words (penultimate vs. final stress) correlated with different ERP components. Using a stress-discrimination task, Böcker et al. (Reference Böcker, Bastiaansen, Vroomen, Brunia and de Gelder1999) reported a fronto-central negativity effect (N325) for stress shifts from strong-initial words to weak-initial words. In contrast, Friedrich et al. (Reference Friedrich, Alter and Kotz2001) recorded ERPs during the processing of correctly and incorrectly stressed bisyllabic words (ˈAmboss vs. *Amˈboss ‘anvil’ and Abˈteivs. *ˈAbtei ‘abbey’) with artificially manipulated pitch contours. These authors did not observe any ERP differences between correct and incorrect stress patterns, but an overall comparison between initially stressed and unstressed words revealed a parietal P200 effect for initially unstressed words.
The two effects related to the processing of different prosodic templates, the N325 (Böcker et al. Reference Böcker, Bastiaansen, Vroomen, Brunia and de Gelder1999) and the P200 (Friedrich et al. Reference Friedrich, Alter and Kotz2001), were interpreted as effects indicating a mismatch between the expected (highly frequent) trochee and the encountered (infrequent) iamb. However, neither of the studies controlled properties such as the structure of the final syllable and the stressability of syllables containing either a full vowel or schwa.
The present studies therefore attempted to provide a more comprehensive investigation of effects of stress position by manipulating the structure of the final syllable, while controlling for other relevant parameters. Moreover, experiments were performed using trisyllabic words, which allow for an investigation of the entire prosodic system with a larger range of possible stress patterns. Specifically, we compared stress violations that involved different consequences for foot structure, i.e. violations requiring a change of foot structure ((ˈσσ)(σ) changed into σ(ˈσσ)) vs. violations allowing for the foot structure to be upheld ((ˈσσ)(σ) changed into (σσ)(ˈσ)). In Experiment 1, we examined all possible violations of the three different stress patterns, while Experiment 2 employed a single stress manipulation for words differing in syllable structure. The aim of the ERP studies was to identify neurocognitive correlates of specific prosodic structures at work during word processing.
2 Experiment 1
To examine electrophysiological effects induced by different stress types, we recorded brain responses to correctly and incorrectly stressed words with final stress (e.g. Vitaˈmin ‘vitamin’), prefinal stress (e.g. Biˈkini ‘bikini’) and antepenultimate stress (e.g. ˈAnanas ‘pineapple’).
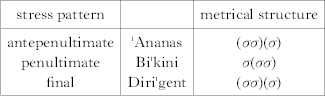
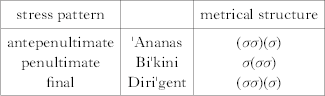
For the aims of the present study, it is crucial to compare words differing in foot structure. In metrical theory, it has been proposed that words with distinct main stress positions vary in terms of their underlying metrical structure. For instance, Table II illustrates how the syllables of words with final, penultimate or antepenultimate stress can be parsed into feet. Accordingly, it is suggested here that German words with final or antepenultimate stress consist of two prosodic feet: the final syllable forms a non-branching foot (σ) and the first two syllables build a trochee (ˈσσ). In words with final stress, word stress falls on the final foot; in words with antepenultimate stress it falls on the first foot. In contrast to words with final and antepenultimate stress, we assume that words with penultimate stress consist of only one final trochee. It is an unresolved issue whether the leftmost syllable in these words builds a foot on its own or whether it is unfooted.
Metrical structure of words with different stress patterns.
An alternative analysis of trisyllabic words with antepenultimate stress makes use of the notion of extrametricality, first proposed by Liberman & Prince (Reference Liberman and Prince1977) for the stress system of English. For instance, in her analysis of German word stress, Féry (Reference Féry1998) suggests that the final syllable of a word like ˈSellerie ‘celery’ is not parsed into a foot structure. For Féry, feet are strictly binary, consisting of two light syllables or one heavy syllable (either -VVC or -VCC). Since she regards syllables of the type CVV as light, the final syllable of Sellerie /ˈzεləʁiː/ cannot form a foot on its own and is left unparsed. According to Féry, extrametricality of the final syllable is not a general principle in German, but can be derived from the interaction and ranking of the FootBinarity and Weight-to-StressPrinciple constraints (both first proposed by Prince & Smolensky Reference Prince and Smolensky1993) and AlignFt-R (McCarthy & Prince Reference McCarthy and Prince1993). A heavy final syllable forms a monosyllabic foot and receives main stress, thus satisfying AlignFt-R. A light final syllable either forms the weak part of a trochaic foot, if the penultimate syllables bears main stress, or is left unparsed, if the antepenultimate syllable is stressed. The latter case is unmarked only in words with a schwa-syllable in penultimate position.
Thus, in Féry's OT account of German word stress, the final syllable of the word ˈAnanas is extrametrical and does not build a foot on its own. In the analysis presented in Table II, words with final stress and antepenultimate stress consist of identical foot structures, which poses problems with respect to the word parameter and the question which foot within a word is strong and bears main stress (or in Optimality Theory terms, the ranking of the constraints AlignFt-R and AlignFt-L). However, the observation that a number of words can have either antepenultimate or final stress (e.g. ˈMarzipan or Marziˈpan ‘marzipan’) speaks in favour of their having identical metrical structures. This matter will be raised again in the discussion in §2.3.
We should also mention in relation to the metrical analysis in Table II that we consider words with antepenultimate stress to consist of two metrical feet, irrespective of the structure of the final syllable. This might seem to be inconsistent with the observation that in the pseudo-word study of Janßen (Reference Janßen [Domahs]2003) antepenultimate stress occurs mainly in words with final closed syllables. We believe that antepenultimate stress in words like ˈLexikon ‘lexicon’ is less marked than in words like ˈAlibi ‘alibi’ (the corpus analysis (Janßen Reference Janßen [Domahs]2003) revealed that 68% of words with antepenultimate stress are of the first type). However, we assume that the underlying metrical structure is identical. In Experiment 2 we will discuss this aspect in more detail.
We hypothesise that prosodic structures higher than the syllabic level had an effect on the online processing of words as reflected in ERPs. Our objective is to examine whether different types of violations of stress and foot structure produced different electrophysiological effects.
2.1 Method
2.1.1 Participants
Twenty-four right-handed native speakers of German (twelve women, twelve men) with normal or corrected-to-normal vision and without hearing deficits participated in our experiment. Their mean age was 25 (ranging from 19 to 28). Each participant was paid for participation.
2.1.2 Material
Important criteria for the selection of words were firstly that each word contained three stressable syllables (i.e. those containing a full vowel) and secondly that each group of words with a specific stress pattern was controlled for the structure of the final and penultimate syllable. In accordance with the findings reported in Janßen (Reference Janßen [Domahs]2003), we selected particular syllable-structure templates for each stress pattern: words stressed on the final position contain predominantly a superheavy syllable with either a short vowel followed by a consonant cluster (e.g. Diriˈgent ‘conductor’) or a long vowel followed by one consonant (e.g. Krokoˈdil ‘crocodile’). Words with stress on the penult have an open final syllable and either an open or a closed penultimate syllable, and words stressed on the antepenultimate syllable contain an open penultimate syllable and either a closed or an open final syllable (see Table II).Footnote 4 The words were further controlled for frequency, according to the CELEX database (Baayen et al. Reference Baayen, Piepenbrock and Gulikers1995). All frequencies were kept below 30 occurrences per million (see Appendix B).
For each of the three possible stress patterns (final, penultimate and antepenultimate), we chose 30 items (listed in Appendix B). Each word was recorded with every stress pattern, i.e. once with the correct and twice with an incorrect stress pattern (e.g. correct Biˈkini; incorrect *ˈBikini and *Bikiˈni). Overall, we recorded 270 critical items (3 types of correct stress pattern×30 words×3 types of presented stress pattern). In order to balance the number of correct and incorrect stimuli, 90 filler items with correct stress patterns were added (30 filler items per stress pattern). The filler items were trisyllabic and comparable to the critical items in terms of frequency. Each word was embedded in the same carrier sentence (Er soll nun … sagen ‘He is supposed to say … now’) to avoid any interference effect of phrasal intonation with word stress.
Sentences were recorded by a female, linguistically trained speaker of German.Footnote 5 An analysis of the critical phonetic parameters (see Appendix C) showed that stress was realised with comparable parameter values irrespective of the correctness of the stress position. In particular, the phonetic parameters of words with antepenultimate and penultimate stress did not differ significantly between correctly and incorrectly stressed realisations. The same holds for unstressed syllables; for example, incorrectly unstressed initial syllables (e.g. *Aˈnanas) had the same mean phonetic values as correctly unstressed initial syllables (e.g. Biˈkini). However, words with final stress differed significantly between correct and incorrect conditions, mainly with respect to the parameter duration. This difference was due to the fact that the items with correct final stress consisted of a superheavy final syllable, which means that final syllables in words with final stress contained more segments than final syllables in words with antepenultimate or penultimate stress. Thus the observed significant difference results from the inherent property of words with final stress to contain final syllables with complex rhymes.
Stimuli were recorded digitally with 44 kHz and 16 bit (mono), using the CoolEditPro (version 1.2) sound recording and analysis programme (Syntrillium Software Corporation) and an ‘Elektret’ microphone (Sennheiser K6, ME 66). Each stimulus word was recorded embedded in the carrier sentence. After recording, each stimulus was spliced into the identical realisation of the carrier sentence with a pause 50 ms before and 40 ms after the critical item. This was done in order to determine the onsets of the critical items and to avoid different context inferences to the critical items. Moreover, it ensured that the combinations of carrier sentence and critical item sounded natural, and did not violate the pitch contour of the carrier sentences.
2.1.3 Procedure
Participants were comfortably seated in front of a computer screen in a dimly illuminated room. The experimental stimuli were presented auditorily via loudspeakers and the participants' task was to decide as accurately as possible whether the critical word within each sentence was stressed correctly or not. To enable a matching of an expected stress pattern with a correct or incorrect presented stress pattern, we presented the critical items visually prior to auditory presentation.
Each trial started with a fixation cross that appeared for 500 ms. A critical item was then presented visually for 500 ms, followed by a blank screen of 250 ms before the auditory presentation of the stimulus embedded in a carrier sentence started. The mean duration of the sentences was 2800 ms. After the offset of each sentence (Er soll nun … sagen), a question mark appeared and remained on the screen for 2000 ms. Participants were instructed to press a yes or no button with their thumbs as soon as the question mark appeared. Responses were given with a delay of 846 ms after offset of the critical items to avoid movement artefacts. The assignment of thumbs to the yes and no buttons was counterbalanced across participants. The appearance of the question mark further indicated that participants were allowed to blink and rest their eyes. The next trial was initiated after an intertrial interval of 2000 ms.
The stimuli appeared in six experimental blocks, preceded by a short practice phase. Experimental and filler items were presented in a pseudo-randomised order, each word appearing only once within each block. In order to avoid sequence effects, the order of the blocks was varied for each participant. The entire duration of an experimental session was approximately 45 minutes.
2.1.4 EEG recording and data analysis
An electroencephalogram (EEG) was recorded by means of 22 AgAgCl electrodes via a Brainvision amplifier, with the C2 electrode serving as ground electrode. The reference electrode during recording was placed at the left mastoid. EEGs were re-referenced offline to both mastoids. To control for eye-movement artefacts, vertical eye movements were recorded by electrodes above and below the participant's left eye, and horizontal eye movements by two electrodes fixed to the outer canthus of both eyes (electrooculogram (EOG)). Electrode impedances were kept below 5 kΩ. EEGs and EOGs were recorded continuously, with a digitisation rate of 250 Hz, and filtered offline with a bandpass filter from 0·3 to 20 Hz.
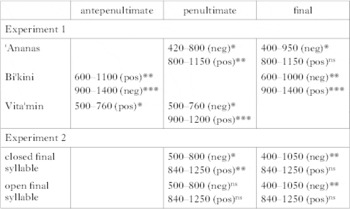
ERPs were computed for each participant, condition and electrode. Trials with eye-movement artefacts and incorrect responses were removed from the data (approximately 20% of trials, due to the long timespan of each stimulus). Averages were calculated starting at the onset of the critical word and extending to 1500 ms thereafter. ERP comparisons are always relative, i.e. negativities or positivities in a critical condition can only be interpreted relative to a control condition and not in absolute terms. We therefore compared each incorrect condition with the respective correct condition. For measurements of mean voltage, two time windows were chosen for each word-type separately, on the basis of a visual inspection of the grand average curves. The reason for this is that the position of violation effects depends on the position of incorrect word stress – compare violations like *Aˈnanas or *Anaˈnas, with main stress on the second or third syllable, to violations like *ˈBikini or *Bikiˈni, where it falls on the first or third syllable. For words with antepenultimate stress we chose (i) two early time windows, from 400 to 950 ms and from 420 to 800 ms, and (ii) a later one, from 800 to 1150 ms; for those with penultimate stress (i) from 600 to 1100 ms and (ii) from 900 to 1400 ms; and for those with final stress (i) from 500 to 760 ms and (ii) from 900 to 1200 ms (for an overview, see Table III).
ERP effects induced by stress violations in different time windows (in ms) selected in Experiments 1 and 2. The type of ERP effect found (either negativity or positivity) is indicated by (neg) or (pos). Contrasts between correct and incorrect conditions are indicated by * (p<0·05), ** (p<0·01), *** (p<0·001) or ns (not significant).

In a repeated measurements design, the factor Stress Position (antepenultimate, penultimate, final) was considered. An ANOVA was calculated for electrodes of particular regions (Region) separately. Regions were defined as frontal (electrodes F3, FZ, F4), central (electrodes C3, CZ, C4) and parietal (electrodes P3, PZ, P4).
2.2 Results
2.2.1 Behavioural data
Error rates were collected in order to control for the accuracy of stress perception. As was mentioned in the method section, the participants were instructed to give responses after the offset of the carrier sentence, i.e. 846 ms after the offset of the critical items. Due to the delay in response measurement, reaction-time data are not meaningful and will not be reported here.
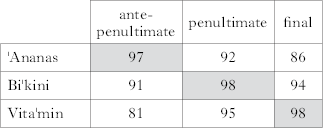
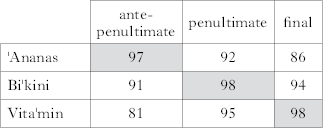
Error rates for the three word types differed significantly (see scores in Table IV). A 3×3 ANOVA revealed main effects for the factors Word Type (words stressed correctly either on antepenultimate syllable, penultimate or final syllable) and Stress Position (all three presented stress positions) (Word Type: F(2, 46)=7·019, p<0·003; Stress Position: F(2, 46)=4·812, p<0·036), as well as an interaction of the two factors (F(4, 92)=13·863, p<0·001). A post hoc analysis revealed that responses for words correctly stressed on the antepenult (ˈAnanas) were less accurate in conditions with final stress and, vice versa, words correctly stressed on the final syllable were more error-prone when initially stressed (ˈAnanas vs. *Anaˈnas: F(1, 23)=7·529, p<0·013; Vitaˈmin vs. *ˈVitamin: (F(1, 23)=10·996, p<0·004). However, no such difference was found for ˈAnanas vs. *Aˈnanas (F(1, 17)=1·867, p>0·185) and Vitaˈmin vs. *Viˈtamin (F(1, 23)<1). For violations of words with correct penultimate stress, no decrease in accuracy was detected for incorrect conditions (Biˈkini vs. *ˈBikini: F(1, 23)=1·778, p>0·195; Biˈkini vs. *Bikiˈni: F(1, 23)=1·540, p>0·227; see also accuracy scores in Table IV). Overall, the decrease in accuracy in ill-stressed words like *Anaˈnas and *ˈVitamin suggests that those forms were preferred by the participants over words such as *Aˈnanas or *Viˈtamin.
Accuracy scores obtained from Experiment 1. For each word group, mean accuracy scores (in %) are illustrated for correct (shaded) and incorrect conditions.
2.2.2 ERP data
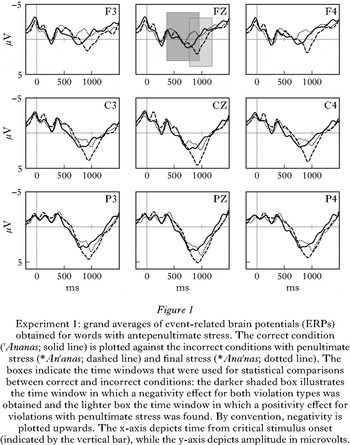
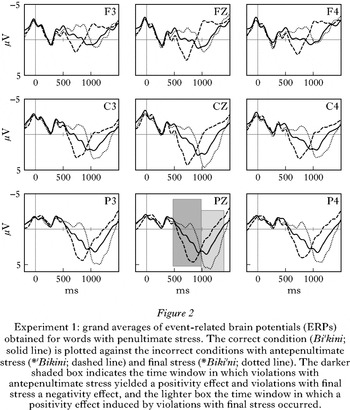
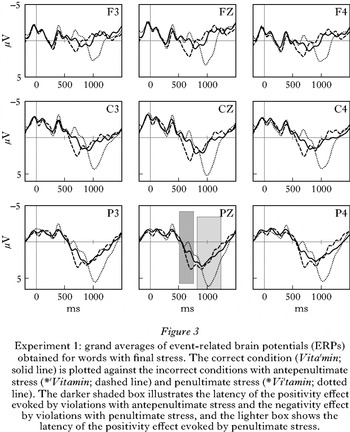
Figures 1–3 depict grand average ERPs for the three word categories with different correct stress pattern. Each figure is limited to nine out of 22 electrodes (F3, FZ, F4, C3, CZ, C4, P3, PZ, P4) and illustrates EEG plots for the one correct and two incorrect conditions per stress type. Grand averages start with the onset of the critical word and end after 1500 ms, with a pre-stimulus baseline of 200 ms. As mentioned above, the time of the appearance of violation effects depends on the position of incorrect word stress. We therefore calculated the effect sizes in terms of mean voltage in different time windows (see §2.1.4). It should be mentioned that ERPs were measured from the onset of the stimulus and not from the onset of each incorrectly stressed syllable, because we wanted to compare the time courses of ERP components obtained in the same words with different stress patterns. Since stress is a relational property, stress shifts affect the whole phonological word and not only the incorrectly stressed syllable. We therefore assume that a stress mismatch can only be judged on the basis of a sequence of at least two syllables, where, for instance, a strong-weak sequence is expected and a weak-strong sequence encountered.
Experiment 1: grand averages of event-related brain potentials (ERPs) obtained for words with antepenultimate stress. The correct condition (ˈAnanas; solid line) is plotted against the incorrect conditions with penultimate stress (*Anˈanas; dashed line) and final stress (*Anaˈnas; dotted line). The boxes indicate the time windows that were used for statistical comparisons between correct and incorrect conditions: the darker shaded box illustrates the time window in which a negativity effect for both violation types was obtained and the lighter box the time window in which a positivity effect for violations with penultimate stress was found. By convention, negativity is plotted upwards. The x-axis depicts time from critical stimulus onset (indicated by the vertical bar), while the y-axis depicts amplitude in microvolts.

In global statistical analyses, the factor Stress Position was significant for each word type, indicating that the processing of incorrect conditions differs from the processing of the correct condition. Since it is the comparisons of each incorrect form with the respective correct form that are relevant for our question, the following results focus on such comparisons.
2.2.2.1 Words with correct antepenultimate stress
For words such as ˈAnanas, we found two effects related to stress violations: a negativity effect which was more pronounced for violations with final stress than for violations with penultimate stress, and a positivity effect for violations with penultimate stress (see Fig. 1). Statistical analyses of mean voltage changes in the time window from 400 to 950 ms revealed a significant negativity effect for violations with final stress (F(1, 23)=8·276, p<0·01), and in the time window from 420 to 800 ms a negativity effect for violations with penultimate stress (F(1, 23)=5·875, p<0·025). A further comparison of mean voltage differences of correct and incorrect conditions occurring between 800 and 1150 ms post onset showed that errors with penultimate stress (*Aˈnanas) produced a pronounced positivity effect (F(1, 23)=8·303, p<0·009). Incorrect forms with final stress (*Anaˈnas), in contrast, did not differ from the correct condition (F(1, 23)<1).
2.2.2.2 Words with correct penultimate stress
In words with correct penultimate stress (Biˈkini), the effects induced by the incorrect conditions split up into two subsequent time windows (see Fig. 2): (i) a positivity effect for incorrect forms with initial stress (*ˈBikini) occurred between 600 and 1000 ms (F(1, 23)=9·790, p<0·006), (ii) a positivity effect for finally stressed incorrect forms (*Bikiˈni) between 900 and 1400 ms (F(1, 23)=31·266, p<0·001). Note that we observed not only a positivity effect, but also a negativity effect in each time window, which appeared to be complementary to the positivity effect: violations with final stress produced a negativity effect within the early time window (F(1, 23)=12·068, p<0·003), and violations with antepenultimate stress within the second time window (F(1, 23)=33·925, p<0·001).
Experiment 1: grand averages of event-related brain potentials (ERPs) obtained for words with penultimate stress. The correct condition (Biˈkini; solid line) is plotted against the incorrect conditions with antepenultimate stress (*ˈBikini; dashed line) and final stress (*Bikiˈni; dotted line). The darker shaded box indicates the time window in which violations with antepenultimate stress yielded a positivity effect and violations with final stress a negativity effect, and the lighter box the time window in which a positivity effect induced by violations with final stress occurred.

2.2.2.3 Words with correct final stress
In words with correct final stress (Vitaˈmin), both violation types induced ERP effects (see Fig. 3): violations with antepenultimate stress caused a reduced positivity effect (F(1, 23)=7·912, p<0·011) between 500 and 760 ms post onset and violations with penultimate stress a reduced negativity effect (F(1, 23)=6·239, p<0·021) between 500 and 760 ms and a pronounced positive deflection (F(1, 23)=35·310, p<0·001) between 900 and 1200 ms. Thus violations with penultimate stress evoked an enhanced amplitude difference compared to violations with antepenultimate stress.
Experiment 1: grand averages of event-related brain potentials (ERPs) obtained for words with final stress. The correct condition (Vitaˈmin; solid line) is plotted against the incorrect conditions with antepenultimate stress (*ˈVitamin; dashed line) and penultimate stress (*Viˈtamin; dotted line). The darker shaded box illustrates the latency of the positivity effect evoked by violations with antepenultimate stress and the negativity effect by violations with penultimate stress, and the lighter box shows the latency of the positivity effect evoked by penultimate stress.

2.3 Discussion
The main finding of the present experiment is that the matching of an expected stress pattern with a deviant stress pattern evokes an enhanced late positivity effect. Since this effect occurred in nearly all instances of incorrect stress assignment, we argue that it reflects a brain response to the detection of a prosodic mismatch. Recall that the participants' task was to compare a mentally activated stress pattern with the stress pattern actually heard (see the literature on silent reading, e.g. Bader Reference Bader1996, Steinhauer & Friederici Reference Steinhauer and Friederici2001, Fodor Reference Fodor2002, Stolterfoht et al. Reference Stolterfoht, Friederici, Alter and Steube2007).
We interpret the late positivity effects as instances of P300 effects, which have been reported from other cognitive domains and which are known to reflect stimulus probability, saliency and task relevance (e.g. Picton Reference Picton1992, Coulson et al. Reference Coulson, King and Kutas1998a, Reference Coulson, King and Kutasb). According to Coulson et al. (Reference Coulson, King and Kutas1998a), the P300 is an appropriate dependent variable to test the saliency and/or the complexity of a given manipulation, because the amplitude and the latency of the effect increase with the degree of anomaly. Thus, the distribution of the P300 effects observed here is informative with respect to the underlying cognitive process involved. As Figs 1–3 and the statistical analyses show, we did not obtain an enhanced positivity effect for each violation. In words that are correctly stressed on the antepenultimate syllable, a positivity effect was found only for violations with penultimate stress (e.g. *Aˈnanas), but not for violations with final stress (e.g. *Anaˈnas). Similarly, words with correct final stress show this effect for violations induced by penultimate stress (e.g. *Viˈtamin), whereas violations with antepenultimate stress (e.g. *ˈVitamin) produced no such pronounced positivity effect. In contrast, violations for words with correct penultimate stress produced a pronounced positivity effect in each violation condition (e.g. *ˈBikini and *Bikiˈni). These different results do not occur randomly, but depend on the type of target stress pattern and the respective underlying prosodic structure. Crucially, we interpret the strength of the P300 effect as a function of the degree of deviation from the target pattern. In cases in which the stress shift involves a restructuring of feet, we find stronger effects than in cases where the stress shift does not require a change in foot structure.
In the introductory section we outlined the assumption that different stress patterns correspond to distinct foot structures (see Table II). For instance, trisyllabic words with penultimate stress end in a final trochee (Biw(kisniw)), whereas words with antepenultimate or final stress end in a monosyllabic foot which is preceded by a trochee ((Asnaw)(nass) or (Vistaw)(mins)). In the latter case, there are two feet with a strong syllable in each foot. Hence, words with antepenultimate and final stress share a similar prosodic structure, whereas words with penultimate stress have different structural properties (see also Table I). This brings us back to the controversies in the metrical analysis of prosodic structures in German outlined in §§1.1–2. The patterning of effects is in line with the structure proposed in Table II. Note that we would expect to find violation effects for final stress in words with canonical antepenultimate stress if the final syllable was extrametrical. In such a case, the foot structure would have changed from (σsσ)<σ> to (σσ)(σs). Ternary structures of words with canonical antepenultimate stress can be excluded as well. In a ternary structure, the weak syllable of a foot would become the strong syllable of a non-branching foot (e.g. (σsσσ) would change to (σσ)(σs)). Therefore, we interpret our findings as a first piece of evidence against the assumption of extrametricality (e.g. Féry Reference Féry1998) or ternary feet (e.g. Halle & Vergnaud Reference Halle and Vergnaud1987, Burzio Reference Burzio1994).
Since the foot structures of words with antepenultimate and final stress are identical, the shift from antepenultimate stress to final stress or vice versa does not require a restructuring of prosodic units. However, a shift from penultimate stress to final or antepenultimate stress or vice versa generally requires a reorganisation of the mapping between syllables and feet. We take this structural difference to be the explanation for the patterning of EEG effects. According to this interpretation, only violations demanding a restructuring of the foot structure produce a P300.
An alternative explanation for the patterning of ERP effects would be to assume that incorrect forms, which do not require a restructuring of metrical entities, are not perceived as violations at all. If this were true, there should have been higher error rates for such incorrect forms in the behavioural data, which was clearly not the case. Rather, our participants correctly rejected most of the violations, even those that did not produce a positivity effect (see Table IV). In summary, although stimuli like *Anaˈnas and *ˈVitamin were rejected as lexical forms, the electrophysiological responses did not deviate from those for correct forms. With respect to metrical structure, our findings strongly suggest that the prosodic representation of a word includes a hierarchical structure of strong and weak syllables and strong and weak feet within a prosodic word (e.g. (viσs.taσw)Ftw(minσs)Fts).
With respect to the negative deflection observed for violations of words correctly stressed on the antepenultimate or penultimate syllable, we argue that this effect belongs to the CNV family (contingent negative variation; Walter et al. Reference Walter, Cooper, Aldridge, McCallum and Winter1964, Rugg Reference Rugg1984, Grossi et al. Reference Grossi, Coch, Coffey-Corina, Holcomb and Neville2001), which is elicited before the appearance of an expected stimulus, in our case a strong syllable. In earlier studies, CNV was found in the contexts requiring an increased memory load, for instance when phonological information had to be retained in working memory to perform a specific task. Assuming that participants internally activated the phonological form of a visually presented stimulus to match the expected prosodic pattern with the presented one, they possibly kept the prosodic information – activated by the visual input – in working memory while they encountered a stressed syllable in the auditory input. Since such a negativity effect was observed mainly in instances where an initial strong syllable was replaced by a weak one, we suggest that the absence of an initial strong syllable causes the respective phonological information to be retained in working memory until a strong syllable is encountered. In cases with incorrect initial stress (e.g. *ˈVitamin), no negativity effect was observed. Thus we hypothesise that a negativity effect of this sort indirectly mirrors the detection of pitch contour deviations in cases where a de-stressed initial syllable does not provide sufficient information to reject a wrongly stressed word. This is in accordance with the stress-based model proposed by Grosjean & Gee (Reference Grosjean and Gee1987), which predicts that a word is accessed through the perception of a stressed syllable.
In a second experiment, we tested whether the observed positivity effect of target mismatch is also sensitive to the influence of syllable structure on the construction of prosodic structure. To this end, brain responses to stress violations in words with varying structure of the final syllable were analysed.
3 Experiment 2
In order to test whether target-related effects observed for stress violations also vary according to the type of rhyme structure of the final syllable, we contrasted words of the form (ˈA.na)(nas) ((σsσw)(σs)) with words of the type (ˈA.li)(bi) ((σsσw)(σs)). Pseudo-word experiments with German native speakers and a corpus analysis of existing trisyllabic German nouns (Janßen Reference Janßen [Domahs]2003) showed that in words with a closed final syllable initial stress was produced in 47% (pseudo-word experiment)/68% (corpus analysis) of cases and in words with an open final syllable only in 17%/32%. From this observation we hypothesise that the violation effects are different for these two types of words. We tested whether participants perceive stress violations not only in relation to the target stress position, but also in relation to the stress position predicted by the syllable structure of a word. Although a word like *Aˈlibi is perceived as an incorrect form, it is structurally similar to the frequent correct form Biˈkini. Such a structural similarity may have an influence on the reanalysis of incorrect prosodic structures. For violations with final stress we predict the opposite influence of syllable structure on stress assignment: violation effects for *Aliˈbi should be more pronounced than for *Anaˈnas if the language-processor is sensitive to the structural preferences for words with final stress. While final stress is rather exceptional in words with an open final syllable, this is not the case if the final syllable is closed. Again, electrophysiological effects may be sensitive to a preferred or dispreferred correlation between syllable structure and stress position. Alternatively, both types of final syllables are heavy and have identical structures, as proposed in Table II. Some authors have argued (e.g. Giegerich Reference Giegerich1985) that open syllables in German consist of long vowels, which would support the assumption that open syllables are heavy. The problem with this suggestion is that open syllables seem to be long only if they are stressed (Wiese Reference Wiese1996, Jessen Reference Jessen1999). Thus it is hard to decide whether a syllable is stressed due to vowel length or whether a vowel is lengthened because of stress. Generally, the length contrast between vowels is confounded with the distinction between tense and lax vowels, which are by and large in complementary distribution: tense vowels occur in open and lax vowels in closed syllables. It is beyond the scope of the present paper to solve this long-standing debate; however, our data might be able to provide an answer to the question of whether open final syllables are heavy and form non-branching feet.
3.1 Method
3.1.1 Participants
Twenty-four right-handed native speakers of German (thirteen women, eleven men) with normal or corrected-to-normal vision and without hearing deficits participated in our experiment. Their mean age was 23 (ranging from 19 to 34). None of the participants took part in the preceding experiment.
3.1.2 Material
The correct stimuli with antepenultimate stress and the incorrect stimuli with penultimate and final stress were identical to the stimuli used in Experiment 1. However, stimuli were divided into two groups of words according to the structure of the final syllable: (i) fifteen words with a closed final syllable (ˈAnanas, *Aˈnanas, *Anaˈnas) and (ii) fifteen words with an open final syllable (ˈAlibi, *Aˈlibi, *Aliˈbi). Each word was presented twice in order to increase the number of critical items. Both word groups were controlled for mean word frequency according to CELEX (closed final syllable: 4·5 per million; open final syllable: 5·2 per million), F0, intensity and syllable duration (for statistical comparisons see Appendix D).Footnote 6
To balance the occurrence of correct and incorrect stress patterns, 30 filler items were added: fifteen words that were correctly stressed either on the penultimate or final syllable and a further fifteen which were incorrectly stressed on the antepenultimate syllable. As with the experimental items, each filler item was presented twice.
3.1.3 Procedure
The procedure was identical to the one outlined in the method section of Experiment 1.
3.1.4 EEG-recording and data analysis
The technical set-up was identical to the one used in Experiment 1. Trials with eye-movement artefacts and incorrect responses were removed prior to data averaging (approximately 5·8% of trials).
The two violation types were analysed separately for a negativity and a positivity effect. A visual inspection revealed a negativity effect for both violation types and a positivity effect only for violations with penultimate stress. For measurements of mean voltage, three time windows were chosen: (i) from 400 to 1050 ms for the negativity effect observed for violations with final stress, (ii) from 500 to 800 ms for the negativity in words with penultimate stress and (iii) from 840 to 1250 ms for the analysis of the positivity effect (see Table III for an overview of statistical analyses).
3.1 Results
3.2.1 Behavioural data
Accuracy scores revealed that responses to violations with penultimate stress were more accurate for words with a closed final syllable (97%) compared to words with an open final syllable (93%), whereas the accuracy for violations with final stress were less error-prone in words with an open final syllable (84%) than in words with a closed final syllable (68%). Accuracy for correctly stressed words with a closed final syllable was 98% and for words with an open final syllable 97%.
As the present study aimed to find differences for each violation type as a function of the structure of the final syllable, error rates were compared between the correct conditions and each violation type in a 2×2 design (Word Type: words with closed and open final syllables, and Correctness: correct and incorrect stress).
For a comparison of error rates of correctly stressed antepenultimate words and ill-stressed words with penultimate stress, an ANOVA revealed a main effect for the factor Word Type (F(1, 23)=6·086, p<0·023), but not for the factor Correctness (F(1, 23)=2·857, p>0·104), and no interaction of the two factors (F(1, 23)=2·338, p>0·14). Thus words with an open final syllable were judged less accurately than words with a closed final syllable, irrespective of the correctness of the words. This difference indicates that ˈAlibi-words are more marked than ˈAnanas-words.
In a comparison of error rates of correctly stressed antepenultimate words and incorrect words with final stress, we obtained main effects for the factors Word Type (F(1, 23)=26·341, p<0·001) and Correctness (F(1, 23)=24·368, p<0·001), and for an interaction of the two factors (F(1, 23)=46·672, p<0·001). The obtained effects are due to higher error rates for incorrectly stressed words like *Anaˈnas (32%) compared to words like *Aliˈbi (16%) and correctly stressed words (2% and 3%). This difference reflects the observation that words with a final heavy syllable are frequently stressed on the final syllable, in contrast to words with an open final syllable. Obviously, a frequent (‘unmarked’) pattern is harder to reject if it appears as stress violation than an infrequent (‘marked’) pattern.
3.2.2 ERP data
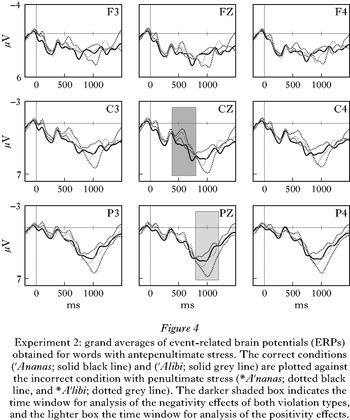
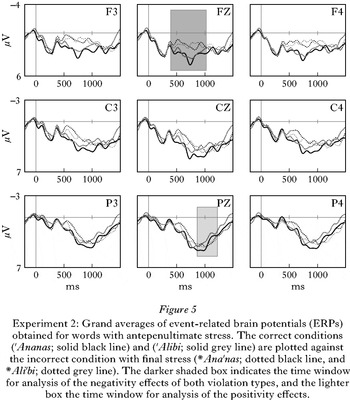
Figures 4 and 5 depict grand average ERPs for the two word groups with antepenultimate stress (ˈAnanas and ˈAlibi) with either a penultimate violation or final stress violation. Since the aim of our analysis was to investigate the influence of syllable structure on the processing of stress violations, we examined differences in effect size for each type of violation separately.
Experiment 2: grand averages of event-related brain potentials (ERPs) obtained for words with antepenultimate stress. The correct conditions (ˈAnanas; solid black line) and (ˈAlibi; solid grey line) are plotted against the incorrect condition with penultimate stress (*Aˈnanas; dotted black line, and *Aˈlibi; dotted grey line). The darker shaded box indicates the time window for analysis of the negativity effects of both violation types, and the lighter box the time window for analysis of the positivity effects.

Experiment 2: Grand averages of event-related brain potentials (ERPs) obtained for words with antepenultimate stress. The correct conditions (ˈAnanas; solid black line) and (ˈAlibi; solid grey line) are plotted against the incorrect condition with final stress (*Anaˈnas; dotted black line, and *Aliˈbi; dotted grey line). The darker shaded box indicates the time window for analysis of the negativity effects of both violation types, and the lighter box the time window for analysis of the positivity effects.

Figure 4 illustrates changes in mean voltage for violations with penultimate stress in words with either closed or open final syllables, and Fig. 5 the same contrast for violations with final stress. Statistical analyses of the negative deflections were applied to the 500 to 800 ms time window for violations with penultimate stress and to the 400 to 1050 ms window for violations with final stress. For the positive deflection, a time window from 840 to 1250 ms was chosen for both violation conditions. The factor Correctness (correct vs. incorrect stress pattern) was analysed for each violation pattern and word type separately.
3.2.2.1 Violations with penultimate stress
Figure 4 shows that violations with penultimate stress produced a biphasic component of the type already observed in Experiment 1: a negativity effect between 500 and 800 ms and a positivity effect between 840 and 1250 ms. However, the amplitude size was different in the two groups of words with antepenultimate target stress. The effects observed in words like Ananas were more pronounced than the effects observed in words like Alibi. A statistical analysis of the time window from 500 to 800 ms revealed a significant negativity effect for the factor Correctness in words with a closed final syllable (F(1, 23)=6·548, p<0·019), but not in words with an open final syllable (F(1, 23)<1). With regard to the positivity effect, violations with penultimate stress produced a main effect for the factor Correctness in words with a closed final syllable (F(1, 23)=12·079, p<0·003), but not in words with an open final syllable (F(1, 23)=1·782, p>0·194).
3.2.2.2 Violations with final stress
Figure 5 demonstrates that violations with final stress produced an extended negativity effect between 400 and 1050 ms, but no positivity effect. Analyses according to the factor Correctness for each word type revealed that violations of words containing a closed final syllable evoked a significant broad negative deflection (F(1, 23)=10·912, p<0·004), whereas violations for words with an open final syllable displayed this effect only over frontal regions (across all electrode sites: Correctness: F(1, 23)=2·253, p>0·147 ns; interaction of the factors Correctness×Region: F(2, 46)=7·249, p<0·011; Correctness over frontal electrode sites: F(1, 23)=6·982, p<0·0016). As with the positivity effect found for violations with penultimate stress, we calculated statistics within a time window from 840 to 1250 ms and did not obtain a significant result either for words with a closed final syllable (Correctness: F(1, 23)=1·97, p>0·17) or for words with an open final syllable (Correctness: F(1, 23)<1). Thus, Experiment 2 replicated the findings of Experiment 1: violations with final stress evoked a negative component, but no positivity effect in the context of words correctly stressed on the antepenultimate position.
3.3 Discussion
In the second experiment, the perception of violations of words with correct antepenultimate stress was examined. Violations of words with a closed final syllable were compared to violations of words with an open final syllable. We obtained different results for violations realised with penultimate stress compared to final stress.
Violations with penultimate stress produced stronger electrophysiological effects in words with a closed final syllable (*Aˈnanas) than in words with an open final syllable (*Aˈlibi). Only in the former case were negative and positive shifts deviating significantly from the correct condition found. The violation with penultimate stress in words with an open final syllable evoked no significant ERP effect. These gradual effects are in accordance with the observation that existing trisyllabic words ending in -VC(C) (V=full vowel) are less frequently stressed on the penultimate syllable in comparison to words ending in -V, which predominantly occur with penultimate stress in the corpus analysis reported in Janßen (Reference Janßen [Domahs]2003). Thus the ERP effects found correlate with the distribution of stress patterns in actual words with different syllable structure. Obviously, the occurrence of ERP components reflects the probability of a particular stress pattern in a word with a specific segmental make-up.
As far as violations with final stress are concerned, we found a broadly distributed negativity effect for words with a closed final syllable and a frontal negativity for words with an open final syllable – both are possibly instances of contingent negative variation. As stated in the discussion section of Experiment 1, such a component seems to correlate with a delay in the evaluation process due to the detection of a de-stressed initial syllable.
Interestingly, final stress did not induce a P300, indicating a reanalysis of metrical structure. The lack of a positivity effect does not support the prediction that final stress in words with an open final syllable is dispreferred in contrast to final stress in words with a closed final syllable. If this were the case, we should have observed a P300 for the first type of words, but not for the latter one. One explanation for the absence of a positive component is that both types of words exhibit the structure (σsσw)(σs). Thus final stressed syllables are in the strong position of a foot, irrespective of whether the syllable is open or closed. It seems as though the language processor is not sensitive to detecting differences between stressed final syllables containing closed and open rhymes. Interestingly, violations with final stress in words with penultimate stress like Biˈkini, with a syllable structure comparable to ˈAlibi, evoked a much stronger electrophysiological effect than in words with antepenultimate stress (compare Figs 2 and 5). We take this difference as evidence not only for the assumption that the structural make-up of a word is decisive for the processing of stress, but also for the postulated prominence relation between the correct and incorrect stress positions: stress shift to a non-head syllable requires a restructuring of feet, whereas stress shift to a head syllable does not.
Alternatively, according to the traditional concept of quantity-sensitivity (e.g. Hayes Reference Hayes1995), -VC and -VV are equally heavy (bimoraic in terms of a mora-counting system). However, it was argued above that open syllables in German are not heavy. The lack of a violation effect thus indicates that the final syllable of words with antepenultimate stress forms a non-branching foot, i.e. is strong/heavy by position. We suggest that in contrast to closed syllables, open syllables with long vowels are not heavy per se, but that their parsing as non-branching feet depends on the main stress position. Thus, we argue that words of the type (A.li.)(bi) are somehow specified for a final non-branching foot.Footnote 7 In this respect it is instructive that in the behavioural data words like *Aliˈbi were rejected as incorrect more accurately than words like *Anaˈnas, reflecting the different status of the two word types (see §3.2.1).
We interpret the dissociation found for violations with penultimate stress as indicating that the language processor makes use of knowledge about prosodic structure, which is determined by the type of syllable structure relevant for the parsing of syllables into feet. It should be emphasised here that the graded ERP effects observed cannot be attributed to differences in phonetic parameters, since the phonetic values appeared to be highly similar in both words groups. Instead, the activation patterns observed are in accordance with our hypothesis that prosodic structures depend on structural properties of the final syllable.
4 General discussion
In the present paper, we have reported results from two ERP experiments on the processing of main stress in German words. The aim of the studies was to investigate whether there are electrophysiological correlates to hierarchies among syllables or feet. Furthermore, the results are capable of shedding further light on the question of how the language processor uses information about the prosodic structure of words, at least for German.
Stress violations generally induced a centro-parietal positivity effect, the latency of which depended mainly on the position of the incorrectly stressed syllable: violations with antepenultimate stress evoked earlier effects than violations with penultimate or final stress. It is the position of an incorrectly stressed syllable rather than the position of a de-stressed syllable that determines the point at which participants detect a stress violation. The patterning of ERP effects suggests that initial de-stressing leads to a CNV, whereas initial incorrect stress engenders a positivity that is earlier in latency than positivities occurring with incorrect stress on later positions. However, the positivity appearing with incorrect initial stress is time-locked not just to the perception of the first syllable, but also to the processing of information from the second syllable. The time course of effects therefore emphasises the relational property of stress.
The positivity effect observed for incorrect conditions was interpreted as reflecting the evaluation of a prosodic mismatch between expected and encountered stress patterns. However, the positivity effect did not occur for each stress violation (see Figs 1 and 3): incorrect final stress in words correctly stressed on the antepenultimate position and vice versa did not produce such an effect.
As already noted in the discussion of Experiment 1, we interpret the observed patterns as demonstrating that the type of prosodic hierarchy plays an important role in stress-error detection. Assuming that trisyllabic words with penultimate stress consist of one metrical foot (a final trochee), while words with antepenultimate and final stress consist of two feet (a trochee and a monosyllabic foot), we suggest that a positivity effect occurs in those cases in which the metrical structure of a violation condition leads to a re-parsing of syllables into feet (e.g. when (vi.ta)(ˈmin) turns into *vi.(ˈta.min) and bi.(ˈki.ni) turns into *(bi.ki)(ˈni)). Thus, the observed positivity effect reflects a reanalysis process rather than a mere evaluation process concerning the correctness of the presented stress patterns. Overall, the patterning of effects confirms the foot-structure analysis proposed in Table II. The most controversial structure was the one suggested for words with antepenultimate stress, as an alternative analysis assumes an extrametrical final syllable (e.g. by rule (Féry Reference Féry1998) or by introducing an extrametricality marker (Wiese Reference Wiese1996)). We can rule out another analysis, one involving ternary foot structures in words with antepenultimate stress, as in this analysis violation effects for incorrect words with final stress (e.g. *Lexiˈkon) should have been found as well.
In the second experiment, we found even more fine-grained violation effects, depending on internal syllable structure. Violations with penultimate stress produced an enhanced positivity effect in words with a closed final syllable, compared to words with an open final syllable. This dissociation confirms the assumption that the distribution of word stress is determined by the structure of the final syllable (Janßen Reference Janßen [Domahs]2003). Violations with final stress, however, did not produce any differential effects in correlation with the structure of the final syllable. We take this result as evidence for the assumption that a final syllable is strong in words with antepenultimate stress irrespective of its structure.
A crucial question concerning our findings is whether the positivity effect reflects a cognitive process that is specific to prosodic processing, or whether it is an expression of a more general reanalysis process of complex structures. As mentioned in §2.3, we assume that it is an instance of the P300 family (e.g. Verleger Reference Verleger1988, Picton Reference Picton1992), which reflects general task relevant match–mismatch processing. Accordingly, the occurrence of the P300 component is correlated with a target mismatch that occurs if the stress pattern of the present item does not fit the previously generated expectation. Moreover, this component reflects the saliency of the target mismatch as a function of structural deviation. Stress shifts involving a restructuring of prosodic structure are more salient than stress shifts from one prosodic head to another. Hence, the P300 seems to be a reliable dependent variable to test the complexity of prosodic manipulations. Furthermore, the peak latencies of P300 effects for different stress violations suggest that this response is related to the perception of a wrongly stressed strong syllable: effects for incorrect antepenultimate stress occur earlier than for incorrect penultimate or final stress. However, in the case of initial wrongly stressed forms the evaluation process seems to require suprasegmental information of at least two syllables reflecting the relational property of stress.
The results from the two experiments support linguistic accounts of metrical representations which assume a hierarchical layering of syllables and feet within prosodic words, as described in prosodic phonology. In particular, it has been shown that the position of a syllable within a word determines its stressability.
5 Conclusion
From the perspective of language processing, our findings suggest that German word stress relies not only on the distinction between default stress and lexically specified stress, but also on the structural properties of a word determining its foot structure. This in turn leads to a particular stress pattern. Thus different stress positions in German derive from the way in which syllables are parsed into feet: words with an open final syllable tend to be stressed on the penultimate syllable, while words with a closed final syllable are stressed either on the antepenultimate or final syllable.
The findings contribute to the question of how prosodic information is processed in the brain, and what type of information is used for the prosodic analysis of speech. Stress violations in stress-evaluation experiments produce a positivity effect indicating a target-mismatch process, which reflects different degrees of prosodic reanalysis. However, stress errors do not induce positivity effects per se. Rather, such effects are only observed for those stress errors that require a restructuring of syllables into feet. Additionally, the language-processing system is sensitive to the prosodic structure not only in terms of metrical feet, but also in terms of syllable structure. This could be demonstrated at least for the structure of the final syllable, which seems to play a decisive role in the formation of metrical structure. In this respect, our results shed further light on the correct metrical analysis of German words. Thus our experiments provide evidence that the processing of word stress depends not only on word-specific lexical information about stress position, but also on more abstract (quantity-sensitive) information about metrical structure, such as the hierarchical ordering of syllables and feet.
Appendix A
Schematic depiction of the set-up of an ERP experiment on language processing (adapted from Coles & Rugg 1995). The ongoing EEG is recorded while participants read or listen to linguistic stimuli. Critical stimulus-related activity is isolated from the background electrical activity of the brain by means of an averaging procedure, which applies to a set of stimuli of the same type. The resulting event-related brain potential, which is shown in the bottom righthand corner of the figure, consists of a series of negative and positive potential changes. By convention, negativity is plotted upwards. The x-axis depicts time from critical stimulus onset (which occurs at the vertical bar), while the y-axis depicts voltage. ERP components are typically named according to their polarity (N for negativity vs. P for positivity) and latency (an N400, for example, is a negativity with a peak latency of approximately 400 ms relative to critical stimulus onset). ERP comparisons are always relative, meaning that negativities or positivities in a critical condition can only be interpreted relative to a control condition and not in absolute terms (i.e. relative to the zero line).

Appendix B
List of items and mean frequency (number of occurrences per million words, according to the CELEX database).
Appendix C
Mean values of the phonetic parameters fundamental frequency (F0; range over syllables in Hz), intensity (in db) and syllable duration (in ms) for each stress pattern in one correct (shaded) and two incorrect conditions. For example, in the first row mean values are given for words stressed on the antepenultimate syllable, e.g. ˈAnanas, *ˈBikini and *ˈVitamin. The rightmost column gives results of a statistical comparison for the three conditions of this row.
Appendix D
Mean values of the phonetic parameters fundamental frequency, intensity and syllable duration for the two word groups with either closed (ˈAnanas) or open final syllable (ˈAlibi). Correct conditions are shaded. Statistical analyses compared values of phonetic parameters of both word groups.