Introduction
There is a robust positive association between average IQ and socioeconomic development across countries (Jones & Schneider, Reference Jones and Schneider2006; Wicherts et al., Reference Wicherts, Borsboom and Dolan2010a; Meisenberg & Lynn, Reference Meisenberg and Lynn2011; Rindermann & Thompson, Reference Rindermann and Thompson2011; Rindermann, Reference Rindermann2012; Lynn & Vanhanen, Reference Lynn and Vanhanen2012a, Reference Lynn and Vanhanenb). Growing evidence indicates that the association between average IQ and socioeconomic development also holds within countries. Cross-regional correlations between average IQ and indicators of socioeconomic development have been documented for the UK (Lynn, Reference Lynn1979); France (Lynn, Reference Lynn1980); Italy (Lynn, Reference Lynn2010; Templer, Reference Templer2012; Piffer & Lynn, Reference Piffer and Lynn2014; but see Beraldo, Reference Beraldo2010; Cornoldi et al., Reference Cornoldi, Belacchi, Giofrè, Martini and Tressoldi2010, Reference Cornoldi, Giofrè and Martini2013; Daniele & Malanima, Reference Daniele and Malanima2011; Felice & Giugliano, Reference Felice and Giugliano2011; D’Amico et al., Reference D’Amico, Cardaci, Di Nuovo and Naglieri2012; Daniele, Reference Daniele2015); Portugal (Almeida et al., Reference Almeida, Lemos and Lynn2011); Spain (Lynn, Reference Lynn2012); Germany (Roivanien, Reference Roivaninen2012); Finland (Dutton & Lynn, Reference Dutton and Lynn2014); Japan (Kura, Reference Kura2013); China (Lynn & Cheng, Reference Lynn and Cheng2013); India (Lynn & Yadav, Reference Lynn and Yadav2015); and the US (McDaniel, Reference McDaniel2006; Pesta et al., Reference Pesta, McDaniel and Bertsch2010; Barnes et al., Reference Barnes, Beaver and Boutwell2013; Boutwell et al., Reference Boutwell, Franklin, Barnes, Beaver, Deaton, Lewis, Tamplin and Petkovsek2013).
It is important to note that several of these studies unearthed quite weak associations. For example, Roivainen (Reference Roivaninen2012) documented a correlation of only r=0.14 between PISA scores and GDP per capita across the regions of Germany for 2006. Nevertheless, in the context of a lively debate over the direction of causality between average IQ and socioeconomic development (Wicherts et al., Reference Wicherts, Borsboom and Dolan2010a, Reference Wicherts, Borsboom and Dolanb; Eppig et al., Reference Eppig, Fincher and Thornhill2010, Reference Eppig, Fincher and Thornhill2011; Rindermann et al., Reference Rindermann, Woodley and Stratford2012; Lynn & Vanhanen, Reference Lynn and Vanhanen2012a; Sternberg, Reference Sternberg2013; Daniele, Reference Daniele2013; Carl, Reference Carl2014; Woodley et al., Reference Woodley, Rindermann, Bell, Stratford and Piffer2014), cross-regional associations arguably constitute stronger evidence for a causal role of IQ than cross-national associations because, unlike countries, regions are subject to broadly similar laws, institutions and geographical conditions.
To the author’s knowledge, Lynn (Reference Lynn1979) is the only previous study to have investigated the association between average IQ and socioeconomic development across regions of the UK. He compiled data collected in the 1940s and 1950s from several different sources, and calculated average IQ for thirteen regions of the British Isles (twelve regions of the UK, plus the Republic of Ireland). Regional IQ was found to be positively associated with first class degrees per capita, Royal Society fellows per capita, income per capita, urbanization and crimes per capita. It was found to be negatively associated with unemployment and infant mortality. Lynn (Reference Lynn1979) attributed the positive association between regional IQ and crimes per capita to the greater urbanization of higher-IQ regions; in fact, when urbanization was partialled out, the correlation fell to zero.
This study repeats Lynn’s (Reference Lynn1979) analysis, using more recent data on both IQ and socioeconomic development. It begins by describing the data, along with the statistical methodology. It then considers the correlation between the new estimates of regional IQ and those assembled by Lynn (Reference Lynn1979). In an attempt to provide evidence for the validity of the regional IQs, it examines whether IQ estimates for UK nations (England, Scotland, Wales and Northern Ireland) derived from the same data are correlated with national PISA scores. Finally, it explores the extent to which regional IQ is associated with indicators of socioeconomic development, such as income, poverty and technological accomplishment.
Methods
Data
Estimates of average IQ were calculated using data from wave 3 of Understanding Society, also known as the UK Household Longitudinal Study (University of Essex, 2013). These data were collected between January 2011 and April 2013, almost entirely via face-to-face interviews. Initially, an IQ variable was obtained by extracting the first principal component from a Principal Components Analysis (PCA) on six separate measures of cognitive ability (Spearman, Reference Spearman1904): immediate word recall, delayed word recall, serial subtraction, number series, verbal fluency and numeracy. This component explained 46% of the variance across the six measures.
Immediate word recall required respondents to repeat back as many words as possible from a list of ten that were read out by a computer. Delayed word recall required respondents to again repeat back as many of the ten words as possible, but this time after a short delay. Serial subtraction required respondents to subtract 7 from 100, and then keep subtracting 7 from the answer, for a total of five subtractions. Number series required respondents to identify the missing number from each of six sequences; the final three sequences differed depending on the respondent’s performance in the initial three. Verbal fluency required respondents to name as many animals as possible in one minute. Numeracy required respondents to solve up to five short mathematical problems; the final two problems differed depending on the respondent’s performance in the initial three. For further details, see McFall (Reference McFall2013).
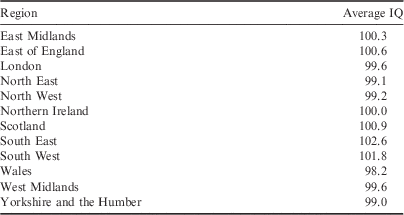
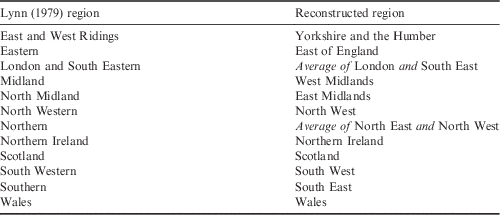
Next, average IQ was calculated for each of the twelve UK regions: East Midlands, East of England, London, North East, North West, Northern Ireland, Scotland, South East, South West, Wales, West Midlands, and Yorkshire and the Humber (see Table 1). Note that these regions do not map perfectly onto the ones used by Lynn (Reference Lynn1979), who exploited a slightly older classification scheme: East and West Ridings, Eastern, London and South Eastern, Midland, North Midland, North Western, Northern, Northern Ireland, Scotland, South Western, Southern and Wales (see his Fig. 1). Consequently, for the comparison between the two sets of estimates, Lynn’s (Reference Lynn1979) regions were reconstructed via the mapping outlined in Table 2. The reconstructed regions do not map perfectly onto Lynn’s (Reference Lynn1979) regions either, but they arguably provide a reasonable approximation. Cross-sectional sampling weights were applied when calculating regional IQs in order to attain representativeness (see Knies, Reference Knies2014).
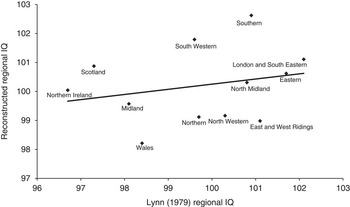
Scatterplot of reconstructed regional IQ against Lynn (Reference Lynn1979) regional IQ for twelve UK regions.

IQ estimates for the twelve regions of the UK

The correlation between regional IQ and latitude is small and negative, namely r=−0.27.
Mapping of current UK regions onto Lynn’s (Reference Lynn1979) regions

Only the following six reconstructed regions map identically onto Lynn’s (Reference Lynn1979) regions: Eastern, Midland, Northern Ireland, Scotland, South Western and Wales.
It is worth mentioning that regional variation in IQ appears to be lower within the UK than within some other countries that have been studied, such as Italy, Spain and the US (McDaniel, Reference McDaniel2006; Lynn, Reference Lynn2012; Piffer & Lynn, Reference Piffer and Lynn2014). For example, US states reportedly differ in average IQ by more than 10 IQ points (McDaniel, Reference McDaniel2006), whereas the range in the present dataset is less than 5 IQ points. Having said that, the spatial units into which one country happens to have been divided are not necessarily comparable to those into which any other country happens to have been divided. Disparities in average IQ within the UK might prove to be greater at finer levels of disaggregation.
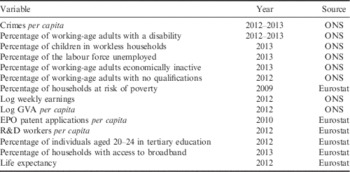
IQ estimates for UK nations (England, Scotland, Wales and Northern Ireland) were derived from the same data as the regional IQs. In particular, the regional IQs for Scotland, Wales and Northern Ireland were utilized, along with the average IQ for England as a whole. National PISA scores were obtained from the 2012 tests by averaging across the three components (mathematics, reading and science) within each nation (OECD, 2014). Fourteen separate measures of socioeconomic development were utilized. These are given in Table 3, along with the latest year for which each was available and the source from which it was taken – either the Office for National Statistics (ONS, 2013) or Eurostat (Eurostat, 2014). All data are available from the author upon request.
Socioeconomic variables, their years and sources

ONS denotes the Office for National Statistics, the UK government’s statistics agency. Eurostat is the European Union’s statistics agency. GVA, gross value added; EPO, European Patent Office; R&D, research and development.
Statistical methods
For comparing the new estimates of regional IQ with those assembled by Lynn (Reference Lynn1979), the Pearson correlation between the two sets of estimates was calculated. For examining the validity of the regional IQs, the Pearson correlation between national IQ and national PISA score was calculated. For exploring the extent to which regional IQ is associated with socioeconomic development, first the Pearson correlation between regional IQ and each indicator of socioeconomic development was calculated, and then the correlation between regional IQ and a general factor of socioeconomic development. Throughout the analysis, scatterplots are provided as a visual accompaniment. Correlations are not tested for significance given that the sample comprises the full population of UK regions (Pollet, Reference Pollet2013; but see Quillien, Reference Quillien2015).
Results
Comparison of reconstructed regional IQs with Lynn’s (1979) regional IQs
The correlation between Lynn’s (Reference Lynn1979) regional IQs and the reconstructed regional IQs (see Table 1) is weak, namely r=0.24 (n=12). Figure 1 displays a scatterplot of the relationship, confirming that, while positive, it is indeed weak. Assuming the two sets of estimates are accurate and comparable, this finding suggests that the relative IQs of different UK regions have changed since the 1950s. Relative to other regions (i.e. after within-sample standardization), average IQ appears to have increased in Midland, Northern Ireland, Scotland, South Western and Southern; and appears to have decreased in East and West Ridings, Eastern, London and South Eastern, North Midland, North Western, Northern and Wales. Note, however, that only Eastern, Midland, Northern Ireland, Scotland, South Western and Wales map identically onto their original counterparts; the statement should be considered highly tentative with respect to the other six regions. The correlation between Lynn’s (Reference Lynn1979) regional IQs and the reconstructed IQs is similarly weak when only those regions that map identically onto their original counterparts are considered, namely r=0.27 (n=6).
In addition to the possibility that the two sets of estimates are not accurate or not comparable, there are at least four reasons why the relative IQs of different UK regions might have changed since the 1950s. First, cross-regional differentials in the magnitude of the Flynn effect (see Flynn, Reference Flynn2012; Lynn, Reference Lynn2013; Trahan et al., Reference Trahan, Stuebing, Fletcher and Hiscock2014): some regions might have experienced larger Flynn effects than others. Second, cross-regional differentials in the selectivity of external migration (see Richwine, Reference Richwine2009; Lynn, Reference Lynn2011; Rindermann & Thompson, Reference Rindermann and Thompson2014): foreign migrants with higher IQs might have been more likely to settle in some regions than in others. Third, cross-regional differentials in the selectivity of internal migration (see Lynn, Reference Lynn1980; Jokela, Reference Jokela2014): natives with higher IQs might have been more likely to relocate to some regions than to others. Fourth, cross-regional differentials in the strength of the relationship between IQ and fertility (see Lynn & Van Court, Reference Lynn and Van Court2004; Meisenberg, Reference Meisenberg2010; Lynn, Reference Lynn2011; Chen et al., Reference Chen, Chen, Liao and Chen2013; Reeve et al., Reference Reeve, Lyerly and Peach2013; Kanazawa, Reference Kanazawa2014; Hopcraft, Reference Hopcraft2014; Woodley, Reference Woodley2015): fertility might have had a more positive genetic effect in some regions than in others.
Validity of regional IQs
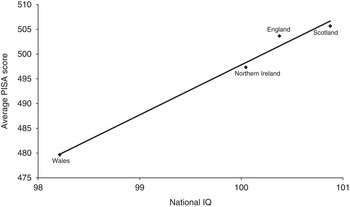
The correlation between the national IQs and national PISA scores is very strong, namely r=0.99 (n=4). The rank order correlation is equal to 1. Figure 2 displays a scatterplot of the relationship, confirming that it is indeed very strong. This finding provides circumstantial evidence for the validity of the regional IQs. Since PISA does not calculate average scores for the twelve UK regions (see OECD, 2014), it is not possible to examine the validity of the regional IQs directly. The correlation between national IQs derived from Lynn’s (Reference Lynn1979) estimates (averaging over English regions to obtain the figure for England) and national PISA scores is very weak, namely r=0.06 (n=4), and the rank order correlation is equal to 0.
Scatterplot of average PISA score against national IQ for four UK nations.

Associations of regional IQ with indicators of socioeconomic development
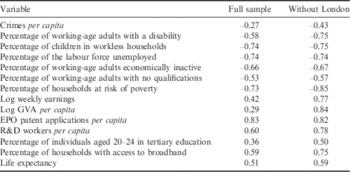
Table 4 displays correlations between regional IQ and the fourteen indicators of socioeconomic development. Values in the first column correspond to the full sample of twelve regions, while values in the second column correspond to the eleven regions other than London. The correlations were estimated with and without London because in a number of cases, particularly the associations with log weekly earnings and log gross value added (GVA) per capita, London was a clear outlier. This should not be surprising given that London is a large capital city, whereas all the other regions encompass both urban and rural areas.
Correlations of socioeconomic variables with regional IQ

GVA, gross value added; EPO, European Patent Office; R&D, research and development.
Regional IQ is correlated in the expected direction with all fourteen indicators of socioeconomic development: negatively with indicators of poverty, deprivation and unemployment; positively with indicators of income, longevity and technological accomplishment. In the full sample, only four indicators are correlated with regional IQ at less than r=0.50: crimes per capita, log weekly earnings, log GVA per capita and percentage of individuals aged 20–24 in tertiary education. When London is excluded, only one of these indicators is correlated with regional IQ at less than r=0.50: crimes per capita. In fact, the correlations of regional IQ with log weekly earnings and log GVA per capita across the eleven other regions are both strong, namely r=0.77 (n=11) and r=0.84 (n=11), respectively.
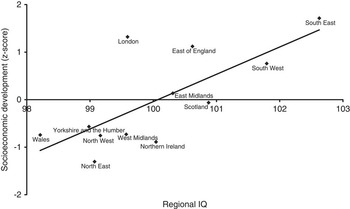
Because many of the indicators were correlated with one another, a general factor of socioeconomic development was obtained by extracting the first principal component from a principal components analysis (see Wicherts et al., Reference Wicherts, Borsboom and Dolan2010a). This component explained 55% of the variance, and all component loadings except one (crimes per capita) had the expected signs. The correlation between regional IQ and the general factor of socioeconomic development is strong, namely r=0.72 (n=12). Figure 3 displays a scatterplot of the relationship, confirming that it is indeed strong. The points around the best-fit line are well behaved; London does not appear to be a major outlier. Nevertheless, the correlation without London is even stronger, namely r=0.84 (n=11).
Scatterplot of a general factor of socioeconomic development against regional IQ for twelve UK regions.

Discussion
Cross-regional correlations between average IQ and indicators of socioeconomic development have been documented in many different countries (Lynn, Reference Lynn1979, Reference Lynn1980, Reference Lynn2010, Reference Lynn2012; McDaniel, Reference McDaniel2006; Pesta et al., Reference Pesta, McDaniel and Bertsch2010; Almeida et al., Reference Almeida, Lemos and Lynn2011; Roivanien, Reference Roivaninen2012; Templer, Reference Templer2012; Barnes et al., Reference Barnes, Beaver and Boutwell2013; Boutwell et al., Reference Boutwell, Franklin, Barnes, Beaver, Deaton, Lewis, Tamplin and Petkovsek2013; Piffer & Lynn, Reference Piffer and Lynn2014; Dutton & Lynn, Reference Dutton and Lynn2014; Kura, Reference Kura2013; Lynn & Cheng, Reference Lynn and Cheng2013; Lynn & Yadav, Reference Lynn and Yadav2015). Yet Lynn (Reference Lynn1979) is the only previous study to have investigated the association between average IQ and socioeconomic development across regions of the UK. This study has repeated Lynn’s (Reference Lynn1979) analysis, using more recent data on both IQ and socioeconomic development.
The study found that new IQ estimates for regions of the UK are weakly correlated (r=0.24) with those assembled by Lynn (Reference Lynn1979). Assuming the two sets of estimates are accurate and comparable, this suggests that the relative IQs of different UK regions have changed since the 1950s, most likely due to differentials in the magnitude of the Flynn effect, the selectivity of external migration, the selectivity of internal migration or the strength of the relationship between IQ and fertility. The study has provided evidence for the validity of the regional IQs by showing that IQ estimates for UK nations (England, Scotland, Wales and Northern Ireland) derived from the same data are strongly correlated with national PISA scores (r=0.99). Finally, it has confirmed that regional IQ is positively related to income, longevity and technological accomplishment; negatively related to poverty, deprivation and unemployment; and positively (r=0.72) related to a general factor of socioeconomic development.
There are of course several important limitations to this study. First, a number of the effect sizes observed were only small-to-moderate in magnitude. In the full sample, regional IQ had a correlation of less than r=0.50 with crimes per capita, log weekly earnings, log GVA per capita and percentage of individuals aged 20–24 in tertiary education. Second, the reconstructed regions utilized in the comparison with Lynn’s (Reference Lynn1979) estimates did not map perfectly onto Lynn’s (Reference Lynn1979) regions, meaning that implied changes in average IQ should be viewed with scepticism for all but six of the regions: Eastern, Midland, Northern Ireland, Scotland, South Western and Wales. Third, given the cross-sectional nature of the data and lack of statistical controls, support for the hypothesis that average IQ has a causal impact on socioeconomic development should be considered only preliminary at best. Indeed, a plausible alternative hypothesis is that higher-IQ individuals migrate to regions that happen to have greater socioeconomic development (see Lynn, Reference Lynn1980; Jokela, Reference Jokela2014).
Acknowledgments
The author acknowledges support from the University of Oxford, from Nuffield College, Oxford, and from the Economic and Social Research Council (UK). He is grateful to Richard Lynn, the University of Essex, the OECD, the ONS and Eurostat for making their data available to researchers, and would like to thank two anonymous reviewers for commenting on earlier versions of the manuscript.