1. Introduction
It is an inevitable trend in global petroleum exploration to transform from conventional to unconventional hydrocarbon resources (Zou et al. Reference Zou, Dong, Wang, Li, Li, Wang, Li and Cheng2010, Reference Zou, Yang, Zhu, Wu, Fu, Lei, Hou, Lin and Pan2019; Yilmaz et al. Reference Yilmaz, Umul, Davis and Nilson2016). Tight gas is an essential component of unconventional resources and will be the critical area in the global unconventional gas exploration (Law & Curtis, Reference Law and Curtis2002; Higgs et al. Reference Higgs, Zwingmann, Reyes and Funnell2007). Tight gas sandstones are usually characterized by low porosity, low permeability and natural fractures (Olson et al. Reference Olson, Laubach and Lander2009). Natural fractures play an essential role in controlling the accumulation of tight gas (Zeng & Liu, Reference Zeng and Liu2009; Zhang et al. Reference Zhang, Zeng, Luo, Zhang, Wu, Lyu, Dai and Zhu2018), and the enrichment of tight gas varies with the abundance of them (Schmoker, Reference Schmoker1996; Ding et al. Reference Ding, Wang, Hu, Yin, Cao and Liu2015). They can significantly improve the seepage capacity of the tight sandstone gas reservoir, providing an effective migration channel for hydrocarbon (Zeng, Reference Zeng2010; Lyu et al. Reference Lyu, Zeng, Zhang, Miao, Lyu and Dong2017). The effectiveness of natural fractures is affected by structural diagenesis (Laubach et al. Reference Laubach, Eichhubl, Hilgers and Lander2010).
According to the filling degree of natural fractures, three different kinds of natural factures can be classified: unfilled fractures, partially filled fractures and fully filled fractures, which can reflect the effectiveness of different fractures distinctly (Zeng et al. Reference Zeng, Zhu, Gao, Gong and Liu2016; Zhao et al. Reference Zhao, Hu, Zeng, Xiao, Li, You and Feng2017; Laubach et al. Reference Laubach, Lander, Criscenti, Anovitz, Urai, Pollyea, Hooker, Narr, Evans, Kerisit, Olson, Dewers, Fisher, Bodnar, Evans, Dove, Bonnell, Marder and Pyrak-Nolte2019). During the natural fractures opening or after the formation, they often undergo diagenesis; these geological processes could change the aperture and connectivity of fractures, which will have a complex impact on fluid flow process and dynamics (Laubach & Ward, Reference Laubach and Ward2006; Zhang et al. Reference Zhang, Zeng, Luo, Zhu, Pan, Dai, Shi, Qin and Xu2020). The natural mineralized fractures or fracture fillings provide valuable information for discriminating fracture sequence and genetic mechanism, and help to assess the evaluation of fracture opening, the origin of the circulating paleo-fluids and the openness of fluid system through time (Gasparrini et al. Reference Gasparrini, Lacombe, Rohais, Belkacemi and Euzen2021).
The fact that permeability can be enhanced by natural fractures is vital in aquifers (Henriksen & Braathen, Reference Henriksen and Braathen2006; Maillot et al. Reference Maillot, Davy, Le Goc, Darcel and de Dreuzy2016), waste repositories (Carey et al. Reference Carey, Lei, Rougier, Mori and Viswanathan2015), hydrothermal systems (Sanderson et al. Reference Sanderson, Roberts and Gumiel1994) and petroleum reservoirs (Laubach, Reference Laubach2003; Gale et al. Reference Gale, Laubach, Olson, Eichhubl and Fall2017; Wang et al. Reference Wang, Narr and Laubach2020), including those in basement rocks (Cuong & Warren, Reference Cuong and Warren2009; Wang et al. Reference Wang, Laubach, Gale and Ramos2019). The typical permeability of fracture-controlled reservoirs show tremendous heterogeneity and anisotropy in fluid flow (e.g. Halihan et al. Reference Halihan, Mace, Sharp, Sasowsky and Wicks2000; Solano et al. Reference Solano, Zambrano and Aguilera2011). Fracture network permeability is governed by many factors, including aperture and length distributions and connectivity, whether fractures are open or sealed, and the heterogeneous spatial arrangement of fractures (Wang et al. Reference Wang, Laubach, Gale and Ramos2019). The fracture parallel to the current direction of maximum principal stress has a large aperture that can be regarded as the main seepage channel (Zeng & Li, Reference Zeng and Li2009). Overall, fully filled fractures contribute little to reservoir productivity, while effective fractures are the main controlling factor for the single well productivity (Zeng et al. Reference Zeng, Gong, Zu, Tang, Wang, Wang and Xu2012 a). It is therefore essential to research natural fractures for tight gas exploration and development.
In the Western Sichuan Foreland Basin of SW China, the proven natural gas reserves are approximately 3361.58 × 108 m3 with an annual output of nearly 30 × 108 m3 (Yang et al. Reference Yang, Zhu, Ye, Zhang and Ke2012). As the Xujiahe Formation is rich in coal-bearing source rocks, continuous hydrocarbon accumulated in it (Zou et al. Reference Zou, Tao, Zhu, Yuan, Li, Zhang, Zhang, Gao, Liu, Xu, Song and Li2009). This formation therefore contains abundant natural gas resources within tight sand reservoirs and shows significant exploration potential (Zhang et al. Reference Zhang, Guo, Hao, Zou and Li2016). For the study of tight gas reservoirs in the Xujiahe Formation, some predecessors paid much attention to diagenesis and pore characteristics (Liu et al. Reference Liu, Hu, Cao, Wang, Tang, Wu and Kang2018 b; Yue et al. Reference Yue, Wu, Xu, Xiong, Chen, Ji and Zhou2018; Yu et al. Reference Yu, Lin, Zhai, Chen, Wang, Li and Deng2019). Others emphasized the study of natural fractures of the Xujiahe Formation in the Xinchang gas field, including the basic types, genetic mechanism and formation period (Zhang, Reference Zhang2005; Ma et al. Reference Ma, Zhou, Tang, Deng, Lei and Wang2013; Deng et al. Reference Deng, Liu, Peng, Liu and Li2018; Yue et al. Reference Yue, Wu, Xu, Xiong, Chen, Ji and Zhou2018), which has promoted the exploration and development of tight gas. Surprisingly, there is no related research on the effect of natural fractures on the accumulation and migration of tight gas, and the contribution of fractures to productivity also needs to be further summarized and discussed.
In this paper, we describe the fracture types, distribution characteristics, filling degree and apertures within the tight gas sandstones in the Upper Triassic Xujiahe Formation of the Xinchang gas field by utilizing drilling cores and image loggings. Through the relationships between cross-cutting fractures, we then summarize and synthesize the homogenization temperature measuring of fluid inclusion, carbon and oxygen isotopes, and quartz electron spin resonance (ESR). We also clarify the formation stage of natural fractures and the contribution of fractures in different stages of fluid to tight gas. At the same time, the influence of fracture strike and dip on fracture effectiveness is discussed. Finally, combined with regional geological data and hydrocarbon production, the effects of natural fractures on tight gas productivity are clarified. Research on the characteristics, formation, effectiveness and periods of the natural fractures in Xinchang area can improve the prediction accuracy of fracture distribution in the tight gas reservoirs and guide the in-depth exploration and development of tight gas.
2. Geological setting
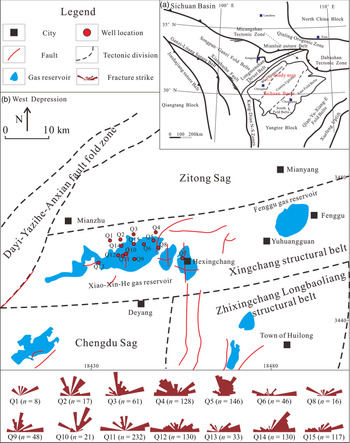
The Sichuan Basin, located in the western part of the Yangtze Block, is a large composite gas-bearing and oil-bearing superimposed basin (Zheng et al. Reference Zheng, Pang, Ma, Li, Zheng and Zhou2019). It connects Longmenshan Thrust Belt and Micangshan Tectonic Zone to the north, Qian–Yu–Xiang–E fold belts to the south, Kang–Dian N–S zones to the west and Dabashan Tectonic Zone to the east (Fig. 1a). Since the beginning of the Late Triassic Epoch, the Sichuan Basin has experienced three periods of palaeo-tectonic movements during the Indosinian, Yanshanian and Himalaya movements. Its peripheral orogenic belts compress the basin from different directions in different stages, and the multi-stage and multi-directional structural systems are combined and modified in the basin (Liu et al. Reference Liu, Chen, Qiu, Fu and Jia2018 a). The basin is divided into four tectonic units, namely: Western Sichuan Depression Belt, NE Sichuan Depression Belt, East Chongqing–SE Sichuan Depression Belt and Central Sichuan Uplift Belt (Fig. 1a). The Xinchang gas field is located in the Xinchang Structural Belt in the middle part of the Western Sichuan Depression, which is adjacent to Chengdu Sag to the south, Zitong Sag to the north and Zhixingchang–Longbaoliang structural belt to the SE, and intersects with the Longmenshan structural belt in the west (Fig. 1b).
The location of the study area and main wells: (a) location of Sichuan Basin in China and Western Sichuan Depression in the Sichuan Basin; and (b) structural framework and the location of main wells in Xinchang gas field. The rose diagrams show the orientations of natural fractures from the image loggings in the Upper Triassic Xujiahe Formation.

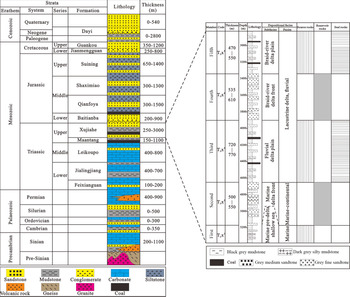
The Palaeozoic, Mesozoic and Cenozoic sedimentary strata are present in the Western Sichuan Depression (Fig. 2). The Triassic strata includes the Upper Xujiahe Formation (T3x), Maantang Formation (T3m), Leikoupo Formation (T2l), Lower Jialingjiang Formation (T1j) and Feixianguan Formation (T1f) (Jin et al. Reference Jin, Tang, Yang, Wan and Lü2010). From bottom to top, the Xujiahe Formation is generally divided into five members (Zhao et al. Reference Zhao, Bian, Xu, Wang, Wang and Shi2011): T3x1, T3x2, T3x3, T3x4 and T3x5 (Fig. 2). Ma’antang–Xiaotangzi Formation (T3x1), T3x3 and T3x5 represent the critical source rock (Qin et al. Reference Qin, Zhang, Zhao and Zhou2018), which consists of dark mud shale of the shallow-sea shelf facies in the early stage, and grey carbon mud shales, sandstones and coal beds of delta limnetic facies in the middle and late–stages (Chen et al. Reference Chen, Pang, Yang, Yang and Ye2012). The primary kerogen type of dark argillaceous source rocks is II2–Ш kerogen. The maturity of source rocks is generally low mature to mature, with a vitrinite reflectance (R0) of 0.8–1.4% (Dai et al. Reference Dai, Li, Ding, Hu, Luo, Hou, Tao, Zhang and Zhu2007; Tao et al. Reference Tao, Zou, Mi, Gao, Yang, Zhang and Fan2014). T3x2 (burial depth > 4500 m; thickness 500–550 m) and T3x4 are the main reservoirs of the Xujiahe Formation. T3x2 was mainly deposited in the marine delta front, consisting mostly of distributary channels and mouth-bar sandstones (Luo et al. Reference Luo, Meng, Gluyas, Tan, Gao, Feng, Kong and Shao2019). The lower part of T3x2 is mainly medium sandstone and fine sandstone with a small amount of mud shale; the middle part is mud shale, siltstone, fine sandstone and a few coal seams; the upper part is fine sandstone and medium sandstone with siltstone and mud shale. The T3x2 tight reservoir porosity is 1–4%, and the permeability is generally lower than 0.5 mD (Wang et al. Reference Wang, Narr and Laubach2020). In China, sandstone reservoirs with a measured porosity of < 10% and permeability < 1 mD at ambient laboratory conditions are categorized as tight sandstone reservoirs (Zou et al. Reference Zou, Yang, Tao, Yuan, Zhu, Hou, Wu, Sun, Zhang, Bai, Wang, Gao and Pang2013; Pang et al. Reference Pang, Peng, Jiang, Yang, Wang, Jiang and Wang2019). On the whole, T3x2 in the Western Sichuan Depression is a typical tight reservoir.
The stratigraphic characteristics of Western Sichuan Depression and Upper Triassic Xujiahe Formation (modified from Li et al. Reference Li, Jia, Chen, Yin, Shen, Sun, Zhang, Li, Li, Zhou, Li, Jian, Zhang and Cui2014; Luo et al. Reference Luo, Meng, Gluyas, Tan, Gao, Feng, Kong and Shao2019).

3. Materials and methods
3.a. Characteristics of natural fractures
Fracture analysis was performed on the Xujiahe Formation interval of nine core wells of 906.62 m in the Xinchang gas field, and the fracture attributes were measured (filling degree, aperture, density and dip). Through image loggings processing and interpretation of 14 wells (4237.88 m), the types of natural fractures were determined, and the occurrence (strike and dip angle), aperture and density of the fractures were acquired (Ameen & Hailwood, Reference Ameen and Hailwood2008; Reference Gong, Fu, Wang, Gao, Jabbari, Yue and LiuGong et al. 2019a ). Finally, the influence of the natural fractures on the production of the single well was analysed by combining the trial production data of 14 wells (Table 1).
Summary of the research materials

3.a.1. Fracture occurrence
To interpret the image loggings data, the natural fractures are first identified on the imaging map. A number of points are then selected on the fracture, extending the trajectory to fit the sine or cosine curves to calculate the inclinations and dip angles of the fracture (Zeng et al. Reference Zeng, Ke and Liu2010b ).
3.a.2. Fracture aperture
When the measuring electrode of the image loggings tool is close to the natural fracture, the electrical resistance of the drilling fluid in the fracture will show an unusually low value; the electrode current of the instrument will then increase until the measuring electrode is far away from the fracture and unaffected by it. By using the three-dimensional finite element model, the response relationship between fracture width and resistance can be deduced. The formula for calculating fracture aperture is (Luthi & Souhaité, Reference Luthi and Souhaité1990; Ponziani et al. Reference Ponziani, Slob, Luthi, Bloemenkamp and Le Nir2015):
 $${\rm{W}} = CA{\rm{}}R_m^b{\rm{}}R_{xo}^{1 - b}$$
 $$A = {1 \over {{V_e}}}\int_{{h_0}}^{{h_n}} {\left[ {{I_b}\left( h \right) - {I_{bm}}} \right]} dh$$
where W is fracture aperture (mm); b and C are instrument parameters; R m is drilling fluid resistivity (Ωm); R xo is the resistivity within the detection range of the instrument electrode (Ωm); A is the added value of the current caused by the fracture; V e is the potential difference between the measuring electrode and the upper return electrode (V); I b(h) is the current value of the electrode at a depth of h (μA); I bm is the measured current value of the natural fracture (μA); h 0 is the initial depth at which the fracture affects the electrode measured values (m); and h n is the end depth of the influence of fractures on electrode measurements (m).
3.a.3. Fracture density
In image loggings, fracture density can be simply calculated as the number of fractures per unit length (Ameen et al. Reference Ameen, MacPherson, Al-Marhoon and Rahim2012; Lai et al. Reference Lai, Wang, Fan, Chen, Qin, Xiao, Wang and Fan2017):
 $${F_d} = {{1}\over{H}}\mathop \sum \limits_{i = 1}^n {L_i}$$
where F d is the fracture density (m−1); H is the length of the evaluated well (m); and L i is the number of fractures in the evaluated wells.
3.b. Period of natural fractures
If cement is deposited while fractures are opening, the age of fractures can be determined by cement formation time (Laubach, Reference Laubach2003; Reference Zeng, Tang, Wang and GongZeng et al. 2012b ). The period of natural fractures can be obtained from the ESR and homogenization temperature measurement of fluid inclusions, which, combined with the burial and thermal history, can help to constrain the fracture formation sequence (Zhang et al. Reference Zhang, Li, Deng and Liu1995; Becker et al. Reference Becker, Eichhubl, Laubach, Reed, Lander and Bodnar2010; Fall et al. Reference Fall, Eichhubl, Bodnar, Laubach and Steve Davis2015; Qiu et al. Reference Qiu, Liu, Yun, Jin, Zhu, Li and Sun2018; Wang et al. Reference Wang, Laubach, Gale and Ramos2019).
4. Results
4.a. Natural fracture types and characteristics
4.a.1. Core analysis
Natural fractures within the tight gas sandstones of the Upper Triassic T3x2 reservoir have been studied from cores and image loggings. These natural fractures are divided into tectonic fractures and diagenetic fractures from the perspective of their geologic origins.
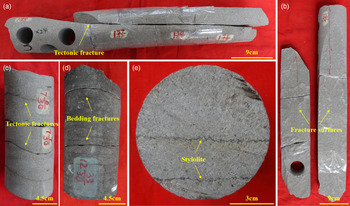
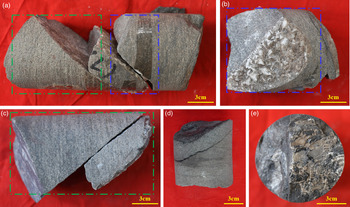
As the primary type of natural fracture, the tectonic fracture is widely distributed in different kinds of lithology, with an obvious orientation and regular distribution. The surface of the fractures is smooth with the steps and slickensides as their typical features (Fig. 3a, b). Some of these fractures are filled with calcite or quartz. The density of tectonic fractures in siltstone is the highest, followed by those in fine sandstones and medium sand; the fracture density of gritstone is the lowest (Fig. 4). With the increase of sandstone particle diameter, the density of natural fractures decreases. The tectonic fracture can be subdivided into five types according to dip angle: nearly vertical fractures (> 80°), high-angle fractures (60–80°), middle-angle fractures (30–60°), low-angle fractures (10–30°) and nearly horizontal fractures (< 10°) (Zeng et al. Reference Zeng, Ke and Liu2010b ). The nearly horizontal fractures are mainly developed in medium sandstone and gritstone, and intersected with the plane at a small angle (Fig. 3c). They usually have equal spacing of 3–5 cm.
Natural fractures of the cores. (a) High-angle tectonic fracture from well Q6, at a depth of 4733.95 m; (b) The joint surface of high-angle tectonic fractures in (a); (c) low-angle tectonic fracture from well Q3, at a depth of 4918.55 m; (d) bedding fractures from well Q5, at a depth of 5026.95 m; (e) stylolite from well Q5, at a depth of 4931.46 m.

The relationship between sandstone types and tectonic fracture density; the diameters of gritstone, medium sandstone, fine sandstone and siltstone are 0.5–2.0, 0.25–0.50, 0.10–0.25 and 0.01–0.10 mm, respectively.

The main type of diagenetic fracture is bedding fractures, which are generally developed along the plane in interruption characteristics, that is, bending, wedge-out, combining or branching out along the plane (Fig. 3d). The bedding fractures are widely distributed and developed in the study area, but their extending length has not yet been identified. The stylolite is usually in a serrated shape with insoluble minerals, and the organic matter remains abundant (Fig. 3e).
4.a.2. Image loggings analysis
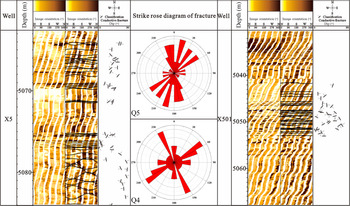
Natural fractures typically appear as a sine or cosine curve pattern in the image loggings; the colour is generally different from the surrounding formations. Their width and amplitude are controlled by fracture aperture and dip angle, respectively (Fig. 5). The results of image loggings interpretation show four dominant assemblages of natural fracture in the T3x2: E–W, NE–SW, N–S and NW–SE strike (Figs 1, 6).
Fractures detected by image loggings in wells Q5 and Q4. All fractures in the image loggings are open.

Rose diagram of the fracture strikes in the T3x2 tight gas sandstones in the Western Sichuan Basin. The data were obtained from image loggings (n = 1133).

4.b. Cross-cutting relationships
By analysing the cross-cutting relationships of different genetic fractures in cores and the characteristics of their fracture fillings, we can effectively reconstruct the natural fracture sequence (Felici et al. Reference Felici, Alemanni, Bouacida and de Montleau2016; Kanjanapayont et al. Reference Kanjanapayont, Aydin, Wongseekaew and Maneelok2016). The filling degree also can illustrate the formation timing of different fractures, and the filling degree of different genetic fractures formed in the same period is similar (Li et al. Reference Li, Zhao, Liu, Liu, Li, Fan, Wang, Li, Zhao and Sun2021). The filling minerals in the fractures include calcite, quartz, carbonaceous clay and asphaltene (Fig. 7). Quartz and calcite are filled in tectonic fractures, and carbonaceous clay is usually filled in bedding fractures. Based on the cross-cutting relationships of natural fractures, three phenomena can be clearly observed. (i) Three types of calcite fillings cut and restricted each other based on the degree of crystallization and filling (Fig. 7a–c), indicating that the fracture experienced three stages of calcite filling. (ii) Some bedding fractures are filled with carbonaceous clay while others are not, and there are tectonic fractures filled with asphaltene and carbonaceous clay that restrict the bedding fractures without filling (Fig. 7d). The second phenomenon indicates that bedding fractures experienced one period of carbonaceous clay filling event and one period without any filling event, and the carbonaceous clay filling preceded the no-filling. (iii) Tectonic fractures are filled with calcite, quartz and asphaltene (Fig. 7e), and the asphaltene fillings are on the surface of quartz and calcite, indicating that the quartz and calcite filling event was earlier than the asphaltene filling event. Based on the above analysis, the four filling stages of natural fractures can be initially determined. Firstly, the tectonic fractures were filled with calcite and quartz. Secondly, the bedding fractures were filled by carbonaceous clay. Thirdly, the tectonic fractures were filled with calcite and asphaltene. Finally, the tectonic fractures were filled with calcite.
Fracture cross-cutting and abutting relationships from cores. (a–c) Three types of calcite fillings cut and restricted each other based on the degree of crystallization and filling from well Q4, at a depth of 5252.29 m. (d) Carbonaceous clay fills some bedding fractures, but not all. Some tectonic fractures are filled with asphaltene and carbonaceous clay from well Q5 at a depth of 4967.56 m. (e) Tectonic fractures are filled with calcite, quartz and asphaltene in well Q4, at a depth of 5252.87 m.

5. Discussion
The tectonic fractures are related to tectonic processes (Aguilera, Reference Aguilera1998; Lyu et al. Reference Lyu, Zeng, Zhang, Miao, Lyu and Dong2017). Diagenetic fractures result from volumetric reductions caused by diagenetic changes within rocks (Aguilera, Reference Aguilera1998; Shi et al. Reference Shi, Zeng, Zhao, Zhang and Wang2020). Bedding fractures are constrained and controlled by depositional bedding (Petrie et al. Reference Petrie, Evans and Bauer2014), indicating that they were formed during the diagenetic processes of the reservoir (Gong et al. Reference Gong, Su, Gao, Fu, Jabbari, Wang, Liu, Yue, Wang and Gao2019b ). The formation of stylolite is closely related to the dissolution of rocks driven by compressive stress (Brouste et al. Reference Brouste, Renard, Gratier and Schmittbuhl2007). These fractures are related to diagenesis, rather than the result of tectonic events (Zeng & Li, Reference Zeng and Li2009; Lyu et al. Reference Lyu, Zeng, Zhang, Miao, Lyu and Dong2017; Zhang et al. Reference Zhang, Zeng, Luo, Zhu, Pan, Dai, Shi, Qin and Xu2020; Liu et al. Reference Liu, Zhang, Pan, Huang, Luo, Song and Jiang2020).
5.a. Fracture sequence
5.a.1. Homogenization temperature of fluid inclusions
Cements within fractures are precipitates of the fluid during fracture opening (Laubach, Reference Laubach1988; Fall et al. Reference Fall, Eichhubl, Bodnar, Laubach and Steve Davis2015; English & Laubach, 2017); they therefore provide important clues to fluid composition, pressure and temperature conditions in retracing the fracture-opening history (Hooker et al. Reference Hooker, Gale, Gomez, Laubach, Marrett and Reed2009; Lander & Laubach, Reference Lander and Laubach2014). Fluid inclusions within fracture cements are micron-scale volumes of the fluid entrapped during the precipitation of minerals (Watson & Brenan, Reference Watson and Brenan1987; Baron et al. Reference Baron, Parnell, Mark, Carr, Przyjalgowski and Feely2008). The relative timing of the fluid inclusion assemblages (FIAs) is constrained by textural mapping of fracture-growth cement zones, allowing us to place the fractures in their orogenic context by correlation with independently derived burial history (Becker et al. Reference Becker, Eichhubl, Laubach, Reed, Lander and Bodnar2010; Fall et al. Reference Fall, Eichhubl, Cumella, Bodnar, Laubach and Becker2012; Liu et al. Reference Liu, Zhang, Pan, Huang, Luo, Song and Jiang2020). Becker et al. (Reference Becker, Eichhubl, Laubach, Reed, Lander and Bodnar2010) found that fluid inclusions within quartz are common in sandstones and preferable for the reconstruction of fluid-inclusion palaeotemperatures compared with fluid inclusions in carbonate minerals, which may experience volumetric re-equilibration due to the relative low hardness of minerals (Pecher, Reference Pecher1981; Liu et al. Reference Liu, Bourdet, Zhang, Zhang, Lu, Liu, Pang, Li and Guo2013). An improved ability to accurately map crack-seal textures in carbonate cements would make it possible to describe the temperature sequences during fracture opening in carbonates (Ukar & Laubach, Reference Ukar and Laubach2016), following a similar method to that used for quartz-filled fractures in sandstones (Becker et al. Reference Becker, Eichhubl, Laubach, Reed, Lander and Bodnar2010; Fall et al. Reference Fall, Eichhubl, Bodnar, Laubach and Steve Davis2015). Stretched or leaked inclusions will yield homogenization temperatures (T h) greater than undeformed inclusions (Gao et al. Reference Gao, He, Zhao and Yi2017). To avoid the anomalous homogenization temperatures resulting from volumetric re-equilibration, heating runs were conducted before freezing runs to reduce the possibility of inclusion stretching by freezing. By restricting measurements to inclusions within the same field of view, any sudden changes in liquid and/or vapour ratios due to inclusion deformation could be observed and removed from consideration (Liang et al. Reference Liang, Xu, Xu, Yuan, Huang, Wang, Wang and Fu2019). Where possible, only the smallest inclusions and/or those with rounded and smooth walls were measured, as they give the most reliable T h values (Ulrich & Bodnar, Reference Ulrich and Bodnar1988; Osborne & Haszeldine, Reference Osborne and Haszeldine1993). However, if the fluid inclusions in the fractures are affected by hydrothermal action, their measured temperatures may be significantly higher than the maximum temperatures of burial history and thermal evolution, and the periods of these fractures become difficult to determine. The homogenization temperature of tectonic fracture ranges from 80 to 240°C, and the peak temperatures are distributed over 80–120, 160–200 and 200–240°C, respectively (Fig. 8a). The homogenization temperature of bedding fractures varies from 120 to 240°C, and the peak temperatures are within the ranges 120–160 and 200–240°C (Fig. 8b). The peak temperatures of fluid inclusions in netted fractures are within the ranges 160–200 and 200–240°C (Fig. 8c).
Frequency histogram of homogenization temperature from inclusions in fracture calcite fillings in T3x2: (a) in the tectonic fracture (n = 11); (b) in the bedding fracture (n = 6); and (c) in the netted fracture (n = 9). The test data were obtained from Yang et al. (Reference Yang, Zhu, Ye, Zhang and Ke2012) and Deng et al. (Reference Deng, Zhou, Zhou, Chen and Zhang2013).

5.a.2. Electron spin resonance dating
ESR refers to the resonance absorption effect caused by the magnetic moment of unpaired electron spin (Ren et al. Reference Ren, Song and Li2016). When the magnetic moment of the electron spin in the stationary magnetic field is affected by a radio-frequency (RF) electromagnetic field, the electron will resonate with the RF electromagnetic field and transit from the low-energy product to the high-energy product (Hennig & Grün, Reference Hennig and Grün1983). The ESR dating of fault/fracture movements assume that the ESR signals in rock-related features are reset during faulting/fracturing as a result of the heat generated by friction and/or intense deformation (Tsakalos et al. Reference Tsakalos, Kazantzaki, Lin, Bassiakos, Filippaki and Takafumi2018). This method has been widely used in seismic geology, engineering geology and geological sciences (Huang, Reference Huang1994; Qiu et al. Reference Qiu, Liu, Yun, Jin, Zhu, Li and Sun2018; Voinchet et al. Reference Voinchet, Yin, Falguères, Liu, Han, Sun and Bahain2019). The age of one substance, such as quartz and calcite, can be determined by measuring the dosage of radiation after their formation (Ren et al. Reference Ren, Song and Li2016). Under the bombardment of the natural rays generated from the fracture wall, the earlier that the authigenic minerals (quartz or calcite veins) in the fractures are formed, the higher the paramagnetic centre concentration (Zhang et al. Reference Zhang, Li, Deng and Liu1995). ESR can therefore directly determine the age of the secondary minerals in the fracture, and approximately represent the formation time of the natural fracture. The relative error of an ESR age is related to the experimental conditions. The error can be introduced by statistical errors, natural radioactive decay of the element’s uranium and thorium, the standard applied and the instrumental error (Liang & Gao, Reference Liang and Gao1999). The total error is less than 10% of the absolute age (Peng et al. Reference Peng, Yuan, Li and Man1993). Different from carbon and oxygen isotopes and fluid inclusion thermometry, ESR dating can directly obtain the approximate age of natural fractures. It is not necessary to determine the formation time of natural fractures by matching the temperature obtained directly or indirectly with the thermal history. The formation time of quartz fillings in the fracture was 217 and 219 Ma according to quartz ESR dating, and the fracture formed during the late Indosinian tectonic movement (Table 2).
Results of quartz electron spin responance dating in the T3x2 sandstone of Xinchang area, Western Sichuan Basin

According to the cross-cutting relationship of minerals in fractures, their fluid-inclusion analysis, quartz ESR dating and burial history, we determine three fracture-filling events, showing that tectonic fractures were mainly formed during three tectonic periods. The first event was at the end of the Triassic Period, with fluid-inclusion homogenization temperatures ranging from 80 to 120°C and quartz fillings of age 217–219 Ma (Fig. 9 and Table 2). The second event occurred during the Cretaceous Period, with fluid-inclusion homogenization temperatures ranging from 160 to 200°C (Fig. 9). The third event occurred during the Palaeogene Period, with fluid-inclusion homogenization temperatures ranging from 200 to 240°C (Fig. 9). Two stages of bedding fractures were formed during the middle and late Indosinian and late Yanshanian orogenic periods (Fig. 9).
Burial history, thermal history and the temperature of calcite fillings in the fractures in the Triassic Xujiahe Formation (Leng et al. Reference Leng, Li and Yang2011). Tr – Triassic; J – Jurassic; K – Cretaceous; Pg – Palaeogene; Ng – Neogene. T1 – first stage of tectonic fracture; T2 – second stage of tectonic fracture; T3 – third stage of tectonic fracture; B1 – first stage of bedding fracture; B2 – second stage of bedding fracture.

5.b. Source of calcite fillings in the fracture
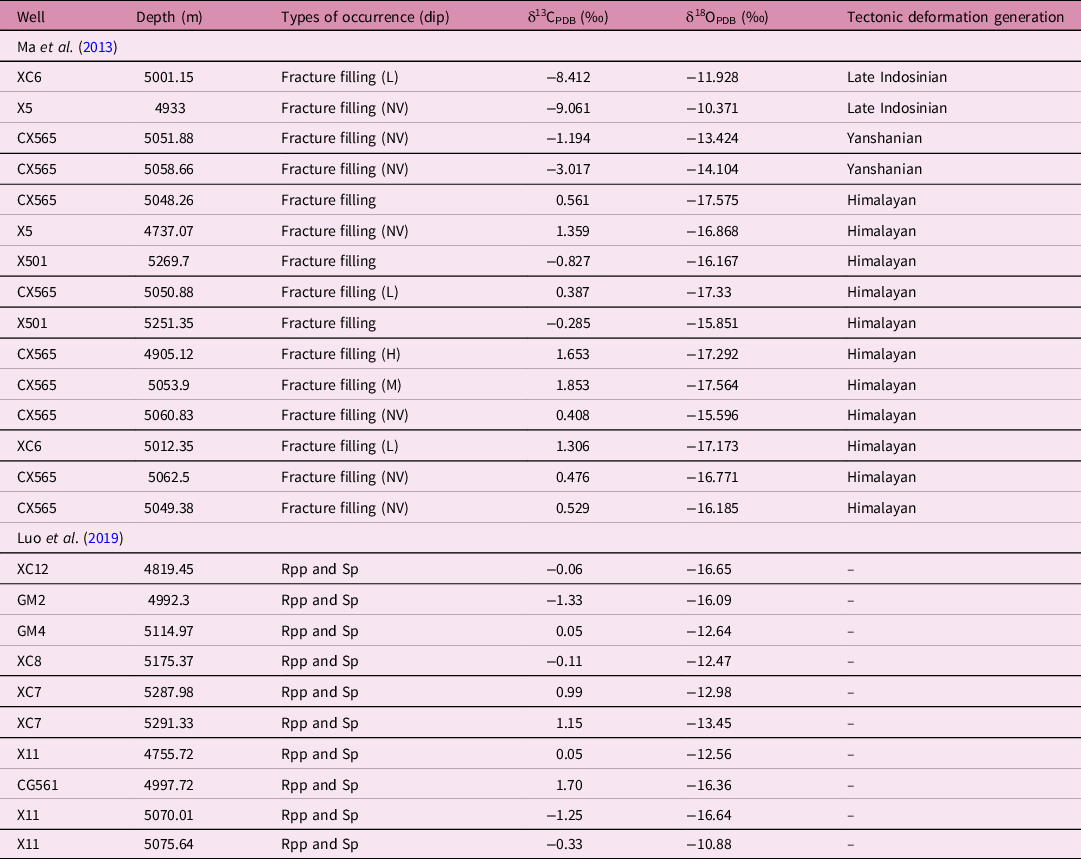
Carbon isotope ratios can be used to reflect the sources of carbon, including bacterial sulphate reduction, fermentation, dissolution of carbonate minerals, methane oxidation, methane production and organic matter decarboxylation (Morad et al. Reference Morad, Al-Aasm, Ramseyer, Marfil and Aldahan1990; Fayek et al. Reference Fayek, Harrison, Grove, McKeegan, Coath and Boles2001). The oxygen isotope ratio of minerals is controlled mainly by the variation range of temperature (burial depth), the degree of fractionation between fluid and minerals, and the fluid source (Chowdhury & Noble, Reference Chowdhury and Noble1996). The carbon and oxygen isotopic compositions of fracture fillings also record the temperature and salinity information about the fracturing fluids (Spero et al. Reference Spero, Bijma, Lea and Bernis1997; Liu et al. Reference Liu, Zhang, Pan, Huang, Luo, Song and Jiang2020; Zhang et al. Reference Zhang, Zeng, Luo, Zhu, Pan, Dai, Shi, Qin and Xu2020). By comparing with the host rock and the target layer, we can infer the fluid origin (Hooker et al. Reference Hooker, Larson, Eakin, Laubach, Eichhubl, Fall and Marrett2015; Zhang et al. Reference Zhang, Zhu, Luo, Liu, Liu, Yan and Zhang2017). In the interpretation of carbon isotope values of carbonate cements, the biggest challenge is that there may be two or more sources of carbon, and the later diagenetic recrystallization will interfere with the interpretation of the source of dissolved carbon (Morad et al. Reference Morad, Al-Aasm, Ramseyer, Marfil and Aldahan1990; Liu et al. Reference Liu, Huang, Shen, Lü and Song2014). The timing of three stages agrees with the inferences from carbon- and oxygen-stable isotope analysis of calcite fillings in tectonic fractures (Ma et al. Reference Ma, Zhou, Tang, Deng, Lei and Wang2013). It is possible for us to analyse the source of calcite fillings in tectonic fractures from different stages. The δ13C values of calcite fillings in fractures range from –9.061 to 1.853‰, with an average value of –0.951‰; the δ18O value varies from –10.371‰ to –17.575‰, with an average value of –15.613‰ (Table 3). The δ13C values of calcite in the matrix range from –1.33‰ to 1.70‰ with an average value of 0.09‰, and the δ18O values varies from –16.65‰ to –10.88‰, with an average value of –14.07‰ (Table 3).
Types and isotopic features of calcite cements and fillings in the T3x2 sandstone of Xinchang area, Western Sichuan Basin

NV – nearly vertical fractures; H – high-angle fractures; M – middle-angle fractures; L – low-angle fractures; Rpp – residual primary pore; Sp – secondary pore.
The carbonate cements of the Xujiahe Formation sandstones can be divided into two generations of early and late carbonate cement, and the sandstone was dominated by late calcite (Luo et al. Reference Luo, Meng, Gluyas, Tan, Gao, Feng, Kong and Shao2019). The δ13C values of early calcite cement in the residual primary pores is –0.33‰. The carbon source of the early calcite cement in the pores is closely related to the internal carbonate rock fragments consisting of inorganic carbon, whose δ13C values can increase up to 3‰ (Friedman & O’Neil, Reference Friedman and O’Neil1977). Because of the Longmenshan uplift during the Late Triassic Epoch, the Palaeozoic marine carbonate strata in the west of the Sichuan Basin had experienced intense erosion, and abundant carbonate fragments were supplied to the Xujiahe sediments by river transportation (Xu et al. Reference Xu, Gehenn, Zhao, Xie and Teng2015; Liu et al. Reference Liu, Hu, Cao, Wang, Zhu, Tang and Gao2019). Given that the average value of δ13C in carbonate fragments is +1.93‰ (Liu et al. Reference Liu, Huang, Shen, Lü and Song2014), the observation indicates that the carbonate rock fragments are providing another carbon source for the carbonate cements in the Xujiahe Formation (Li et al. Reference Li, Zhu, Lou, Yin, Hu, Zhu and Jin2019). However, there was not enough acid for the dissolution of internal carbonate rock fragments at the early diagenetic stage. The early calcite cement in the pores therefore precipitated from pore fluids containing Ca2+ and CO3 2− came from the original formation water in sandstone and adjacent mudstone, which were mainly related to weathering or the dissolution of carbonate rock fragments in the provenance or transport process, and were rarely related to the organic carbon/acid. The fact that the mixed carbon source was mainly composed of carbon rock fragments and the original formation water meant that the negative 13C value of calcite cement in the residual primary pores was < 3‰. The δ13C values of late calcite cement in the secondary pores are –1.25‰ and +1.70‰ (Fig. 10). The source rock in the lower sub-member of T3x2 exists under methanogenic conditions (Luo, Reference Luo2015). The organic acid in T3x1 and lower sub-member of T3x2, which migrated into the sandstone reservoir of the marine-source rocks, provided the carbon source for carbonate cement in the reservoir matrix pores (Liu et al. Reference Liu, Huang, Shen, Lü and Song2014; Luo, Reference Luo2015). The isotope data reveal the mixing between organic-derived carbon and inorganic-derived carbonate cements, and the inorganic carbon is dominant, so the δ13C values of late calcite cements are relatively heavy. The Ca2+ may come from the late dissolution of feldspar and rock fragments and from the transformation of clay minerals during the burial progress (Xi et al. Reference Xi, Cao, Jahren, Zhu, Bjørlykke, Haile, Zheng and Hellevang2015).
Carbon and oxygen isotope results. The data describing the calcite fillings in tectonic fractures are from Ma et al. (Reference Ma, Zhou, Tang, Deng, Lei and Wang2013); calcite data in the matrix are from Luo et al. (Reference Luo, Meng, Gluyas, Tan, Gao, Feng, Kong and Shao2019).

The δ13C values of calcite fillings in the first stage of fractures are –8.412‰ and –9.061‰ (Fig. 10). The δ13C value of the carbonate cement filling is approximately –7‰, which means that the source of δ13C was modified by the meteoric water (Mack et al. Reference Mack, Cole, Giordano, Schaal and Barcelos1991; Spötl & Wright, Reference Spötl and Wright1992). The reservoir in the formation period was shallow in depth, and the meteoric water flew through the fracture to the underground to participate in the formation of the calcite filling. The δ13C values of calcite fillings in the second stage of fractures are –3.017‰ and –1.194‰ (Fig. 10), indicating that these carbonate fillings are mainly formed under methanogenic conditions or during oxidation of organic carbon (Irwin et al. Reference Irwin, Curtis and Coleman1977; Wei et al. Reference Wei, Zhu, Tan, Xue, Guo, Su and Wang2015). The CO2 generated from thermal decarboxylation of organic matter or hydrocarbon oxidation by sulphate or manganese reduction is depleted in δ13C (Irwin et al. Reference Irwin, Curtis and Coleman1977; Wu et al. Reference Wu, Hu, Tang, Cao, Wang, Wang and Kang2017). The late calcites cement in the secondary pores and that in the second stage of fractures have similar carbon values, and the former is slightly heavier than the latter. The methanogenesis can leave behind a pool of enriched carbon in the secondary pores, and the light components were migrated through the fractures and participated in the formation of calcite fillings in the fractures. This can be used to explain the minor difference between the two carbon values. Carbon sources of carbonate fillings could therefore have come from the organic acids that flowed into sandstone from the source rock (Liu et al. Reference Liu, Huang, Shen, Lü and Song2014). The δ13C values of calcite fillings in the third fracture fillings are between –0.827 and +1.853‰. Further, the late calcites cement in the secondary pores and the third stage of fractures have similar carbon values. In this period, the T3x2 reservoir has transformed from a moderately open system to a closed system (Luo et al. Reference Luo, Meng, Gluyas, Tan, Gao, Feng, Kong and Shao2019). These fracture-filling carbonates have identical carbon to the sediment of the host rock, and therefore probably formed by closed-system dissolution-reprecipitation of host-rock carbonates. Compared with the second-stage tectonic fracture fillings, the contribution of organic carbon in the third stage fracture fillings is lower and the δ13C value is increased, which may be related to the reduction in hydrocarbon generation.
5.c. Relationship between fracture evaluation and tight gas accumulation and migration
The tight gas accumulation periods covered T3x5 – Early Jurassic (the first gas accumulation phase), Middle Jurassic – Early Cretaceous (the second gas accumulation phase) and Himalayan (the third gas accumulation phase). Among them, the second gas accumulation stage spanned the longest period (Liu et al. Reference Liu, Shen, Lu and Luo2009) (Fig. 11). According to the burial history and thermal history analysis, the gas molecular events of tectonic fractures occurred Early Cretaceous and Eocene time. The oil and gas molecular events of bedding fractures occurred during the Late Jurassic and Late Cretaceous periods.
Petroleum system event and fracture formation time of the Triassic Xujiahe Formation. Data describing pore evolution and diagenesis of the reservoir are from Reference Liu, Hu, Cao, Wang, Tang, Wu and KangLiu et al. (2018b ) and Yu et al. (Reference Yu, Lin, Zhai, Chen, Wang, Li and Deng2019); data describing efficiency of hydrocarbon expulsion and petroleum system event are from Guo et al. (Reference Guo, Pang, Chen, Leng and Tian2012). T – Triassic; J – Jurassic; K – Cretaceous; Pg – Palaeogene; Ng – Neogene; Q – Quaternary.

When the natural fracture was completely filled with minerals, most of the fracture storage space and percolation path were lost (de Graaf et al. Reference de Graaf, Reijmer, Bertotti, Bezerra, Cazarin, Bisdom and Vonhof2017). The first-stage tectonic fractures were formed earlier than calcite and quartz cementation, so they experienced longer cementation and were prone to be filled with minerals and present poor effectiveness (Zeng et al. Reference Zeng, Gong, Zu, Tang, Wang, Wang and Xu2012a ). This tectonic fracture exhibited poor effectiveness for tight gas charging, and can only provide a small amount of reservoir space and seepage channel in the later stage. Although compaction and cementation significantly reduced the porosity and permeability of the reservoir (Lézin et al. Reference Lézin, Odonne, Massonnat and Escadeillas2009; Lavenu et al. Reference Lavenu, Lamarche, Salardon, Gallois, Marié and Gauthier2014), they improved the overall brittleness of the reservoir (Zeng et al. Reference Zeng, Zhu, Gao, Gong and Liu2016; Zhang et al. Reference Zhang, Zeng, Luo, Zhu, Pan, Dai, Shi, Qin and Xu2020). A better brittle condition of the reservoir provided favourable conditions for forming the second-period tectonic fractures and the second stage of cementation was at the initial stage of diagenesis, so the cementation was relatively weak. The development strength and the effectiveness of the tectonic fractures formed in this period were therefore superior to that of the first stage. The formation time of the second-stage tectonic fracture was consistent with the main-reservoir-forming time. The fracture occurred after reservoir densification, and the tectonic fracture greatly improved the low porosity and permeability of the reservoir. Hydrocarbon was primarily generated and expelled during the main tight gas accumulation period, and the second-stage tectonic fractures provided the seepage channels and important reservoir spaces for the vertical migration of natural gas in the tight sandstone. The main diagenesis in T3x2 was almost complete, and the cementation was at its end stage (Fig. 11). At this time, the reservoir was the tightest, and the rock brittleness was the most favourable, so the development and effectiveness of the third-stage tectonic fracture were the best among all the three stages. In this period, the tectonic fractures were consistent with the accumulation time of tight gas in the third gas accumulation phase and greatly improved the permeability of the reservoir, adjusted and reconstructed the primarily sealed gas reservoir, and restored the seepage capacity of the tight reservoir.
The beddings formed in the early deposition period contributed to the reservoir as the primary pores and had better reservoir space and seepage capacity. Here, the bedding with seepage capacity is referred to as the primary bedding fracture. During the middle and late Indosinian period, T3x2 sediments within reservoirs were compacted into rocks and transformed by diagenesis. The bedding fractures were compacted vertically, resulting in a reduced or even closed aperture. The compaction was therefore the main diagenetic type that weakened the migration capacity of bedding fractures in the early stage of formation. However, in the high-quality reservoirs with low matrix and muddy content and with strong compaction resistance, the bedding fractures maintained seepage ability (Fig. 12a). The primary bedding fractures could be used as transverse short-distance migration channels for tight gas accumulation during the first and second tight gas charging (Fig. 12b). It was found that the homogenization temperature fluid inclusions in the primary bedding fractures (120−160°C) were lower than that in the second-stage tectonic fractures (160–200°C). This could indicate that the tight gas reservoir initially underwent short-distance transverse migration. When it encountered fractures with middle and high angles, it then began to migrate vertically. The primary bedding fractures improved the physical property of the reservoir and accelerated the migration of tight gas. During middle Yanshanian time the reservoir experienced the main mechanical compaction, and the bedding fractures had the least contribution to the gas migration. In geological history the stratum was uplifted, changing the aperture of the bedding fractures (Gale et al. Reference Gale, Laubach, Olson, Eichhubl and Fall2017). The tectonic uplift mainly reduced the minimum principal stress, so that the Mohr Circle of stress could be increased to intersect the rupture envelopes (Zeng et al. Reference Zeng, Jiang and Yang2010a ) and the bedding fractures could reopen. At the end of the Early Cretaceous Epoch, the stratum was significantly uplifted (Fig. 9). The pressure unloading within the early closed bedding fractures could have led to the reopening of beddings and bedding fractures. The primary bedding fractures and the second-stage tectonic fractures combined to form the early fracture network system. In contrast, the late ruptured bedding fractures and the third-stage tectonic fractures together constituted the late fracture network system. The peak temperature distribution range of fluid inclusions of fillings in netted fractures covers the temperature range of fluid inclusions in bedding fractures and tectonic fractures, which can be used as strong evidence for the formation of multi-stage fracture networks.
Evidence that bedding fractures maintain the seepage ability and enable the hydrocarbon to migrate. Bedding fracture in (a) well Q11, depth 4718.19 m and (b) well Q5, depth 6062.40 m. Cross-polarized light images.

5.d. Factors affecting the effectiveness of natural fractures
The maximum principal stress orientation of T3x2 in the Xinchang gas field is close to an E–W trend (Cao, Reference Cao2005); so the average aperture value (0.126 mm) of E–W-aligned fractures is therefore greater than that of NW-aligned (0.094 mm) and NE-aligned (0.087 mm) fractures (Fig. 13a). The N–S fractures are perpendicular to the direction of the present stress field; the average aperture value (0.078 mm) of the N–S-aligned strike fracture is therefore the smallest (Fig. 13a). The filling degree of fractures is higher when the fracture angle becomes smaller, so the proportion of fully filled and partially filled fractures is the lowest among high-angle fractures (Fig. 13b). However, the fracture aperture does not increase with the rise of the dip angle, and the high values of fracture aperture are clustered between 30° and 60° (Fig. 13c). After formation, natural fractures experience the same diagenesis as the pores within the host rock matrix (Laubach, Reference Laubach2003) and the fracture aperture will be affected by compaction and cementation. In the Xinchang area, the effect of compaction on the tight reservoir is stronger than that of cementation (Fig. 13d). The vertical compaction greatly limits the aperture of near-horizontal and low-angle fractures, but has little effect on the middle-angle, high-angle and nearly vertical fractures. It is shown that the apertures of the near-horizontal and low-angle fractures have negative correlations with burial depth as a result of the vertical compaction (Fig. 14a), while there is no significant variation of the apertures of 30–90° fractures with burial depth (Fig. 14b, c). The lateral compaction caused by tectonic stress in foreland basin accounts for about 40% of the total pore reduction caused by compaction in tight reservoirs, while the rest of the pore reduction is caused by vertical compaction (Shou et al. Reference Shou, Zhu and Zhang2003; Gao et al. Reference Gao, Ma, Cui, Feng, Zhou and Wu2018). The influence of lateral compaction on fracture aperture therefore cannot be ignored. Located in the NW of the Sichuan foreland basin, the Longmen Mountain, as the provenance, continuously provides clastic matter to the basin. In the meantime, the lateral compaction in the NW direction caused by over-thrusting could reduce the aperture of high-angle or nearly vertical fractures; fractures with NE-aligned strike were influenced the most (Fig. 14d). On the other hand, the lateral structural compression in the NE direction had little influence on the nearly horizontal and low-angle fractures. In the study area, compaction has a significant effect on fracture apertures of 0–30° and 60–90°, but has little impact on fracture apertures of 30–60°. In conclusion, as a result of the combined effects of compaction and cementation, the seepage capacity of the fractures with dip angle > 30° is better than for a dip angle of 0–30° at present (Fig. 13c).
(a) The relationship between fracture strike and fracture aperture. (b) The distribution of filling degree in different fracture dips. (c) The relationship between fracture dip and fracture aperture. (d) Evaluation of relative importance of compactional processes and cementation to porosity development of sandstone, according to Ehrenberg (Reference Ehrenberg1989) and Li et al. (Reference Li, Lyu and Ye2011).

The relationship between depth and fracture aperture in (a) the nearly horizontal fractures and low-angle fractures (0–30°); (b) middle-angle fractures (30–60°); and (c) the nearly vertical and high-angle fractures (60–90°). (d) The distribution of fracture aperture of fracture strike in the nearly vertical and high-angle fractures (60–90°).

5.e. Effect of natural fractures on tight gas production capacity
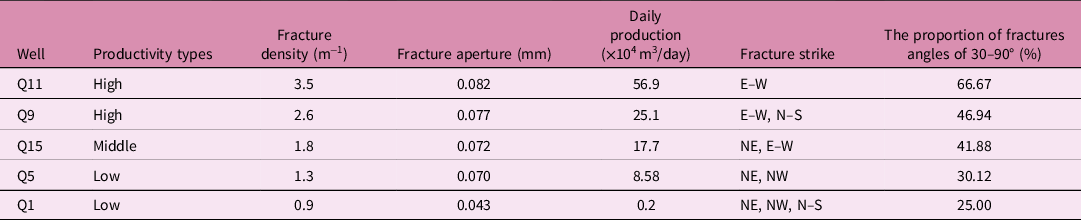
According to the analysis of fractures within cores from nine vertical wells and their production data, the initial gas production of the vertical wells presents a positive correlation with the fracture abundance (R 2 = 0.6365) (Fig. 15). This phenomenon is not related to whether the fractures are filled or not. The important material source of the calcite filling in the fractures is hydrocarbon, indicating that the fractures act as a tight gas migration channel before being filled. Due to the short-distance migration characteristics of tight gas and oil, it is possible for hydrocarbon to fill these fractures, providing a reliable source for high production. According to the production of tight gas in five typical tight gas production wells (Table 4), the productivity of individual wells can be divided into three categories: high (daily production > 20 × 104 m3/day), middle (daily production between 10 × 104 and 20 × 104 m3/day) and low (daily production < 10 × 104 m3/day). According to the core observation, the high-productivity wells (Q11 and Q9) are dominated by fine sandstone and siltstone. This kind of lithology leads to an abundance of natural fractures (the fracture density is between 2.6 and 3.5 m−1). The rocks with more brittle minerals (such as calcite and quartz), finer grain size and better assortment are easily fractured (Kong et al. Reference Kong, Ostadhassan, Li and Tamimi2018). For example, natural fractures in the siltstones are the most developed, followed by fine sandstones and medium sandstones (Gong et al. Reference Gong, Fu, Wang, Gao, Jabbari, Yue and Liu2019a ). The main strike of fractures in the well is consistent with the direction of the maximum principal stress (E–W), and the fractures with the dip angle between 30 and 90° are the majority (c. 46.94–66.67%). The fracture strike and dip angle jointly determine that the average apertures of the natural fractures in the samples from this well are the largest (with an average aperture of 0.077–0.082 mm). The content of fine sandstone and siltstone in middle-productivity well Q15 is medium, and the fracture strength is moderate (fracture density, 1.8 m−1). The fractures are mainly in the E–W direction, and the fractures with the dip angle of 30–90° (c. 34.19%) are less frequent than in a high-productivity well; the average fracture aperture is 0.072 mm. The overall development strength and effectiveness of the fracture are also lower than that for the high-productivity well. Natural fractures therefore make a moderate contribution to the oil and gas production capacity. The lithology of cored samples from low-productivity well Q1 is complex so that the natural fractures can be rarely found there (the fracture density is 0.9 m−1). The condition of low-productivity well Q5 is similar to that of Well Q1, with the lithology dominated by gritstone and medium sandstone. The main strike of fractures in the well is nearly NW and NE, with an average fracture aperture of 0.043 mm. The principal fracture strikes in low-productivity wells are not consistent with the maximum principal stress direction, and the fracture apertures are smaller than those in middle-productivity wells. The fracture strike and dip angle determine the fracture aperture, and the fracture aperture further determines the tight gas production of an individual well. In this study, the fractures apertures of wells Q9, Q15 and Q5 are regarded as approximately equal. However, there is a relatively huge disparity in their fracture density, and this decrease could also be ascribed to the decreasing content of fine sandstone and siltstone. These production characteristics indicate that the intensity of natural fractures could be the critical factor that influences initial gas production, and the effectiveness and intensity of natural fractures are the key factors for keeping the production of tight gas high and stable.
The relationship between fracture density and initial gas production.

The relationship between tight gas daily productivity and fracture attributes

6. Conclusions
-
(1) The main natural fractures are tectonic fractures and diagenetic fractures, in which tectonic shear fracture and bedding fracture are the main types, respectively. There are four groups of dominant fractures: E–W, NE–SW, N–S and NW–SE strike.
-
(2) Three stages of tectonic fractures were formed during the late Indosinian, the middle and late Yanshanian, and the Himalayan periods, and two stages of bedding fractures were formed in the middle and late Indosinian and late Yanshanian periods. The primary bedding fracture and the second-stage tectonic fracture formed the early fracture network and determined the charging and short-distance migration of tight gas. The late fracture network system was formed by the reopening of bedding fractures and the third-stage tectonic fractures, enabling the adjustment and transformation of the original gas reservoir; the seepage ability of the tight reservoir was restored.
-
(3) The effectiveness of the natural fracture mainly depends on the direction of current maximum principal stress and the dip angle of the fractures. When fractures strike E–W and the dip angle is > 30°, the effectiveness of the fracture of the reservoir reaches its highest level. The development strength and aperture of natural fractures are the fundamental factors that determine the tight gas production.
Acknowledgment
This study was financially supported by the National Science and Technology Major Project of China (grant no. 2016ZX05003001). We are particularly grateful to Professor Olivier Lacombe and the anonymous reviewers for their constructive comments and suggestions, which significantly improved this manuscript.