


1. Introduction
Fluid structure interaction (FSI) is an interaction of a movable and/or deformable structure with an external or internal fluid flow. The external flow over a structure is widely encountered in nature as well as in numerous engineering applications. In particular, external flow over a bluff body results in an unsteady fluid flow that exerts unsteady aerodynamic forces – leading to flow-induced vibration (FIV) of a flexibly/elastically mounted structure. Flow-induced vibrations are usually regarded as undesired phenomena due to their potential to cause structural failure. However, more recently, they have been effectively utilised for energy harvesting from wind, ocean and river currents (Allen et al. Reference Allen and Smits2001; Bernitsas Reference Bernitsas2016; Armandei & Rostami Reference Rostami and Armandei2017).
For energy harvesting from various flow-induced motions, Armandei & Rostami (Reference Rostami and Armandei2017) reviewed various flow-induced motion-based energy harvesters with corresponding benchmark technologies, such as vortex-induced vibration (VIV), translation and torsional galloping, buffeting, aerofoil flutter and auto-rotation. For energy harvesting from the translation motion of cylinders, VIV usually occurs at low incoming flow speed whereas galloping occurs at high flow speed. Although the low flow speed of VIV makes it more favourable for energy harvesting from low-speed flow rivers and ocean currents, these VIV-based energy converters deliver adequate oscillation amplitude only for a limited range of flow speed (lock-in range). Therefore, to achieve vibration over a wider range of incoming flow speed, techniques such as fluid multi-structure interaction (FmSI) (Bernitsas Reference Bernitsas2016; Ding, Qunfeng Zou & bo Reference Ding, Zou, Zhang and Wang2018) and passive turbulence control (Park, Kumar & Bernitsas Reference Park, Kumar and Bernitsas2013) have been utilised to induce galloping at larger flow speed. For an FmSI problem on multiple cylinders in a tandem arrangement, the flow interference from a nearby structure has been reported to significantly enhance the energy harvesting, as compared with a single VIV converter (Bernitsas Reference Bernitsas2016). Further, Lee et al. (Reference Lee, Qi, Zhou and Lua2019) also found that a circular cylinder with flow interference, from a formation of stationary cylinders, can generate significantly higher piezoelectric power than an isolated cylinder in cross-flow wind. The FmSI can be exploited for enhancement of vibrational amplitude and widening of the corresponding range of flow speed. The characteristics of FmSI-based vibrational enhancement and associated flow interference physics are of interest in the present work.
The VIV of an elastically mounted isolated circular cylinder serves as a fundamental model of FIV. It has been extensively discussed in the review works by Govardhan & Williamson (Reference Sarpkaya2004) and Sarpkaya (Reference Williamson and Govardhan2004), and in books by Blevins (Reference Blevins1977) and Païdoussis et al., (Reference Païdoussis, Price and De Langre2010). Influence of various parameters such as the mass-damping parameter (Khalak & Williamson Reference Khalak and Williamson1999; Govardhan & Williamson Reference Govardhan and Williamson2002), reduced velocity
 $U^*$
(Singh & Mittal Reference Singh and Mittal2005; Prasanth & Mittal Reference Prasanth and Mittal2008) and Reynolds number (Sarpkaya Reference Sarpkaya2004) on VIV has been comprehensively investigated in the literature. In VIV, large amplitude oscillations are observed when the vortex shedding frequency synchronises with the natural frequency of the cylinder, and the associated range of reduced velocity
 $U^*$
is called the lock-in or synchronisation range of VIV. During the lock-in range, an in-phase (
 $\phi = 0^\circ$
) to anti-phase (
 $\phi = 180^\circ$
) jump between displacement and lift occurs when the oscillation frequency of the oscillatory system equals its natural frequency (Sarpkaya Reference Sarpkaya2004; Prasanth & Mittal Reference Prasanth and Mittal2008). Prasanth & Mittal (Reference Prasanth and Mittal2008) also referred to this phase jump as the phenomenon of VIV to self-limit the maximum amplitude of oscillation.
For galloping-like high amplitude, low-frequency and in-phase oscillation of a circular cylinder, various flow mechanisms have been reported recently such as thermal buoyancy by Garg, Soti & Bhardwaj (Reference Garg, Soti and Bhardwaj2019), splitter plate attached to a cylinder by Sahu et al. (Reference Sahu, Furquan, Jaiswal and Mittal2019), proximity/wake interference by Bokaian & Geoola (Reference Bokaian and Geoola1984a
,Reference Bokaian and Geoola
b
) and forced rotation by Vicente-Ludlam et al., (Reference Vicente-Ludlam, Barrero-Gil and Velazquez2018). These mechanisms generate unsteady aerodynamic forces on the cylinder with varying angles of attack of the incoming flow, which is caused by the relative velocity of the cylinder with respect to the incoming flow. For non-axisymmetric prisms such as D-section and triangular cylinders, the angle of attack-based velocity-dependent negative damping (galloping instability) is primarily caused by the asymmetric shape and mechanical properties of oscillating system (Païdoussis et al. Reference Païdoussis, Price and De Langre2010). Whereas, for a circular cylinder, an active or passive control is needed to induce galloping instability. For a circular cylinder with an attached rigid splitter plate, Sahu et al., (Reference Sahu, Furquan, Jaiswal and Mittal2019) found an intriguing vibration response consisting of VIV, steady region (vibrations completely suppressed) and galloping at small, intermediate and large
 $U^*$
, respectively. They suggested that attaching a rigid plate destroys the axisymmetry of the circular cylinder. For proximity interference in a FmSI problem, the orientational changes of free-stream flow on an oscillating cylinder occurred due to flow interference from a nearby structure, which has also been reported to cause flow in the gap between two structures (Zdravkovich Reference Zdravkovich1981; Mittal & Sharma Reference Mittal and Sharma2022). For an elastically mounted cylinder under wake interference from an upstream cylinder, Bokaian & Geoola (Reference Bokaian and Geoola1984b
) found combined VIVgalloping, separated VIV–galloping and pure galloping for smaller streamwise spacing of
 $G^* \leqslant 3.0$
while vortex resonance (VIV) was observed for larger
 $G^* \gt 3$
. The term wake-induced galloping (WIG) was first reported in the experimental study by Bokaian & Geoola (Reference Bokaian and Geoola1984b
) – for large amplitude oscillation reminiscent of galloping. Since the mechanism behind large amplitude oscillation is not the same as pure galloping of a non-axisymmetric prism.
Proximity-induced galloping (PIG) is galloping-like (large amplitude and low frequency) vibration of an elastically mounted cylinder due to proximity interference from a downstream structure. For an identical stationary cylinder downstream, the experimental study of Bokaian & Geoola (Reference Bokaian and Geoola1984a
) was the first to find large amplitude galloping-like vibrations (PIG) for smaller gap
 $G^* \leqslant 0.75$
and VIV-type vibration response for larger gap
 $G^* \gt 1.0$
. Kim et al. (Reference Kim, Alam, Sakamoto and Zhou2009) also found similar transition with decreasing gap from
 $G^* = 1.2$
to
 $G^* = 0.3$
. Recently, for a flexible splitter plate downstream at various cylinder–plate gaps, Mittal & Sharma (2022) presented the flow dynamics in the gap between two structures and proposed two flow regimes: first, oscillating wake flow at larger gap
 $G^* \geqslant 1.0$
that leads to VIV type of vibration response; and second, onset of gap flow at smaller gap
 $G^* \leqslant 0.5$
that leads to the PIG vibrations. The gap flow in the cylinder–plate gap was found to be the driving mechanism of the large amplitude PIG vibration of the upstream cylinder. With increasing reduced velocity
 $U^*$
, the PIG amplitude response consists of a rapid increase followed by an asymptotic variation at larger
 $U^*$
as compared with a monotonic increase for the pure-galloping response of non-axisymmetric galloping bodies (Zhao, Hourigan & Thompson Reference Zhao, Hourigan and Thompson2018; Zhu, Li & Wang Reference Zhu, Li and Wang2020; Sharma, Garg & Bhardwaj Reference Sharma, Garg and Bhardwaj2022). Further, with a decreasing gap
 $G^*$
between two structures, a similar transition in vibration response from VIV to PIG has been observed for a cylinder with a stationary vertical square plate downstream (Su et al. Reference Su, He, Zhang and Feng2022), a rounded-square cylinder (Mittal, Abhishek & Sharma Reference Mittal, Abhishek and Sharma2023) and a triangular cylinder (Abhishek, Saha & Sharma Reference Abhishek, Saha and Sharma2024) with a rigid splitter plate downstream. Borazjani & Sotiropoulos (Reference Borazjani and Sotiropoulos2009) also reported a flow phenomena in the gap between two elastically mounted cylinders in tandem arrangement at
 $G^* = 0.5$
. They reported that the onset of gap flow at
 $U^* = 5$
results in a transition, where the amplitude of the rear cylinder becomes larger than that of the front cylinder.
For FIV of a cylinder with proximity interference from a nearby structure, the above comprehensive literature survey suggests that the gap flow between the two cylinders is key for large amplitude and low-frequency galloping-like oscillations at relatively smaller gaps. For WIG of a cylinder, the gap-flow switching and vortex impingement-based galloping mechanism has been thoroughly investigated by several authors (Zdravkovich Reference Zdravkovich1988; Assi Reference Assi2014). For proximity interference from a downstream cylinder, while most of the studies mentioned above (Bokaian & Geoola, Reference Bokaian and Geoola1984a
; Kim et al. Reference Kim, Alam, Sakamoto and Zhou2009; Nishi et al. Reference Nishi, Ueno, Nishio, Quadrante and Kokubun2014) are experimental and focus on vibrational characteristics at relatively high Reynolds number
 $Re$
, gap-flow characteristics (between the two cylinders) and flow mechanisms associated with the vibrational responses requires further investigation. Moreover, the nature of proximity-induced galloping instability (PIG) generation also needs investigation, as compared with galloping instability during vibration of a non-axisymmetric cylinder. Thus, for a comprehensive study on the effect of gap flow on the PIG, both quantitative and qualitative analyses of the gap flow are presented in this study. Focus of the present study is on the proximity interference-induced transitions of the gap-flow dynamics and associated flow mechanisms and vibrational responses – with varying cylinder–cylinder gap
 $G^*$
over a range of
 $U^*$
at a constant Reynolds number
 $Re = 100$
.
The present study addresses several fundamental aspects missing in the literature: (i) exploration of various vibrational responses of the upstream cylinder, under the effect of various gap
 $G^*$
-based variations in the proximity interference; (ii) the relationship between gap-flow profile-based flow regimes in the gap between two cylinders and various vibrational responses of the upstream cylinder; (iii) quantification of gap-flow rate and its correlation with associated vibrational response; and (iv) establishing a robust flow mechanism for generation of proximity-induced galloping instability as well as origin of a novel staggered vibrational response at the smallest gap (
 $G^*\leqslant 0.3$
).
Computational set-up for flow-induced transverse vibration of an elastically mounted rigid cylinder with a identical stationary cylinder downstream.

2. Physical and computational set-up
For the physical set-up of the present FmSI problem, figure 1 shows a free-stream flow across an elastically mounted cylinder with an identical stationary cylinder downstream. The figure shows that the upstream cylinder is connected with a spring (stiffness
 $k$
) and a damper (damping coefficient
 $c$
) in parallel so that the cylinder is free to oscillate in the transverse direction. Further, the gap
 $G^*$
is a non-dimensional distance between the trailing and leading edges of the upstream and downstream cylinders, respectively. The diameter
 $D$
of the cylinder and the free-stream velocity
 $U_\infty$
are considered as the length and velocity scales, respectively.
Figure 1 also shows the computational set-up and non-dimensional boundary conditions for the present numerical study. The inlet boundary has a free-stream velocity
 $U_\infty$
along with zero transverse velocity. Like any computational study for an external flow over a body, the length and height of the domain are considered large enough for physically realistic fully developed and free-slip flow boundary conditions at the outlet and the transverse boundaries, respectively.
3. Mathematical, numerical and parametric details
3.1. Mathematical model
For the present FmSI problem, the fluid dynamics is modelled by the Navier–Stokes equations and the vibrational dynamics (of the elastically mounted cylinder) is modelled by a linear oscillator equation. The fluid–structure interface dynamics is governed by an interface boundary condition. Non-dimensional form of the governing Navier–Stokes equations are given as
 \begin{equation} \nabla .\boldsymbol{V}^{*}=0, \end{equation}
 \begin{equation} \frac {\partial \boldsymbol{V}^{*}}{\partial t^*}+(\boldsymbol{V}^{*}.\nabla ) \boldsymbol{V}^{*}=-\nabla p^*+ \frac {1}{Re} {\nabla }^2 \boldsymbol{V}^{*}, \end{equation}
where
 $\boldsymbol{V}^{*}=({\boldsymbol{u}}/u_{\infty })$
is the non-dimensional velocity vector,
 $p^*=(p/ \rho _f {u_\infty }^2)$
is the non-dimensional pressure and
 $Re(=\rho _f u_\infty D/{\mu })$
is the Reynolds number. Here, the dimensional variables
 $\boldsymbol{u}$
,
 $p$
,
 $\rho _f$
and
 $\mu$
represent velocity, pressure, fluid density and viscosity, respectively.
For the vibrational dynamics, the governing linear spring–mass–damper oscillator equation is given as
 \begin{equation} \ddot {y^*}+ \frac {4\pi \zeta }{U^*} \dot {y^*}+\left (\frac {2\pi }{U^*}\right )^2 y^* = \frac {2C_{l}}{\pi m^*}, \end{equation}
where
 $\ddot {y^*}$
,
 $\dot {y^*}$
and
 $y^*$
represent non-dimensional acceleration, velocity and displacement, respectively. Further,
 $C_l=F_y/(({1}/{2}){\rho }_f {u_\infty }^2 D)$
is the lift coefficient,
 $U^* = U_{\infty }/(f_n D)$
is the reduced velocity,
 $\zeta$
is the damping ratio and
 $m^* = m_c/m_d$
is the mass ratio. Here, the dimensional parameters
 $f_n$
,
 $m_c$
and
 $m_d$
are natural frequency, mass of cylinder and mass of fluid displaced by the cylinder, respectively. Also,
 $F_y$
is the transverse force acting on the oscillating cylinder.
At the fluid–structure interface, the solid and fluid velocity should be continuous; given (Mittal & Sharma Reference Mittal and Sharma2022) as
 \begin{equation} \boldsymbol{V}^*_{s,int} = \frac {dy^*}{dt} = \boldsymbol{V}^*_{f,int}, \end{equation}
where
 $\boldsymbol{V}^*_{s,int}$
and
 $\boldsymbol{V}^*_{f,int}$
are non-dimensional solid and fluid velocity at the interface, respectively.
3.2. Numerical methodology
The present work uses a levelset function-based immersed interface method (LS-IIM) that was proposed in our research group (Thekkethil & Sharma Reference Thekkethil and Sharma2019). A physical law-based finite volume method (Sharma Reference Sharma2022) is used for the flow solver. Further, the LS-IIM solver uses a timewise fixed, non-uniform and non-body-fitted Cartesian grid for the flow solver. The present method uses a levelset function-based implementation of the interfacial boundary conditions. The flow solver uses the Quadratic Upwind Interpolation for Convective Kinematics scheme for the advection term and the central difference scheme for the diffusion term. Solution algorithm for the present flow solver can be found in the work of Thekkethil & Sharma (Reference Thekkethil and Sharma2019, Reference Thekkethil and Sharma2020).
Non-uniform Cartesian grid distribution throughout the computational domain with uniform fine grid size of 0.025. The inset figure present enlarged view of the mesh around the cylinders.

3.3. Code validation and grid independence study
For the present study, figure 2 shows a Cartesian grid that consists of a uniform fine grid
 $\delta$
near the structure, a uniform coarse-grid
 $\varDelta$
near the outer boundaries and a hyperbolic stretching function-based non-uniform grid in the intermediate region. Table 1 presents a grid independence study at
 $G^* = 0.5$
and
 $U^* = 10$
– corresponding to almost maximum amplitude
 $A^*$
found in the present work. After comparing the results in the table, the mesh
 $M_2$
(with
 $\delta = 0.025$
and
 $\Delta t = 0.005$
) is considered sufficiently small for accurate results, and used in the present simulations.
The FIV of an elastically mounted cylinder with a stationary cylinder downstream at
 $Re = 100$
,
 $m^*\,{=}\,2$
,
 $\zeta = 0.005$
,
 $G^* = 0.5$
and
 $U^* = 10$
, with
 $\delta$
as the uniform fine grid near the cylinder and
 $\Delta t^*$
as the time step. Further, the non-dimensional results are presented here with
 $A^*$
as vibrational amplitude,
 $f^*$
as oscillation frequency,
 $C'_{l}$
as root-mean-square lift coefficient and
 $\bar {C_d}$
as mean drag coefficient.

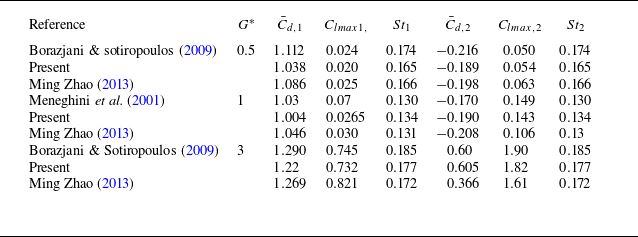
The present LS-IIM based in-house code has been validated for several benchmark problems on FSI by Thekkethil & Sharma (Reference Thekkethil and Sharma2019), and used for hydrodynamic investigations of fish-like locomotion of hydrofoils by Thekkethil et al., (Reference Thekkethil, Sharma and Agrawal2018, Reference Thekkethil, Sharma and Agrawal2020). Further, the in-house code was used for FmSI of a fixed or elastically mounted cylinder with a downstream flexible splitter plate in the work of Mittal & Sharma (Reference Mittal and Sharma2021, Reference Mittal and Sharma2022). In the present work, further validation study is presented for two problems: first, flow across two stationary cylinders in tandem arrangement; second, VIV of an elastically mounted isolated cylinder. Good agreement between the present and published results is shown in table 2 for the first and figure 3 for the second problem. Further, for the second problem, the present vibrational amplitude
 $A^*$
is closer to the result of Borazjani and Sotiropoulos (Reference Borazjani and Sotiropoulos2009), with a deviation of less than 4.3 %.
For flow over two stationary cylinders in tandem arrangement at various gap
 $G^*$
and
 $Re = 200$
, present and published results for mean drag coefficient
 $\bar {C_d}$
, amplitude of lift coefficient
 $C_{l,max}$
and Strouhal number
 $St$
of the two cylinders. Here, subscripts 1 and 2 represent the upstream and downstream cylinders, respectively.

For VIV of an elastically mounted isolated cylinder at
 $Re = 150$
,
 $m^* = 2$
and
 $\zeta = 0$
, present and published results for variation of vibrational amplitude
 $A^*$
with increasing reduced velocity
 $U^*$
.

3.4. Parametric details
For the effect of the downstream cylinder-induced proximity interference on FIV of an elastically mounted cylinder, the present parametric study considers various values of the cylinder–cylinder gap
 $G^*(=0.1{-}2.5)$
and reduced velocities
 $U^* (= 3{-}20)$
, and a constant value of the other non-dimensional governing parameters; given as gap ratios
 $G^*$
: 0.1, 0.3, 0.5, 1.0, 1.5, 2.0, 2.5, reduced Velocity
 $U^*$
: 3–20 at a constant Reynolds number
 $Re = 100$
, mass ratio
 $m^* = 2$
and damping ratio
 $\zeta = 0.005$
.
The effect of the above non-dimensional input parameters on vibrational characteristics is presented in terms of non-dimensional amplitude
 $A^*$
, time-averaged or mean displacement
 $\bar {y^*}$
, frequency
 $f^*$
, phase difference
 $\phi$
(between the displacement
 $y^*$
and lift coefficient
 $C_{l}$
of the oscillating cylinder) and instantaneous non-dimensional power
 $\beta$
given as
 \begin{align} A^* &= (y^*_{max}\,{-}\,y^*_{min})/2;\ \;\bar {y^*}\,{=}\,\frac{1}{nT^*}\!\int _{t^*}^{t^*+nT^*}\! y^* {\rm d}t^*;\ \; f^*\,{=}\,\frac {f_y}{f_n};\ \;f^*_{st}\,{=}\,\frac{f_{st}}{f_n};\ \ \beta = 0.5 C_{l} \dot {y^*}, \end{align}
where
 $y^*_{max}$
is the maximum and
 $y^*_{min}$
is the minimum non-dimensional displacement. Further,
 $f_y$
is oscillation frequency,
 $f_n$
is the natural frequency of the cylinder,
 $f^*_{st}$
is the non-dimensional frequency of vortex shedding of an upstream stationary cylinder (for two cylinders in tandem arrangement) and
 $\dot {y^*}$
is the velocity of the cylinder. Also,
 $T^*$
is the non-dimensional time period of an oscillation cycle and
 $n$
is total number of cycles – considered for the time averaging.
Further, coefficients of pressure
 $C_p ({=}P/({1}/{2})\rho _f U^2_{\infty } D)$
and skin friction
 $C_f ({=}\tau/({1}/{2})\rho _f U^2_{\infty } D)$
) around the surface of the cylinder are computed – to present the angular position
 $\theta$
of separation points and the front stagnation point on the cylinder surface. Furthermore, the total lift coefficient
 $C_l$
is presented by considering two components (Williamson & Govardhan Reference Williamson and Govardhan2004; Sharma et al. Reference Sharma, Garg and Bhardwaj2022): a potential lift coefficient
 $C_{l,p} ({=}{\kern-2pt}-{\kern-2pt}2C_a S \ddot {y^*}$
) that is attributed to potential added mass of the cylinder, and a vortex lift coefficient
 $C_{l,v} (=C_l-C_{l,p})$
originating from the vorticity dynamics. Here, for the circular cylinder with diameter
 $D=1$
, the potential added mass coefficient
 $C_a=1$
and non-dimensional cross-sectional area
 $S=\pi /4$
. This dissection of
 $C_l$
acknowledges the construction of a flow solution by combining a potential flow field with a velocity field linked to vorticity.
For two structures in tandem arrangement, previous FIV studies (Zdravkovich Reference Zdravkovich1988; Borazjani & Sotiropoulos Reference Borazjani and Sotiropoulos2009; Mittal & Sharma Reference Mittal and Sharma2022; Sharma & Bhardwaj Reference Sharma and Bhardwaj2023) indicated a strong dependence of FIV response on qualitative characteristics of the gap flow – flow within the gap between the two structures. In the presents study, we recognised the importance of quantifying the gap flow in terms of volumetric flow rate
 $Q^*_g$
(within the cylinder–cylinder gap), and presented a comprehensive analysis of gap-flow characteristics and their effect on the various types of FIV responses.
Schematic to illustrate the present methodology, for computation of non-dimensional gap-flow rate
 $Q^*_g$
– along the line joining the two cylinders at two different positions of the vibrating cylinder.

For computation of
 $Q^*_g$
, called hereafter the gap-flow rate, figure 4 presents a schematic representation of
 $Q^*_g$
that is dependent on the relative position of the two cylinders. For an instantaneous position
 $y^*$
of the upstream cylinder when the leading edge of the downstream cylinder is exposed to the free-stream flow, figure 4(a) shows that
 $Q^*_g$
is sum of the streamwise
 $Q^*_1$
and transverse
 $Q^*_2$
flow rates along the vertical (
 $\Delta y^*$
) and horizontal (
 $\Delta x^*$
) lines, respectively. Whereas, for the other
 $y^*$
, figure 4(b) shows that
 $Q^*_g$
is equal to the vertical flow rate
 $Q^*_2$
through the horizontal line
 $\Delta x^*$
. Also, note from the figure that the instantaneous
 $Q^*_g$
is defined such that it considers the flow across a surface that corresponds to a line joining the cell centres of the two cylinders; shown as a red line in the figure. Further,
 $Q^*_g$
oriented in the upward and downward directions in the gap are considered as positive and negative, respectively.
4. Flow-induced Vibration characteristics
The presence of the downstream cylinder leads to a proximity interference effect on FIV characteristics of the upstream cylinder. For various gaps
 $G^*$
between the two cylinders, the proximity interference-induced FIV characteristics are presented here in terms vibrational amplitude
 $A^*$
, mean displacement
 $\bar {y^*}$
, frequency of oscillation
 $f^*$
, phase difference
 $\phi$
(between displacement
 $y^*$
and lift coefficient
 $C_l$
) and the root-mean-square (r.m.s.) value of the coefficient of total lift coefficient
 $C_{l,rms}$
and vortex lift coefficient
 $C_{lv,rms}$
.
Before presenting the proximity interference-induced FIV characteristics, for the no-proximity case, § 4.1 presents FIV characteristics along with its branchwise demarcation – for VIV of an isolated cylinder. Thereafter, for the present proximity interference cases at various
 $G^*= 0.1{-}2.5$
, § 4.2 presents four types of amplitude
 $A^*$
response and mean displacement
 $\bar {y^*}$
response with increasing reduced velocity
 $U^*$
. Further, for a representative
 $G^*$
within each
 $A^*$
response, § 4.3 presents a more comprehensive FIV characteristics along with a branchwise demarcation.
4.1. The FIV characteristics of an isolated cylinder
For the no proximity interference case of an isolated cylinder, with increasing
 $U^*$
, figure 5 shows the well reported increasing–decreasing trend of
 $A^*$
and
 $C_{l,rms}$
, along with an in-phase to anti-phase jump in the phase difference
 $\phi /\phi _{v}$
(between the temporal variation of
 $C_l/C_{lv}$
and cylinder displacement
 $y^*$
). Further, the figure shows a demarcation of the FIV response into three branches – initial branch (IB,
 $U^* = 3.5{-}4.0$
), upper branch (UB,
 $U^* = 4.5{-}5.5$
) and lower branch (LB,
 $U^* = 6{-}8$
) – in between the initial and final de-synchronisation regimes at small and large
 $U^*$
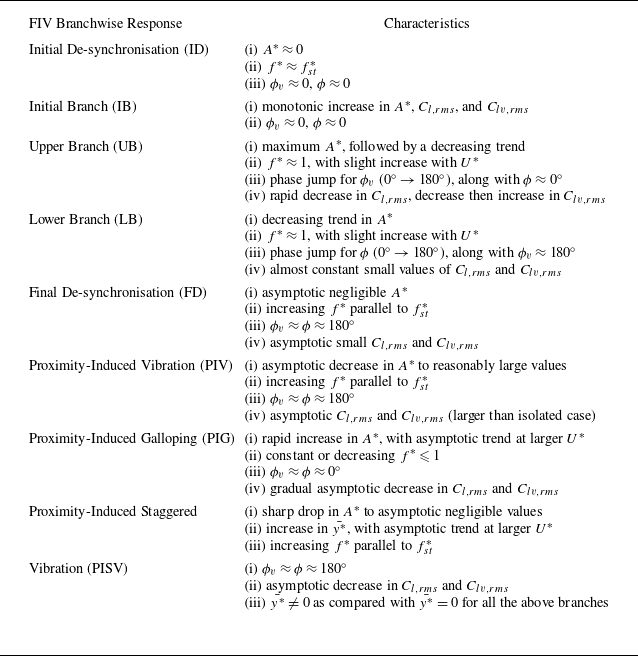
, respectively. These branchwise FIV response along with criteria for the demarcations are well reported in the literature for the isolated cylinder (Govardhan & Williamson Reference Govardhan and Williamson2000; Sharma et al. Reference Sharma, Garg and Bhardwaj2022) and are presented here in table 3. Note that the work of Govardhan & Williamson (Reference Govardhan and Williamson2000) illustrated the difference between the two-branch (IB, LB) response at high mass damping (
 $m^* \zeta$
) and three-branch response (IB,UB,LB) at low
 $m^* \zeta$
, where upper branch is associated with
 $0^\circ$
to
 $180^\circ$
transition in the vortex phase (
 $\phi _{v}$
) along with an amplitude jump. This amplitude jump in UB is reported for low mass-damping systems at a relatively high
 $Re$
(
 $3500{-}10\,000$
). Whereas, for the low
 $Re$
(
 ${\lt } 200$
) in the present as well as published studies, a continuous amplitude response has been observed for the UB (Prasanth & Mittal Reference Prasanth and Mittal2008; Sharma et al. Reference Sharma, Garg and Bhardwaj2022).
For VIV of an isolated cylinder at
 $Re = 100$
,
 $m^*=2$
and
 $\zeta = 0.005$
, variation of non-dimensional amplitude
 $A^*$
, frequency
 $f^*$
, phase
 $\phi _{v}$
between displacement and vortex lift coefficient
 $C_{l,v}$
, phase
 $\phi$
between displacement and total lift coefficient
 $C_{l}$
, r.m.s. value of the lift coefficients (
 $C_{lv,rms}$
,
 $C_{l,rms}$
) with increasing reduced velocity
 $U^*$
. Here,
 $f^*_{st}$
is the vortex shedding frequency of the stationary case. Further, ID: initial de-synchronisation, IB: initial branch, UB: upper branch, LB: lower branch, and FD: final de-synchronisation.

For isolated and proximity interference-based vibrations of a circular cylinder at smaller damping ratio
 $\zeta \lesssim 0.05$
, characteristics of the trends and values of the various parameter-based branchwise demarcations of the FIV response. Note that the lift and drag coefficients are for the upstream vibrating cylinder.

For the initial and final de-synchronisations, note from the table that the amplitude
 $A^*\,{\approx}\,0$
while the frequency ratio
 $f^*$
of the vibrating cylinder is close to the vortex shedding frequency
 $f^*_{st}$
of the stationary cylinder. Further, the table shows a rapid increase in
 $A^*$
,
 $C_{l,rms}$
and
 $C_{lv,rms}$
for the IB while the UB corresponds to a decreasing trend in
 $A^*$
,
 $C_{l,rms}$
and
 $C_{lv,rms}$
. The lock-in region consists of UB and LB, where the oscillation frequency shows a constant slope smaller than
 $f^*_{st}$
and remains close to the natural frequency with
 $f^* \approx 1$
; marked as the lock-in region in figure 5. Note from the figure that
 $f^*=f^*_{st}$
in the Initial de-synchronization branch while
 $f^* \approx 1$
in UB and LB – corresponding to the lock-in region. The transition from
 $f^*=f^*_{st}$
to
 $f^* \approx 1$
occurs in the intermediate IB, leading to a beats-like temporal signal in displacement and lift of the cylinder (Prasanth & Mittal Reference Prasanth and Mittal2008; Soti et al. Reference Soti, Zhao, Thompson, Sheridan and Bhardwaj2018; Sharma et al. Reference Sharma, Garg and Bhardwaj2022). Further, for the IB, the dominant frequency is
 $f^*=f^*_{st}$
and
 $f^* \lt 1$
, i.e. non-lock-in. Thus, the IB is not considered here as a part of lock-in; consistent with the previous studies (Soti et al. Reference Soti, Zhao, Thompson, Sheridan and Bhardwaj2018; Sharma et al. Reference Sharma, Garg and Bhardwaj2022). The lock-in begins at the UB with single dominant frequency around
 $f^*\approx 1$
and onset of the
 $\phi_{v}$
transition from
 ${\sim}0^\circ$
to
 ${\sim}180^\circ$
. Further, within UB, the onset of the
 $\phi _{v}$
jump at
 $U^* = 4.5$
is accompanied by a decrease in
 $A^*$
,
 $C_{l,rms}$
and
 $C_{lv,rms}$
. In the LB,
 $\phi _{v} \sim 180^\circ$
and
 $\phi$
undergoes the
 $0^\circ -180^\circ$
phase transition – with
 $\phi = 180^\circ$
demarcating the end of the lock-in region. It must be noted from the figure that the critical
 $U^* = 5$
and
 $U^* = 6.5$
, for phase-jump in
 $\phi _{v}$
and
 $\phi$
, corresponds to the minimum
 $C_{lv,rms}$
and
 $C_{l,rms}$
, respectively. It is interesting to notice from figure 5 that as
 $A^*$
reaches maxima in the IB, the vortex force transits to out of phase
 $\phi _{v} \sim 180^\circ$
(restoring in nature) that leads to the onset of decreasing trends in both
 $C_{l,rms}$
and
 $A^*$
. This suggest that the
 $\phi _{v}$
jump is the mechanism to self-limit the maximum amplitude of vibration in VIV, as reported by Prasanth & Mittal (Reference Prasanth and Mittal2008). Further, this is attributed to a gradual change in the timing of vortex formation which governs the top and bottom suction regions of the cylinder in a oscillation cycle.
4.2. Amplitude response of an elastically mounted cylinder under the effect of proximity interference
The VIV of an isolated cylinder serves as a base case with no proximity interference, and results in an increasing–decreasing
 $A^*$
-response; shown in figure 5(a) and also by the dashed line in figure 6(a). This trend of the
 $A^*$
versus
 $U^*$
variation is called VIV amplitude response.
Introducing a stationary cylinder downstream of an elastically mounted cylinder leads to proximity interference that increases with decreasing gap
 $G^*$
. Figure 6(a) shows that this proximity interference leads to modifications in the amplitude
 $A^*$
-response as compared with the VIV
 $A^*$
-response for an isolated cylinder. The modifications are seen at intermediate and larger values of
 $U^*$
(smaller stiffness of the mounted spring).
For larger gaps
 $G^* = 2.5{-}1.5$
, figure 6(a) shows a more gradual decay along with an increase in the proximity interference-induced enhancement in the asymptotic value of
 $A^*$
at larger
 $U^*$
. Further, for the larger gaps
 $G^* \geqslant 1.5$
, it is interesting to note from the figure that the deviation in
 $A^*$
begins at
 $U^* = 8$
– corresponding to the end of LB and lock-in region of VIV response (figure 5). Bokaian & Geoola (Reference Bokaian and Geoola1984a
) referred to this response at the larger gap as vortex resonance due to the phenomenon of vortex lock-in. However, as compared with vortex resonance or VIV of an isolated cylinder, figure 6(a) shows a significant modification in amplitude response caused by the proximity interference. Therefore, the amplitude response at larger
 $G^* \geqslant 1.5$
is called here proximity-induced modified VIV (PImVIV). Further, various studies with a downstream cylinder have referred to this amplitude response differently (Kim et al. Reference Kim, Alam, Sakamoto and Zhou2009; Alam et al. Reference Alam and Meyer2013; Nishi et al. Reference Nishi, Ueno, Nishio, Quadrante and Kokubun2014).
With further decrease in the gap
 $G^* \leqslant 1.0$
, figure 6(a) shows a significant deviation from the VIV response – indicating a substantial enhancement in the proximity interference effect. As compared with the PImVIV response at larger
 $G^* \geqslant 1.5$
, the figure for
 $G^*= 0.5$
shows a rapid-increase plateau type of
 $A^*$
– called in the literature the proximity-induced galloping (PIG) response (Bokaian & Geoola, Reference Bokaian and Geoola1984a
; Mittal & Sharma Reference Mittal and Sharma2022). Whereas, at an intermediate gap
 $G^* = 1.0$
, the figure shows a blend of PImVIV and PIG responses – called here the transitional PImVIV–PIG response. For
 $G^* = 1.0$
, the figure shows a rapid increase in
 $A^*$
for
 $U^* \leqslant 5$
, then decreases slightly at
 $U^* = 6$
, followed by slight increase until
 $U^* = 8$
(similar to PIG response) and finally a much more gradual decrease of
 $A^*$
at larger
 $U^*$
(similar to VIV response). Further, for the transitional response at
 $G^* = 1.0$
, notice that the asymptotic value of
 $A^*$
is much larger as compared with those in the PImVIV cases at
 $G^* \geqslant 1.5$
. The FIV characteristics and flow physics occurring during this transitional response are missing in the literature.
Effect of non-dimensional gap
 $G^*$
on variation of non-dimensional (a) vibrational amplitude
 $A^*$
and (b) mean value of displacement
 $\bar {y^*}$
of the upstream cylinder, with increasing reduced velocity
 $U^*$
. The schematic at top shows characteristics curve for VIV, PIG and combined PIG–PISV response at larger, intermediate and smaller
 $G^*$
. Further,
 $\bar {y^*} = 0$
for
 $G^* \geqslant 1.0$
and is not shown in (b).

For a much smaller gap
 $G^* = 0.3$
and 0.1, figure 6(a) shows the PIG response upto a critical
 $U^*_c$
and further increase in
 $U^*$
leads to a sudden drop in the amplitude. Also, figure 6(b) shows that the sudden drop in
 $A^*$
is accompanied by a non-zero mean displacement
 $\bar {y^*}$
of the cylinder as compared with
 $\bar {y^*} \approx 0$
for the two-sided symmetrical vibration (about the downstream cylinder) of the upstream cylinder. In these cases, the cylinder gets stuck on one side of the mean position and oscillates with a very small amplitude
 $A^*$
; and almost corresponds to flow across two stationary cylinders in staggered arrangement. Thus, these non-zero
 $\bar {y^*}$
cases at larger
 $U^*$
for smaller
 $G^* \leqslant 0.3$
are called here proximity-induced staggered vibration (PISV) while the overall
 $A^*$
-response is called combined PIG–PISV. For a symmetric tandem arrangement of two cylinders in close proximity, the staggered vibrations had been reported for the first time in the literature. Figure 6(b) shows an increasing trend of the staggered mean position
 $\bar {y^*}$
with increasing
 $U^*$
, along with a larger value of
 $\bar {y^*}$
for the much smaller
 $G^* = 0.1$
as compared with that for
 $G^* = 0.3$
. For the much larger
 $\bar {y^*}$
cases at the smallest
 $G^* = 0.1$
, it is interesting to note from figure 6(a) that
 $A^*$
of the staggered vibration is almost equal to that for an isolated cylinder case at
 $U^* \geqslant 14$
. Thus, at sufficiently larger value of the offset or
 $\bar {y^*}$
of the one-sided staggered vibration, the proximity effect is negligible and the upstream cylinder begins to oscillate similar to FIV of an isolated cylinder.
Transient behaviour of displacement
 $y^*$
of the cylinder during transition from symmetric-to-staggered vibration with increasing reduced velocity
 $U^*$
at (a)
 $G^* = 0.3$
and (b)
 $G^* = 0.1$
.

Figure 7 presents a transient behaviour of the transition from the two-sided symmetric vibration to one-sided staggered vibration at the smaller
 $G^* = 0.3$
and
 $0.1$
. For
 $G^*\,{=}\,0.3$
, figure 7(a) shows two-sided vibration at
 $U^* = 17.5$
and one-sided vibration at larger
 $U^* = 19$
. While, at intermediate
 $U^* = 18.5$
, a transient switching in the mean position
 $\bar {y^*}$
– from
 $\bar {y^*}\gt 0$
to
 $\bar {y^*}\lt 0$
– is seen for the one-sided staggered vibration. Such transient switching is not seen in figure 7(b) for the smaller gap
 $G^* = 0.1$
, with the two-sided vibration at
 $U^* = 9.7$
and the one-sided vibration at
 $U^* = 9.8$
. Due to a stronger influence of a proximity pressure (at the front stagnation point of the downstream cylinder) at smaller
 $G^*$
, the symmetric-to-staggered transition with
 $U^*$
is significantly sharper – within
 $U^* = 9.7{-}9.8$
for
 $G^* = 0.1$
as compared with
 $U^* = 17.5{-}19$
for
 $G^* = 0.3$
(figure 7).
The proximity interference effect on the vibration of an elastically mounted upstream cylinder has been studied for various types of downstream stationary structures: circular cylinder (Bokaian & Geoola, Reference Bokaian and Geoola1984a
; Kim et al. Reference Kim, Alam, Sakamoto and Zhou2009), vertical square plate (Su et al. Reference Su, He, Zhang and Feng2022) and splitter plate (Zhu et al. Reference Zhu, Li and Wang2020; Mittal & Sharma Reference Mittal and Sharma2022; Mittal et al. Reference Mittal, Abhishek and Sharma2023). These studies also reported the presently found transition from the PImVIV to PIG amplitude response – at closer proximity of the downstream structure. However, the present cylinder–cylinder system has several differences in vibrational response as compared with the cylinder–plate system (presented recently from our research group; see Mittal & Sharma Reference Mittal and Sharma2022 and Mittal et al. Reference Mittal, Abhishek and Sharma2023). For the present PImVIV response at larger gaps
 $G^*\geqslant 1.5$
, the present case in figure 6(a) shows larger peak amplitude
 $A^*_{max}$
(at
 $U^* = 5$
) as compared with the isolated cylinder case while the cylinder–plate system leads to an almost same value of
 $A^*_{max}$
(Mittal & Sharma Reference Mittal and Sharma2022). Thus, at larger
 $G^*$
, the
 $A_{max}$
of the cylinder is enhanced by the proximity of a cylinder here but not affected by proximity of the splitter plate. At larger
 $U^*$
, for the cylinder–plate system, Mittal & Sharma (Reference Mittal and Sharma2022) reported monotonic increase in
 $A^*$
with decreasing
 $G^*$
while such variation is observed here only up to
 $G^* = 0.5$
– due to onset of staggered vibration for
 $G^* \leqslant 0.3$
. The above discussed difference in the vibrational characteristics for the cylinder–cylinder and cylinder–plate systems suggests a substantial difference in the proximity interference mechanism – for a downstream bluff body (cylinder) here as compared with that for the more streamlined splitter plate.
For the cylinder–cylinder system, with decreasing
 $G^*$
, the experimental studies conducted by Bokaian & Geoola (Reference Bokaian and Geoola1984a
) (
 $Re = 1150{-}5950$
) and Kim et al. (Reference Kim, Alam, Sakamoto and Zhou2009) (
 $Re = 4365{-}74\,200$
) reported a similar amplitude transition of PImVIV to PIG. Nishi et al. (Reference Nishi, Ueno, Nishio, Quadrante and Kokubun2014) (
 $Re = 2480{-}15\,000$
) also reported a significant enhancement in the hydro-kinetic energy extraction at constant gap
 $G^* = 0.3$
, as compared with an isolated cylinder. Further, for PIG response, similar to the decrease of plateaued amplitude
 $A^*$
(at larger
 $U^*$
) with decreasing
 $G^*\leqslant 0.5$
(figure 6
a), Bokaian & Geoola (Reference Bokaian and Geoola1984a
) also reported a reduction in the plateaued PIG-response amplitude with decreasing
 $G^*$
from 0.25 to 0.09. However, they did not report staggered vibrations probably due to the smaller range of
 $U^*(\leqslant 6)$
considered in their experimental study. Su et al. (Reference Su, He, Zhang and Feng2022) also shows a similar decrease in amplitude
 $A^*$
of the cylinder with decreasing
 $G^*\leqslant 0.3$
, under the effect of a downstream vertical square plate (of dimensions
 $1.25D \times 1.25D \times 0.13 D$
). However, due to the smaller spanwise length of the square plate as compared with the very long cylinder here, no staggered vibrations were reported for the square plate, probably due to spanwise leakage of the flow in between the cylinder and plate. Further, at
 $G^* = 0.3$
, Kim et al. (Reference Kim, Alam, Sakamoto and Zhou2009) also did not report staggered vibration due to the large mass damping of the vibrating system. Similar to Bokaian & Geoola (Reference Bokaian and Geoola1984a
), with decreasing
 $G^*$
, the PIG vibration response here commences at larger
 $U^* = 4$
for
 $G^* \geqslant 1.0$
,
 $U^* = 5$
for 0.5 and 0.3 and
 $U^* = 6$
for 0.1 in figure 6(a) for the downstream cylinder case here while it remains almost same for a downstream splitter plate case (Mittal & Sharma Reference Mittal and Sharma2022). The above studies at low and high
 $Re$
show consistent trends in vibrational responses with decreasing
 $G^*$
– along with shifts in the
 $G^*$
for the onset of transition between the vibrational responses. This highlights the relevance of the present low Re-based laminar flow findings and proposed proximity interference-induced flow mechanisms to turbulent flows at higher Reynolds numbers.
For each of the four types of vibrational responses, with increasing reduced velocity
 $U^*$
, variation of non-dimensional (
 $a1{-}d1$
) amplitude
 $A^*$
and frequency
 $f^*$
, (
 $a2{-}d2$
) total phase
 $\phi$
and vortex phase
 $\phi _v$
(between displacement and total lift and vortex lift force) and (
 $a3{-}d3$
) r.m.s. value of total lift coefficient
 $C_{l,rms}$
and vortex lift coefficient
 $C_{lv,rms}$
for the vibrating cylinder. Further,
 $f^*_{st}$
is the vortex shedding frequency of the corresponding stationary configuration. Note that the results for the isolated cylinder are also presented with the dotted lines. Here, PIV: proximity-induced vibrations, PIG: proximity-induced galloping, and PISV: proximity-induced staggered vibrations.

4.3. The FIV characteristics of an elastically mounted cylinder with proximity interference from downstream cylinder
For each of the four amplitude responses, presented above, figure 8 shows vibrational characteristics separately for a representative case of the PImVIV, transitional PImVIV–PIG, PIG and combined PIG–PISV at
 $G^* = 2.0,1.0,0.5$
and 0.1, respectively. Similar to the branchwise demarcation of the FIV response for an isolated cylinder in figure 5, recently Sharma & Bhardwaj (Reference Sharma and Bhardwaj2023) presented such demarcations for two elastically mounted cylinders in tandem arrangements. They reported ID, IB, UB, LB, wake-induced vibration (at larger
 $G^* \geqslant 3$
), FD (at intermediate
 $G^* = 1.0$
) and a galloping-dominated regime (at smaller
 $G^* = 0.1$
) with increasing
 $U^*$
. They also reported changes in the range of various FIV branches with decreasing
 $G^*$
. Whereas, for the present proximity-induced vibrations of the upstream cylinder, table 3 shows the characteristics of various branchwise demarcations of the vibrational characteristics.
Out of five branches (ID, IB, UB, LB and FD) in the vibrational characteristics for isolated cylinder in figure 5, the proximity interference-based vibrational characteristics in figure 8 show four branches (ID, IB, UB, LB) at larger
 $G^* \geqslant 1.0$
, two branches (ID, IB) at intermediate
 $G^* = 0.5$
and only one branch (ID) at smaller
 $G^* = 0.1$
. Moreover, at larger
 $U^*$
, the figure shows additional branches: proximity-induced vibration (PIV) at
 $G^* \geqslant 1.0$
, PIG at
 $G^* = 0.5$
and PIG along with PISV at
 $G^* = 0.1$
. For PImVIV and the transitional response, note from the figure that the UB and LB are characterised by in-phase to anti-phase transition in
 $\phi _{v}$
and
 $\phi$
, respectively, similar to that for the isolated cylinder in figure 5. These phase jumps do not occur for PIG response; thus, UB and LB are not seen in figure 8(c,d). For an isolated cylinder, a unique relationship is found between
 $f^*$
and
 $f^*_{st}$
, with
 $f^* \gt f^*_{st}$
in the IB/UB while
 $f^* \lt f^*_{st}$
in the LB for circular cylinder (figure 5) and vice versa (with no UB) for a square cylinder (Lin & Alam Reference Lin and Alam2024). Whereas, for the present case, where
 $f^*_{st}$
corresponds to that of two stationary cylinders, such a unique relationship is not found (figure 8) and is thus, not presented in table 5 for the branchwise demarcation.
For PImVIV and transitional response at larger
 $G^* \geqslant 1.0$
, figure 8(a,b) shows that the PIV branch of vibrational characteristics corresponds to larger asymptotic values of
 $A^*$
,
 $C_{l,rms}$
and
 $C_{lv,rms}$
as compared with those for the FD branch of the isolated cylinder (figure 8 and table 3). Further, the figure shows that the increasing
 $f^*$
(parallel to the
 $f^*_{st}$
) is smaller for proximity interference cases as compared with that for the isolated cylinder, with
 $f^* \gt f^*_{st}$
in the PImVIV response and
 $f^* \lt f^*_{st}$
in the transitional response (figure 8
a,b). Additionally, figure 8(a,b) shows a smaller
 $C_{lv,rms}$
for the transitional (
 $G^*\,{=}\,1.0$
) as compared with the PImVIV (
 $G^* = 2.0$
) response – indicating decreased strength of the anti-phase force-generating vortex with decreasing
 $G^*$
.
The PIG branchwise response in figure 8(c,d) is characterised by an asymptotic increase (decrease) in
 $A^*$
(
 $C_{l,rms}$
and
 $C_{lv,rms}$
), along with an almost constant value of
 $f^*$
. The characteristics of the PISV branch are similar to the FD branch of an isolated cylinder (table 3) except for the mean displacement
 $\bar {y^*}\gt 0$
. Further, as VIV effects of the isolated cylinder dominate at smaller
 $U^*$
(
 $\leqslant 6$
),
 $\phi \approx 0^\circ$
for all gaps. As
 $U^*$
increases, proximity interference becomes more dominant over the VIV effects. Thus, with decreasing
 $G^*$
at larger
 $U^*$
(
 $\geqslant 12$
),
 $\phi \approx 180^\circ$
in the PIV branch (at
 $G^* = 2.0$
) undergoes transition to the
 $\phi \approx 0^\circ$
in the PIG branch (at
 $G^* = 0.5$
), and then transitions back to the
 $\phi \approx 180^\circ$
in the PISV branch at the smallest
 $G^* = 0.1$
. Note that the PIG response here corresponds to the asymptotic increase in
 $A^*$
, with increasing
 $U^*$
, as compared with a monotonic increase in
 $A^*$
for the galloping response of non-axisymmetric cylinders (Abhishek et al. Reference Abhishek, Saha and Sharma2024). Also, about the streamwise centreline of the downstream stationary cylinder, the PIV and PISV branches correspond to symmetric and asymmetric/staggered vibration of the upstream cylinder, respectively.
The above discussion implies that, for larger
 $U^*$
, the proximity interference leads to the transitions in the branchwise characteristics from the FD branch for the isolated cylinder to PIV, PIG and PISV (with decreasing
 $G^*$
). Moreover, as compared with figure 5 for an isolated cylinder, the branches of VIV such as IB, UB and LB become wider at larger gaps
 $G^* \geqslant 1.0$
while they becomes narrower and eventually disappear as the gap decreases to
 $G^* = 0.1$
. For various branchwise responses in figure 8, the next section presents a distinct flow physics – in terms of various gap-flow regimes and flow-separation characteristics.
For the top-most position of the vibrating cylinder, variation of local skin friction
 $C_f$
along with velocity vectors along the line
 $L^*$
( joining the centres of the two cylinders) for (a) isolated cylinder (velocity profile along a horizontal line), (b) PImVIV response at
 $G^* = 2.0$
, (c) transitional PImVIV–PIG response at
 $G^* = 1.0$
, (d) PIG response at
 $G^* = 0.5$
and (e) PISV response at
 $G^* = 0.1$
. The figure also presents the marked values of angular position
 $\theta _{f}$
for the front stagnation point and
 $\theta _{t}/\theta _{b}$
for the separation points at the top/bottom of the vibrating cylinder. Further, a schematic representation of the velocity vector and profile is also presented for the extreme positions of the cylinder.

5. Gap-flow regimes and flow-separation characteristics for the various types of FIV characteristics
For the VIV response of an isolated cylinder and a representative case for each of the four distinct types of proximity-induced responses, figure 9 shows a schematic representation and present simulation-based velocity vectors as well as its (velocity-magnitude) profile – along the line
 $L^*$
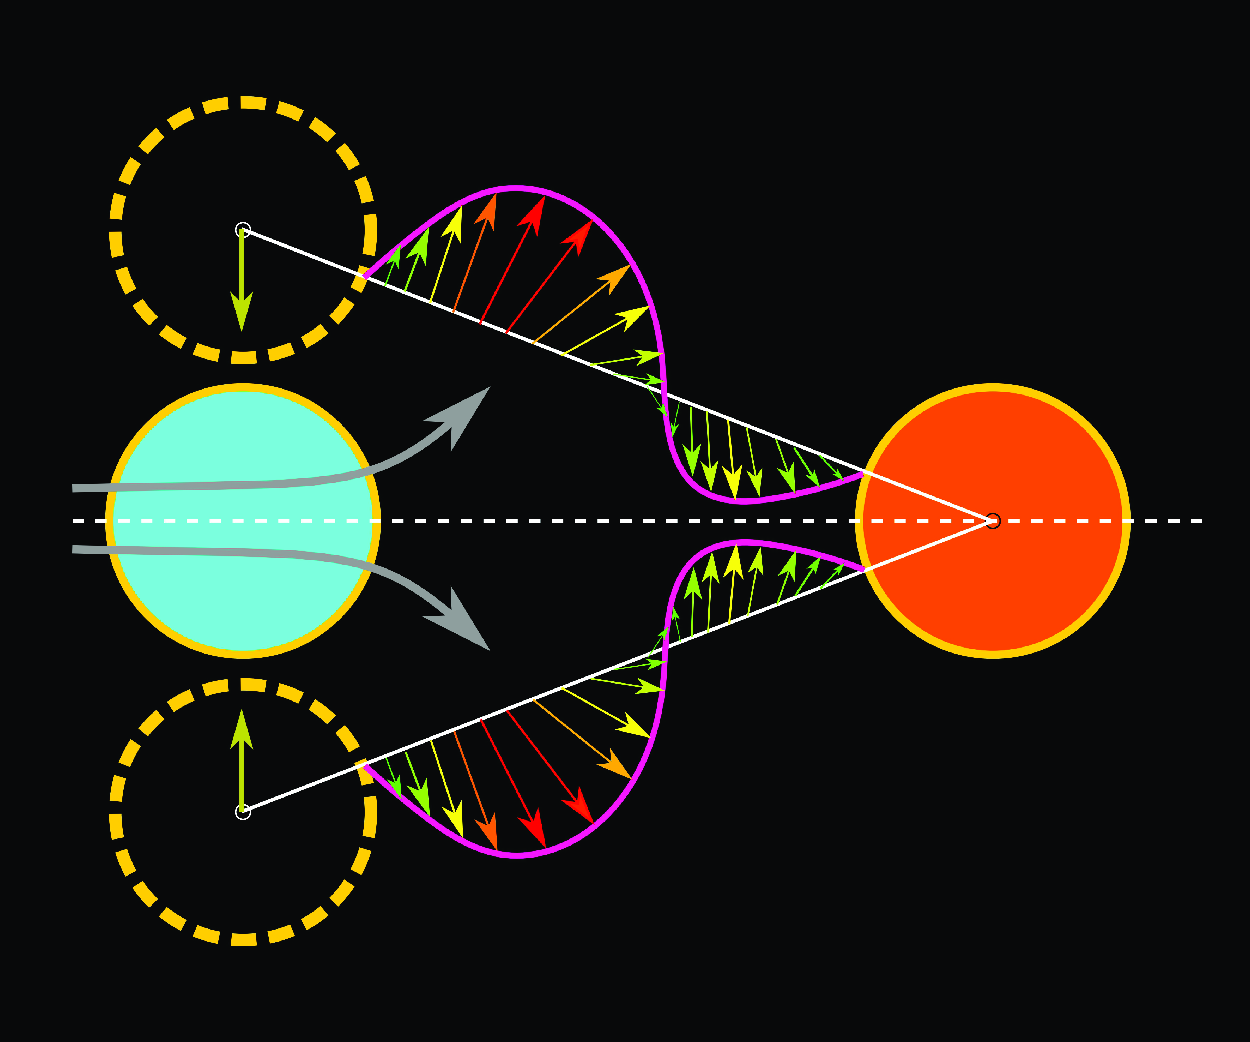
joining the centres of the cylinders. The velocity vectors and profiles along the cylinder–cylinder centreline, are presented here to characterise the flow within the cylinder–cylinder gap. Note that the figure shows the velocity that is instantaneous – corresponding to the top-most position of the cylinder. Within the cylinder–cylinder gap, figure 9(a,b) shows the velocity vector that is both upward and downward, i.e. bi-directional gap flow (BDGF) for the PImVIV response at larger
 $G^* = 2.0$
while only upward or uni-directional gap flow (UDGF) is seen for the PIG response at smaller
 $G^* = 0.5$
in figure 9(d). However, at an intermediate gap
 $G^* = 1.0$
, figure 9(c) shows the onset of transition from BDGF-to-UDGF that corresponds to transitional response. Moreover, it can be seen that the space-averaged angle
 $\bar {\alpha }$
of the velocity vectors is acute
 $\bar {\alpha }\lt 90^\circ$
for the transitional response while it is almost orthogonal
 $\bar {\alpha }\approx 90^\circ$
for the PIG response. Thus, the associated gap-flow regime is called here uni-directional non-orthogonal gap flow (UDnoGF) and uni-directional orthogonal gap flow (UDoGF) for the transitional and PIG responses, respectively. Further, for PImVIV and the transitional response
 $G^* \leqslant 1.0$
, the gap flow transitions from the BDGF to the UDnoGF regime with decreasing
 $G^*$
and increasing
 $U^*$
(see figure 17).
During the top-to-bottom motion of the cylinder, note that the UDGF changes its direction (from upward to downward) as the cylinder crosses the mean position for the transitional and PIG response while the UDGF remains upwards during the PISV response (figure 9 e). This is due to the one-sided staggered vibration of the cylinder, the associated gap-flow regime is called here uni-directional one-sided gap flow (UDosGF).
For the BDGF regime, at larger gap
 $G^* \geqslant 1.5$
, it must be noted from figure 9(a,b) that the BDGF velocity profile in the PImVIV response resembles that of the VIV response for the isolated cylinder. Thus, at
 $U^* = 10$
, note that the maximum magnitude of the velocity vector in the PIV branch of the PImVIV response (figure 9
 $b2$
) is significantly larger than that in the FD branch of the VIV response (figure 9
 $a2$
) – indicating the substantial effect of proximity interference that leads to amplitude enhancement and onset of the PIV branch. With decreasing
 $G^*$
, the proximity interference-based transition from the bi-directional to uni-directional gap flow is associated with the transition from PImVIV-to-PIG in the vibrational response. Further, the onset of unidirectional orthogonal gap flow leads to the onset of galloping response – associated with substantial enhancement in the vibrational amplitude
 $A^*$
and the reduction in oscillation frequency
 $f^*$
for the PIG branch at intermediate
 $G^* = 0.5$
and larger
 $U^*$
. However, at the very small gap
 $G^*(\leqslant 0.3)$
, the high pressure at the front stagnation region of the downstream cylinder leads to the transition from symmetric (UDoGF) to staggered (UDosGF) vibration.
For the top-most position of the cylinder, along with the velocity, figure 9 also shows the angular variation of the local skin-friction coefficient
 $C_f$
around the vibrating cylinder. The figure shows marked values of angular position
 $\theta$
, corresponding to the front stagnation point
 $\theta _{f}$
and separation points (
 $\theta _{t}$
at the top and
 $\theta _{b}$
bottom surfaces) of the vibrating cylinder. For all vibrational responses, it is interesting to notice that the flow separation (with
 $C_f = 0$
) is seen in figure 9 (
 $a1{-}e1$
) at the top surface only while it is seen at both top and bottom surfaces in figure 9 (
 $a2{-}e2$
). The transition from one-sided to both-sided flow separation, at the top-most position, is associated with the in-phase to anti-phase jump in
 $\phi$
for VIV, PImVIV, transitional response at
 $G^* \geqslant 1.0$
.
However, for the PIG response at
 $G^* = 0.5$
, the phase jump does not occur and in-phase oscillations are sustained with increasing
 $U^*$
. This is because, as shown in figure 9(
 $d2$
), the bottom separation point
 $\theta _{b} = -178^\circ$
shifts substantially downstream for the PIG response as compared with
 $\theta _{b} = -130 ^\circ$
for the transitional and
 $\theta _{b} =- 134^\circ$
for the PImVIV response (figure 9
 $b2,c2$
). Further, the front stagnation point also shifts slightly downward (
 $\theta _{f} = -6^\circ , \textrm { }-2^\circ$
) for the PIG as compared with
 $\theta _{f} = 0$
for the PImVIV and transitional responses. Thus, for the PIG response, the orthogonal UDGF near the upstream cylinder contributes to the delayed bottom separation
 $\theta _{b}$
. This prevents the formation of vortices at the bottom of the cylinder, thereby suppressing the phase jump (figure 8
c). In contrast, for the transitional response, the non-orthogonal UDGF and the presence of a vortex on the gap-side lead to the phase jump (figure 8
c).
For PImVIV response and BDGF gap-flow regime at
 $G^* = 2.0$
and
 $U^* = 12$
, temporal variation of (a) coefficient of pressure
 $C_p$
and skin-friction
 $C_f$
on the surface of the vibrating cylinder, (b) velocity vectors coloured with the magnitude of resultant velocity, (c) pressure contours and (d) vorticity contours. Further, (e) shows the variation for displacement
 $y^*$
, lift coefficients
 $C_{l}$
, gap-flow rate
 $Q^*_g$
, non-dimensional power
 $\beta$
and contours of coefficient of pressure
 $C_p$
. The temporal variation for the motion from top-most to bottom-most positions corresponds to the time instants marked as 1–4 in (e). For the pressure contours, the upward/downward arrows correspond to a scaled value of the lift coefficient
 $C_l$
. The angular positions
 $\theta _{f}$
corresponds to the front stagnation point and
 $\theta _{t}(\theta _{b})$
corresponds to the separation points at the top (bottom) of the vibrating cylinder. Here, for the vortices, CW refers to clockwise and CCW to counter clockwise.

Caption as in figure 10 except that this figure is for transitional PImVIV–PIG response and UDnoGF gap-flow regime at
 $G^* = 1.0$
and
 $U^* = 12$
.

Caption as in figure 10 except that this figure is for a representative case of PIG response and UDoGF gap-flow regime at
 $G^* = 0.5$
and
 $U^* = 10$
. Also, the time instants for the flow patterns are marked as 1–7 in (e); with ‘4’ as the mean position.

Caption as in figure 10 except that this figure is for a representative case of PISV response and UDosGF regime at
 $G^* = 0.1$
and
 $U^* = 14$
. The time instants for the flow patterns are marked as 1–3 in (e). Also, the figure does not present the temporal variation of non-dimensional power
 $\beta$
and contour of coefficient of pressure
 $C_p$
.

6. Gap-flow regime-based proximity interference mechanism for the various proximity-induced vibrational characteristics
After the above presentation of the proximity interference-induced vibrational characteristics of four types (PImVIV, transitional, PIG and PISV) and correlating each of them with an instantaneous flow pattern-based distinct gap-flow regime (figure 9), figures 10–13 present a temporal variation of both vibrational and flow characteristics – separately for a representative case of the four types of vibrational and gap-flow characteristics. The figures present a temporal variation of the coefficients for pressure
 $C_p$
and coefficient of skin-friction
 $C_f$
distribution around the vibrating cylinder, velocity vectors, pressure contours and vorticity contours for a half-cycle (top-to-bottom) of the periodic motion of the cylinder. For a comprehensive discussion on a gap-flow-based proximity interference mechanism, the figure also shows temporal variation of the cylinder displacement
 $y^*$
, lift coefficient
 $C_l$
of the vibrating cylinder, gap-flow rate
 $Q^*_g$
(figure 4) and power coefficient
 $\beta$
(3.5) over the complete cycle of the periodic motion.
It is well known that the VIV lock-in is a high-frequency phenomenon, occurring at a frequency close to the natural frequency (smaller
 $U^*$
), as compared with the galloping. Therefore, to clearly differentiate and elucidate the proximity interference-induced effects from the VIV effects of the cylinder, the mechanism for various responses is discussed at larger
 $U^*$
in PIV, PIG and PISV regimes.
6.1. The PImVIV response with bi-directional gap-flow (BDGF) regime
For a proximity interference mechanism that leads to the amplitude enhancement for the PImVIV response at larger
 $G^*$
, figure 10 shows the temporal variation of the vibrational and flow characteristics for a representative PImVIV case at
 $G^* = 2.0$
and
 $U^* = 12$
.
For the top-most position of the cylinder, the marked region in figure 10(
 $b1$
) shows a gap flow in the upward direction, figure 10(
 $d1$
) shows formation of CCW (red) vortex, and figure 10(
 $c1$
) shows the associated low-pressure or suction region on the bottom gap side of the cylinder. This dominant suction leads to a negative/downward lift
 $C_l$
that is anti-phase (
 $\phi \sim 180^\circ$
) with the displacement
 $y^*$
as seen in figure 10(e). Due to the vortex on the gap side of the vibrating cylinder, figure 10(
 $a1$
) shows both top/outer and bottom/gap-side flow separations (
 $\theta _{t} = 114^\circ$
and
 $\theta _{b} = -132^\circ$
) along with maximum suction or minimum pressure coefficient
 $C_{p,min}$
almost at the bottom (
 $\theta \approx -90^\circ$
) of the cylinder.
When cylinder moves downward, this downward anti-phase
 $C_l$
tends to bring the cylinder back to its mean position – called restoring lift force (Mittal & Sharma Reference Mittal and Sharma2022). The restoring lift leads to onset of energy addition to the oscillating cylinder – as seen by increasing positive value of non-dimensional power
 $\beta$
in figure 10(e) (from the time instant
 $t^*_1$
to
 $t^*_2$
). During the downward motion of the cylinder, figure 10(
 $c1{-}c2$
) shows a top-to-bottom shift in the maximum pressure (at the front stagnation point) of the downstream stationary cylinder, hereafter called as proximity pressure. This proximity pressure leads to an increase in the gap-flow rate
 $Q^*_g$
(figure 10
e) and net circulation of the CCW vortex increases – resulting in a larger
 $C_{p,min}$
(figure 10
 $a2$
) as compared with that at the top-most position (figure 10
 $a1$
). This enhanced circulation of the anti-phase vortex is responsible for larger magnitudes of
 $C_l$
and
 $A^*$
in the PImVIV response as compared with those in the VIV response of an isolated cylinder. However, due to an increase in the downward velocity of the vibrating cylinder, its front stagnation point shifts downward with
 $\theta _{f} =0^\circ$
to
 $-4^\circ$
(figure 10
 $a2$
) that contributes to the an upward lift. The combined effect of the downward lift (caused by
 $C_{p,min}$
on the gap side) and the upward lift (caused by downward shift of front stagnation point) results in an overall decrease in the magnitude of the downward/negative
 $C_l$
(figure 10
e). This cylinder position at
 $t^*_2$
instant almost corresponds to the maximum values for suction
 $C_{p,min}$
and gap-flow rate
 $Q^*_{g,max} = 0.56$
along with a phase difference
 $\phi _{g} = 41.3$
(between
 $Q^*_g$
and
 $y^*$
); shown in figure 10(e) slightly before
 $t^*_2$
.
As the cylinder crosses the mean position, figure 10(
 $d3$
) shows that the CCW vortex roll-up and a stronger proximity pressure are seen in figure 10(
 $c_3$
). At the same time, figure 10(
 $b3$
) shows an increase in the downward gap flow near the trailing edge of the upstream cylinder. This downward gap flow pushes the CCW vortex downward and the vortex re-attaches at the bottom of the downstream cylinder; marked as re-attachment in figure 10(
 $d4$
). Further, the increased downward gap flow leads to an increase in strength of the CW vortex (on top of the cylinder) and the minimum suction region starts switching from bottom-to-top side (more clearly seen with a gradual shift in the
 $C_{p,min}$
in figure 10
 $a2{-}a4$
), leading to an downward-to-upwards transition in the
 $C_l$
(marked arrow in figure 10
 $c3{-}c4$
) as the cylinder crosses the mean position. For the complete cycle of the periodic vibrations, the region of the gap flow-based suction switching is also marked in figure 10(e) – on the timewise contours plot for pressure coefficient
 $C_p$
variation on the surface of the cylinder.
As discussed above, the growth of the vortex in the wake of the oscillating cylinder is constraint (within the gap) by the proximity interference from the downstream stationary cylinder. The interaction is referred as wake–cylinder interaction by Alam & Meyer (Reference Alam and Meyer2013) and oscillating wake flow by Mittal & Sharma (Reference Mittal and Sharma2022). Whereas, the vortex is free to grow in the wake for the isolated cylinder. For the PImVIV as compared with VIV response, the bi-directional gap flow (discussed above with figure 9
a,b) increases the circulation of the vortex in the gap, which leads to the enhancement in the restoring lift force and associated amplitude during the PImVIV response. The enhancement of the amplitude of
 $C_l$
as compared with that of isolated cylinder can be verified from the variation of
 $C_{l,rms}$
in figure 8(
 $a3$
). Further, the excess growth of the vortex in the gap comes at the expense of smaller vortex shedding and oscillation frequency
 $f^*$
as compared with those during VIV of an isolated cylinder (figure 8
 $a2$
).
6.2. Transitional PImVIV–PIG response with uni-directional non-orthogonal gap-flow (UDnoGF) regime
Similar to figure 10 for the BDGF, figure 11 shows the results for the UDnoGF at the same
 $U^* = 12$
but a smaller
 $G^* = 1.0$
. Both the figures are compared below to present a gap-flow-based proximity interference mechanism for the significant enhancement in the amplitude
 $A^*$
, with the transition from the BDGF to UDGF at
 $G^* = 1.0$
.
For the top-most position of the vibrating cylinder, as compared with the BDGF in figure 10(
 $c1$
), figure 11(
 $c1$
) shows a larger proximity pressure on the stationary cylinder that results in the uni-directional flow in the gap. However, the smaller gap
 $G^* = 1.0$
is large enough to form CCW vortex in the gap but undergoes a slightly early separation on the top/outer side
 $\theta _{t} = 110^\circ$
and a delayed separation on the bottom/gap side
 $\theta _{b} = -154^\circ$
(compare figures 10 and 11) – leading to the UDGF being non-orthogonal. Further, on the gap side, a CCW vortex and corresponding minimum suction
 $C_{p,min}$
are seen (figure 11
 $a1{-}d1$
), leading to an anti-phase restoring lift force in the downward direction, shown in figure 11(e) at instant
 $t^*_1$
.
As the cylinder moves downward, figure 11(
 $d2$
) shows that the vortex in the gap roll-up and moves upwards, figure 11(
 $a_2$
) shows an increase in the value to
 $C_{p,min}$
, and
 $C_p$
contours in figure 11(e) show a narrowing of the restoring suction region. The narrowing is in contrast to BDGF regime where a similar
 $C_{p,min}$
increase in figure 10(
 $a2$
) along with widening of suction region in figure 10(e) are observed. The narrowing of the suction region is again attributed to the stronger proximity pressure of the downstream cylinder, that restricts the growth of gap-side vortex as shown in figure 11(
 $d2$
). Also, figure 11(
 $a1,a2$
) shows a reasonably larger downward shift in the front stagnation point
 $\theta _{f}$
varying from
 $0^\circ$
to
 $-12^\circ$
, that contributes to an upward force. However, the downward lift contributed by the gradual shrinking of gap-side suction is not strong enough and the resultant lift becomes nearly zero (
 $C_l \sim 0$
) at time instant
 $t^*_2$
(figure 11
e) – earlier as compared with the mean position (at
 $t^*_m$
) for the BDGF regime (figure 10
e).
The early
 $C_l = 0$
at
 $t^*_2$
is followed by a small value of positive/upward lift during the time interval
 $t^*_2-t^*_m$
, seen in figure 11(e), as the cylinder approaches the mean position. In contrast, after crossing the mean position, a small value of negative/downward lift is seen. Thus, during the entire top-to-bottom motion, the monotonic decrease in
 $C_l$
leads to the restoring lift force for the BDGF regime (figure 10
e) while the non-monotonic variation in
 $C_l$
(figure 11
e) leads to a small value of an exciting force (downwards) – near the mean position. The non-monotonic
 $C_l$
-variation is related to a delayed onset of the gap flow-based switching of restoring suction (from bottom-to-top side of the vibrating cylinder) closer the bottom-most position (shown at
 $t^*_4$
in figures 11
 $c4$
and e), as compared with the that at mean position for BDGF regime (figures 10
 $c3$
and e). This delay is attributed to the uni-directional in-phase gap-flow rate
 $Q^*_g$
with
 $\phi _g = 4^\circ$
for the UDnoGF regime here as compared with a phase lag
 $\phi _g = 41^\circ$
in the earlier BDGF regime. Further, across the mean position, a much larger downward shift of the front stagnation point with
 $\theta _{f}=-12^\circ$
and
 $-10^\circ$
(figure 11
e) as compared with
 $-6^\circ$
and
 $-4^\circ$
(figure 10
e) also contributes to this non-monotonic variation of
 $C_l$
. The anti-phase (
 $\phi = 180^\circ$
) restoring
 $C_l$
acts inwards and tends to bring the cylinder back to its mean position, discussed above, while the in-phase (
 $\phi = 0^\circ$
) exciting lift force acts outward and tend to move the cylinder away from the mean position (Mittal & Sharma Reference Mittal and Sharma2022).
In summary, for the UDnoGF and transitional response at
 $G^* = 1.0$
as compared with the BDGF and PImVIV response at
 $G^* = 2.0$
, although amplitude of the anti-phase restoring lift is smaller, an in-phase exciting lift also emerges near mean position. This is attributed to the smaller gap-side vortex and an in-phase gap-flow rate (
 $\phi _{g} = 4$
) in the UDnoGF regime (figure 11
e). The smaller the phase difference
 $\phi _{g}$
leads to the gap flow-based switching of the suction regions more closer to the extreme bottom-most position, which delays the restoring force pulling the cylinder towards the mean position, allowing the cylinder to reach larger amplitude. Thus, for the transitional response at larger
 $U^*$
, the amplitude enhancement is not attributed to the enhanced gap vortex and lift force (as in BDGF regime) but rather to (a) a smaller gap-side restoring vortex due to stronger proximity pressure and (b) the delay in gap-flow-based switching of restoring suction regions.
6.3. the PIG response with uni-directional orthogonal gap-flow (UDoGF) regime
For a representative case of
 $G^* = 0.5$
and
 $U^* = 10$
in the UDoGF regime, at the top-most position of the cylinder, figure 12(
 $b1,c1$
) shows that the downstream cylinder is exposed to the free-stream flow that results in a stronger proximity pressure near its front stagnation point. The resulting orthogonal uni-directional gap flow, at the top-most position, leads to a non-separated flow at the bottom/gap side and single separation point on top/outer side with
 $\theta _{t} = 110^\circ$
, as can be seen in figure 12(
 $a1,b1$
). The pressure contours in figures 12(
 $c1$
) and 12(e) show that the suction at the gap side is larger than that at the outer side along with a small downward inclination of front stagnation point
 $(\theta _{f} = -4^\circ$
in figure 12(
 $a1$
)). The combined effect results in a small dip in
 $C_l$
, as marked in figure 12(e).
As the velocity of the cylinder increases while moving downwards, the UDoGF leads to an upward inclination of both wake region and separated shear layers (figure 12
 $b2{-}b3$
and
 $d_2{-}d_3$
). This leads to two separation points on the outer side of the cylinder, marked as
 $\theta _{t}=100^\circ \textrm { and } 172^\circ$
in figure 12(
 $a2$
) and
 $94^\circ \textrm { and } 172^\circ$
in figure 12(
 $a3$
). Also, during the top-to-mean motion of the cylinder, figure 12(
 $a1{-}a3$
) shows the one-sided flow separation in the UDoGF regime as compared with the two-sided flow separation in BDGF and UDnoGF regimes. Thus, the orthogonal gap flow close to the vibrating cylinder suppresses the adverse pressure gradient and associated flow separation on the gap side of the cylinder. The suppression and delay of the bottom flow-separation point reveals direct interaction of proximity interference with the boundary layer of the vibrating cylinder, making it the same as the boundary layer–cylinder interaction shown by Alam & Meyer (Reference Alam and Meyer2013). Further, as the upstream cylinder moves closer to the proximity pressure of the downstream cylinder during the time
 $t^*_2$
to
 $t^*_3$
, figure 12(e) shows a shrinkage of the gap-side suction and figure 12(
 $a1{-}a3$
) shows a downward shift in the front stagnation point (
 $\theta _{f} \textrm { varies from } -4^\circ$
to
 $-20 ^\circ$
). Their combined effect leads to a local increase in
 $C_l$
after the initial dip during the top-to-mean motion, shown in figure 12(e).
At the mean position (
 $y^*=0$
), figures 12(
 $b4$
) and (
 $d4$
) shows a substantial decrease of both gap flow and the proximity pressure of the downstream cylinder. The
 $C_p$
contours in figure 12(e) at
 $t^*_4$
clearly mark the significant dominance of exciting suction at the bottom side as compared with the negligible suction at the top side. This exciting suction increases the negative/downward exciting lift on the cylinder away from the mean position, resulting in energy addition to the cylinder with increasing positive
 $\beta$
, as shown in figure 12(e). Here, both lift and velocity of the cylinder are in the same downward direction (away from the mean position), which is an attribute of galloping instability (Blevins Reference Blevins1977; Assi & Bearman Reference Assi and Bearman2015). Further, for the mean-to-bottom motion of the cylinder, figure 12(
 $a5{-}a7$
) shows the separation point on the bottom half shifts upstream from
 $\theta _{b} = -138^\circ$
to
 $-112^\circ$
and front stagnation point shifts towards the centre of front face with
 $\theta _{f}$
varying from
 $-16^\circ$
to
 $2^\circ$
. Finally, for the PIG response, note from figure 12(e) that the gap-flow rate
 $Q^*_g$
is almost in-phase with
 $y^*$
(
 $\phi _{g} \sim 6^\circ$
) that results in the gap-flow-based switching of the restoring suction region near the extreme position.
In summary, strong proximity interference affects the boundary layer of the upstream cylinder and generates an uni-directional orthogonal gap flow along with suppression of the adverse pressure gradient, vortex formation on the gap side of the cylinder and associated anti-phase
 $C_l$
. At the same time, the generation of galloping instability near the mean position results in the in-phase exciting
 $C_l$
. Whereas, for larger gap
 $G^*$
in the BDGF regime, the weaker proximity interference interacts primarily with the vortex of the upstream cylinder in the gap, enhancing its circulation. This enhanced circulation of the gap-side vortex leads to enhancements in the anti-phase restoring lift and amplitude, as compared with those during isolated VIV. Further, a detailed mechanism of galloping generation, its absence at larger gaps (
 $G^* \geqslant 1.0$
) and other relevant questions are discussed comprehensively using schematics in upcoming § 7.
6.4. The PISV response with uni-directional one-sided gap-flow (UDosGF)
For a representative case of UDosGF regime with the staggered vibration at
 $G^* = 0.1$
and
 $U^* = 14$
, during the top-to-bottom motion, figure 13(
 $b1{-}b3$
) shows a slightly unsteady uni-directional gap-flow that is directed upwards, i.e. positive values of gap-flow rate
 $Q^*$
with very small fluctuation (figure 12
e). Further, figure 13 (
 $b1{-}b3$
) and (
 $d1{-}d3$
) shows that the fluid in the gap forms a small CW vortex in the gap that merges downstream with larger CW vortex from upstream cylinder, and the overall flow in the gap is directed behind the large CCW vortex at the bottom side of the downstream cylinder. This pattern is similar to biased base bleed pattern – observed for two stationary cylinders in staggered arrangement by Lee & Yang (Reference Lee and Yang2009) and Sumner (Reference Sumner2010).
For the entire top-to-bottom motion, as compared with top-to-mean motion in the PIG response, figure 13(
 $a1{-}a3$
) shows no separation on the gap side and a slightly varying two separation points (
 $\theta _{t} = 114^\circ$
to
 $116^\circ$
and
 $178^\circ$
to
 $180^\circ$
) on the outer side of the cylinder. The stronger influence of the proximity pressure and uni-directional flow close to upstream cylinder result in significant changes in the boundary layer of the upstream cylinder, suppressing adverse pressure gradients, gap-side flow separation and vortex formation. Thus, figures 13(a) and (c) shows a larger outer-side vortex and a wider outer-side suction with a larger magnitude of
 $C_{p,min}$
than the gap-side suction on the bottom of the cylinder. Also, there is a slight variation in the front stagnation points with
 $\theta _{f} = -4$
to
 $-8^\circ$
. Thus, the pressure distribution around the upstream cylinder always exerts a lift in the upward direction, repelling the cylinder away from the mean position. This repulsive force is evident from figure 13(e), where
 $C_{l}$
on the upstream cylinder is always large and positive during the entire oscillation cycle.
7. Gap-flow rate
 $\boldsymbol{Q}^*_{\boldsymbol{g}}$
characteristics at various flow regimes and vibrational response

In the previous sections, we discussed the four distinct vibrational responses, gap-flow profile-based flow regimes and their mechanism with the help of flow dynamics during the top-to-bottom motion. For each of these regimes, this section presents the gap-flow dynamics, characterised by maximum gap-flow rate
 $Q^*_{g,max}$
, phase difference
 $\phi _{g}$
(between
 $Q^*_g$
and
 $y^*$
) and shape of phase portraits for
 $Q^*_g$
versus
 $y^*$
. With this analysis, we aim to identify and classify the unique characteristics manifesting in different gap-flow regimes; thereby, contributing to a deeper understanding of the gap-flow dynamics.
It is interesting to note from figure 14 that, with increasing
 $U^*$
, the maximum gap-flow rate
 $Q^*_{g,max}$
follows the same trend of variation as that by the amplitude
 $A^*$
. This similarity is seen for various vibrational responses and gap-flow regimes except for the PISV response at
 $G^* =0.1$
and larger
 $U^*\geqslant 10$
(figure 14
d) where
 $Q^*_{max}$
follows an increasing trend while
 $A^*$
follows an asymptotically decreasing trend. In contrast, for
 $\phi _g$
versus
 $U^*$
, figure 14 shows an almost opposite trend of the variation for the various vibrational response except for the PImVIV response (with similar trends of variation for
 $\phi _{g}$
,
 $A^*$
and
 $Q^*_{max}$
with increasing
 $U^*$
).
Gap-flow rate characteristics for four types of vibrational responses and corresponding flow regimes with (a) PimVIV response and BDGF regime. (b) Transitional response with UDnoGF regime. (c) The PIG response with UDoGF regime. (d) The PISV response with UDosGF regime. Characteristics by variation of non-dimensional amplitude
 $A^*$
, maximum gap-flow rate
 $Q^*_{g,max}$
, and phase
 $\phi _{g}$
(between gap-flow rate
 $Q^*_g$
and displacement
 $y^*$
) with increasing reduced velocity
 $U^*$
.

Variation of phase portraits between gap-flow rate
 $Q^*$
and displacement of the cylinder
 $y^*$
for four gap-flow regimes at various gap
 $G^*$
and reduced velocity
 $U^*$
. The motion of the cylinder is represented by anti-clockwise movement on the phase portraits.

For the PImVIV response, due to the vortex in the gap that sustains the BDGF regime, figure 14(a) shows an increasing–decreasing trend for the
 $\phi _{g}$
(same as
 $A^*$
) with an asymptotic value of
 $\phi _{g} \approx 41^\circ$
at larger
 $U^*$
. The corresponding phase portraits in figure 15 (for
 $G^* = 2.5$
and 2.0) show an elliptic shape. As the gap flow undergoes transition to the UDGF regime in the transitional and PIG response, with increasing
 $U^*$
, figure 14(
 $b{-}c$
) shows a rapid decrease followed by a slight increase at larger
 $U^*$
that becomes asymptotic for the PIG (with
 $\phi _{g} \approx 6^\circ$
). The effect is also seen in phase portraits in figure 15, where the phase portrait undergoes a transition from an elliptical shape for the transitional response (
 $G^* = 1.0$
) to an extended-dumbbell shape for the PIG response (
 $G^* = 0.5$
). In the UDnoGF regime at
 $G^* = 1.0$
, the phase portraits remain elliptic with a smaller minor axis than that in the BDGF regime, as shown in figure 15. Further, for smaller
 $U^*= 6$
at
 $G^* = 0.5$
, the shape of the phase portraits in figure 15 shows a blend of UDnoGF near the mean position while UDoGF near the extreme position. Since the gap-flow regimes are based on the flow profile at the extreme position, it is classified as UDoGF. For non-staggered vibration, the elliptic phase portraits represent the vortex in the gap while the extended-dumbbell shape represents the absence of the vortex in the gap.
For PISV response with UDosGF regime at
 $G^* = 0.1$
, as previously discussed for vibrational characteristics in figure 8, the PISV vibrational characteristics are the same as the FD branch of VIV. Thus, figure 15 shows an elliptic phase portrait in PISV as in PImVIV at larger
 $U^*$
. Further, figure 14(d) shows that both
 $Q^*_{g,max}$
and
 $\phi _{g}$
increase with increasing
 $U^*\geqslant 10$
, due to the increase in the staggered mean position
 $\bar {y^*}$
with
 $U^*$
(figure 6
b).
Near the mean position
 $y^*= 0$
, note from figure 15 that
 $Q^*_{g} \approx 0$
for the extended-dumbbell shape in the UDoGF regime while it is non-zero for elliptical phase portraits in the UDnoGF and BDGF regimes. Further, comparing figure 15 for
 $U^* =8$
at
 $G^* = 0.5, 1.0$
and 2.5, note that
 $Q^*_g$
is larger for the motion away as compared with that towards the mean position for the extended-dumbbell shape of the UDoGF, which is exactly opposite to that for the elliptic shape of the UDnoGF and BDGF regimes; more clearly shown in the figure for
 $U^* = 8$
at
 $G^* = 2.5$
and 0.1. For PIG response with extended-dumbbell shape and in-phase
 $\phi _{g} \sim 0$
, the larger
 $Q^*_{max}$
corresponds to the larger vibration amplitude. For instance, at
 $U^* = 16$
for
 $G^* \leqslant 0.5$
, figure 15 shows that both
 $Q^*_{g,max}$
and amplitude are largest for
 $G^* = 0.5$
and reduction in
 $Q^*_{max}$
at
 $G^* = 0.3$
leads to the reduction in amplitude. The larger gap flow represents the incoming flow that is deflected in the transverse direction by the downstream interfering cylinder, resulting in a larger exchange of energy between the near-wake gap flow and the vibrating cylinder. As a result, the highest energy extraction (proportional to product of amplitude and frequency) from the free-stream incoming flow is observed at
 $G^* = 0.5$
. This is consistent with the experimental findings of Nishi et al. (Reference Nishi, Ueno, Nishio, Quadrante and Kokubun2014), who observed higher amplitude, electrical power output and energy conversion efficiency at
 $G^*= 0.3$
, as compared with those for an isolated vibrating cylinder. Note that the stationary cylinder is rigidly fixed and no external energy is expended while it is used as control/interfering cylinder.
7.1. Discussion on mechanism of PIG and PISV
In the published literature, various studies are found on the effect of proximity interference from a downstream structure on FIV of an elastically mounted cylinder. However, for this problem, there is a scope to present a more comprehensive flow mechanism as compared with that reported in the literature (Bokaian & Geoola, Reference Bokaian and Geoola1984a ; Mittal & Sharma Reference Mittal and Sharma2022; Su et al. Reference Su, He, Zhang and Feng2022). Thus, for the flow mechanisms that lead to (a) amplitude enhancement in the PImVIV response, (b) generation of galloping instability in the PIG response and (c) onset of PISV response, we attempt to answer the four questions as follows:
-
(i) What is the mechanism of galloping instability generation during the PIG response, and how it is different from the galloping of an isolated non-axisymmetric cylinder?
-
(ii) Why does the proximity interference result in maximum amplitude of vibration at an intermediate gap
$G^*$
? -
(iii) Why does the amplitude response is asymptotically increasing in PIG as compared with the monotonic increase in galloping of an isolated non-axisymmetric cylinder?
-
(iv) Why does the proximity interference lead to the onset of staggered vibration (PISV) at a critical reduced velocity
$U^*_c$
?


For each of the four question, the mechanisms are presented in the separate subsection below. The mechanisms are presented with the help of a schematic representation of flow phenomena (during the top-to-bottom motion of the cylinder) for the BDGF regime in PImVIV response and the UDoGF regime in the PIG response in figures 16(a) and 16(b), respectively. Note that, in the forthcoming discussion, a stabilising force acts opposite to the direction of motion (
 $\beta \lt 0$
) and decelerates the cylinder while a destabilising force acts in the same direction (
 $\beta \gt 0$
) and accelerates the cylinder.
Schematic representation of the flow dynamics during top-to-bottom motion of the cylinder for (
 $a_1{-}a_3$
) the BDGF regime in PImVIV response and (
 $b_1{-}b_3$
) the UDoGF regime in PIG response. Panels (c) and (d) present the temporal variation of displacement
 $y^*$
, velocity
 $\dot {y^*}$
, and lift coefficient
 $C_l$
. For (c) and (d), note that the time instant (1), (2) and (3) correspond to the schematic of PIG response in (
 $b_1$
), (
 $b_2$
) and (
 $b_3$
), respectively. For the schematics in (a) and (b), the coloured regions represent high/low pressure – with red and blue/cyan corresponding to high and low pressure at the front and separated regions of the cylinder, respectively. Further, the blue as compared with cyan corresponds to a larger or dominant suction region.

7.1.1. Flow mechanism for PImVIV and generation of galloping instability in PIG
For PImVIV response during top-to-mean motion, the schematic representation in the figure 16(
 $a1$
) shows interference-induced enhancement in the circulation in the gap-side vortex – leading to a destabilising force downwards and energy addition to the cylinder (figure 10). The enhanced circulation increases the lift force and corresponding amplitude
 $A^*$
as compared with those for the isolated cylinder. Slightly downward from the mean position, figure 16(
 $a2$
) shows the gap-flow-based switching of the destabilising vortex/suction at the bottom or gap side to a stabilising vortex/suction at the top side, leading to an onset of stabilising lift in the upward direction (figure 10). Further, downward motion during the mean-to-bottom position, figure 16(
 $a3$
) shows that the vortex at the top grows and the associated stabilising
 $C_l$
acts against the downward motion restricting the further increase in the amplitude of the cylinder. For the transitional response (
 $G^*\,{=}\,1.0$
), the switching of the gap-flow-based suction region and associated stabilising lift is delayed, allowing the cylinder to oscillate with larger amplitudes (figure 11).
In contrast, for the PIG case in figure 16(b), the energy addition to the oscillating system is not by a vortex but rather by the generation of galloping instability. For the mechanism of galloping instability generation, figure 16(
 $b2$
) shows a schematic of a continuous outer and gap-side suction regions that connect both the cylinders during the mean-to-bottom motion (see figure 12
 $c5$
). Due to orientation of the two cylinders along with a negligible gap-flow rate (
 $Q^*_g \approx 0$
), the two cylinders behave as a single extended body leading to low/high pressure on the bottom/top side of the two cylinders. For vibrating upstream cylinder, the associated pressure difference exerts a destabilising lift in the downward direction, adding energy to the cylinder (
 $\beta \gt 0$
in figure 12). This extended body as a whole behaves the same as a single galloping-susceptible non-axisymmetric bluff body such as triangle (Abhishek et al. Reference Abhishek, Saha and Sharma2024) and cylinder with attached splitter pate (Assi & Bearman Reference Assi and Bearman2015; Sahu et al. Reference Sahu, Furquan, Jaiswal and Mittal2019), where the formation of low/high suction regions on opposite sides leads to the generation of galloping instability. The galloping here is generated once in an oscillation cycle when the two cylinders are sufficiently close to each other whereas no such condition is required for a non-axisymmetric cylinder with multiple galloping peaks possible in a cycle. The extended body is not possible at larger gaps
 $G^* \geqslant 1.0$
since there is always infiltration of a reasonably larger circulatory flow in the gap and the two cylinders behave as two different galloping-resistant circular cylinders, shown in figure 16(a).
For two oscillating circular cylinders, several studies have reported a galloping response when the downstream cylinder follows the upstream cylinder and remains partially/fully submerged in its wake i.e. both behave as a single extended body (Kim et al. Reference Kim, Alam, Sakamoto and Zhou2009; Su et al. Reference Su, He, Zhang and Feng2022; Sharma & Bhardwaj Reference Sharma and Bhardwaj2023). However, this has been highlighted for the first time for proximity-induced galloping of an upstream cylinder. For two oscillating cylinders, Sun et al. (Reference Sun, Ma, Kim, Nowakowski, Mauer and Bernitsas2019) referred to the downstream cylinder as hydrodynamically trapped inside the wake of an upstream cylinder. Sharma & Bhardwaj (Reference Sharma and Bhardwaj2023) also reported destabilising forces and corresponding galloping vibrations when the downstream cylinder is in the wake of an upstream cylinder at
 $G^*=0.1$
. Further, this is also seen for three oscillating cylinders in tandem arrangement (Chen et al. Reference Chen, Ji, Williams, Xu, Yang and Cui2018).
7.1.2. Existence of the optimum gap
$G^*$
for maximum amplitude

During the top-to-mean motion of the cylinder, the schematic in figure 16(
 $b1$
) shows that, as the cylinder approaches closer to the downstream cylinder and its velocity increases, the stronger influence of the proximity pressure reduces the gap-flow rate with steeper reduction of
 $Q^*_g$
near instant (
 $b_1$
) in figure 16(c,d) and suppresses the gap-side vortex/suction (as seen in figure 12 for PIG and figure 13 for PISV response). Consequently, more flow is directed toward the outer side, leading to a dominant outer-side vortex/suction on the vibrating cylinder (figure 13 for PISV response). Here, the suction region on the rear and the stagnation region on the front of the cylinder exerts a stabilising upward lift, and figure 16(c,d) shows a local increase in upward/positive
 $C_l$
. The upward lift decelerates the cylinder and a decreased slope of velocity
 $\dot {y^*}$
(non-sinusoidal) can be seen in figure 16(c,d). Such repulsive lift on the upstream cylinder has been previously reported for large alignment angles (
 $\geqslant 45^\circ$
) between two stationary staggered cylinders by Tong, Cheng & Zhao (Reference Tong, Cheng and Zhao2015). The repulsive/stabilising lift on the upstream cylinder increases with decreasing
 $G^*$
, as seen by a larger positive peak in
 $C_l$
and larger reduction in
 $\dot {y^*}$
slope for
 $G^* = 0.3$
as compared with
 $G^* = 0.5$
in figure 16(c,d). Also, a larger gap-flow rate reduces the dominance of outer-side suction, leading to a smaller repulsive/destabilising lift on the cylinder. Thus, for
 $G^*\leqslant 0.5$
, the decrease in
 $Q^*_{max}$
is accompanied by a reduction in amplitude in PIG response, leading to the existence of an optimum gap
 $G^*= 0.5$
for the maximum amplitude. Interestingly, as
 $G^*$
decreases and
 $U^*$
increases, the deceleration intensifies to the point where the cylinder halts before reaching the position for the onset of galloping instability generation and gets stuck on one side of the mean position in the staggered arrangement. A larger gap-flow rate is favourable to ensureing smaller deceleration of the upstream cylinder and preventing staggered vibration.
7.1.3. Asymptotic amplitude variation in PIG response
Near the bottom-most position near instant (
 $b_3$
), figure 16(c,d) shows an increased
 $Q^*_g$
due to weaker proximity interference from the distant downstream cylinder. Thus, figure 16(
 $b3$
) shows a downward gap flow leading to the switching of the exciting suction at outer side to the dominant restoring suction on the gap side, along with a slight decrease or dip in the downward
 $C_l$
(figure 12
 $c1$
and e). The local decrease in the downward
 $C_l$
is marked at instant (
 $b_3$
) in figures 16(c) and 16(d). Further, the figure shows that the decrease in
 $C_l$
is large enough to change its direction from downward to upward at
 $G^* = 0.5$
while it remains downward for
 $G^* = 0.3$
. This is attributed to the stronger proximity interference and the smaller gap-flow rate
 $Q^*_{max}$
at
 $G^* = 0.3$
. A larger gap-flow rate results in a greater dip in
 $C_l$
. With increasing
 $U^*$
in the PIG response at
 $G^* = 0.5$
(figure 8
c), the amplitude increases and oscillation frequency decreases. This leads to two effects (with increasing
 $U^*$
); first, a larger gap-side suction and corresponding restoring lift pulling the cylinder back to its mean position; and second, prolonged time duration for repulsive/stabilising forces to decelerate the cylinder during extreme-to-mean motion (discussed in figure 16
 $b1$
). The combined effect restricts the further growth of the amplitude leading to an asymptotic variation of amplitude at larger
 $U^*$
.
Further, for the PIG response, the optimum gap and the associated maximum asymptotic
 $A^*$
have been reported to vary with different shapes and sizes of the downstream structure (Kim et al. Reference Kim, Alam, Sakamoto and Zhou2009; Mittal & Sharma Reference Mittal and Sharma2022; Su et al. Reference Su, He, Zhang and Feng2022; Tang et al. Reference Tang, Zhu, Chen, Zhong and Gao2023). This self-limiting characteristic of amplitude is also found in the literature for FIV of two cylinders, exhibiting gap flow (Borazjani & Sotiropoulos Reference Borazjani and Sotiropoulos2009; Carmo et al. Reference Carmo, Sherwin, Bearman and Willden2011; Griffith et al. Reference Griffith, Jacono, Sheridan and Leontini2017; Sharma & Bhardwaj Reference Sharma and Bhardwaj2023).
7.1.4. Critical reduced velocity
$U^*_c$
for onset of the PISV response

For temporal variation of transition from normal to staggered vibration, shown previously in figure 7, initially the cylinder starts from rest and is displaced to the extreme position by galloping forces. The slacker spring at larger
 $U^*$
results in cylinder displacement to a larger extreme position (figure 7
a) and a smaller oscillation frequency (figure 7
b). During the motion towards the mean position, the larger extreme displacement and the smaller frequency results in prolonged time duration for the stabilising forces to decelerate the cylinder such that it comes to halt (
 $\dot {y^*}\sim 0$
) at a larger distance from the mean position (see
 $U^* = 18.5$
and 19 in figure 7
a). This is also evident from the increase of time-averaged displacement
 $\bar {y^*}$
with increasing
 $U^*$
in the PISV regime (figure 6
b). Moreover, at the top extreme position, the velocity is zero, and the cylinder has only potential energy of the spring. Thus, the critical reduced velocity
 $U^*_c$
is above that for which the cylinder does not have enough potential energy to counter the decelerating forces and cross the mean position. Such staggered vibrations are observed for first the time in a symmetric tandem arrangement. However, Griffith et al. (Reference Griffith, Jacono, Sheridan and Leontini2017) reported negligible
 $A^*$
staggered vibration for two oscillating cylinders at a centre to centre transverse offset of
 $1.0$
at
 $G^* = 0.5$
.
8. Summary and conclusion
For FIV of an elastically mounted cylinder with an identical stationary cylinder downstream, figure 17 presents a graphical summary of the four states of the proximity interference-based gap-flow rate and vibrational characteristics. As the non-dimensional gap
 $G^*$
decreases, the figure shows a transitions through four distinct flow regimes: BDGF, UDnoGF, UDoGF and UDosGF – with the respective regimes corresponding to PImVIV, transitional PImVIV–PIG, PIG and a novel PISV.
For the four states of the proximity-induced gap flow and vibrational characteristics, graphical summary of the present FmSI system: (a)–(d) representative trends of vibrational and gap-flow rate characteristics, under the effect of cylinder–cylinder gap
 $G^*$
and reduced velocity
 $U^*$
. Further, regime map are shown separately for various (e) branchwise vibrational characteristics and (f) gap-flow regimes – overlapped with contours of (e) vibrational amplitude
 $A^*$
and (f) phase difference
 $\phi _{g}$
between temporal variation of displacement
 $y^*$
and gap-flow rate
 $Q^*_g$
.

For large gap
 $G^*\geqslant 2.0$
, the BDGF gap-flow regime in figure 17( f) is characterised by a bi-directional velocity profile with the presence of a vortex in the gap. Attributed to the BDGF regime, figure 17(a) shows VIV-like PImVIV vibrational characteristics with an increasing–decreasing amplitude
 $A^*$
, continuously increasing frequency
 $f^*$
and in-phase to anti-phase jump in the phase difference
 $\phi$
between the temporal variation of displacement
 $y^*$
and lift coefficient
 $C_l$
. Figure 17(b) shows the transitional vibrational response and figure 17(f) shows a BDGF-to-UDnoGF regime transition at intermediate
 $U^* = 12$
and 7 for
 $G^* = 1.5$
and 1.0, respectively. The transition leads to a wider lock-in branch, smaller
 $f^*$
, along with a significant amplitude enhancement as compared with that for VIV of an isolated cylinder. Further decreasing the gap to
 $G^* = 0.5$
, the non-orthogonal gap flow transitions into orthogonal that leads to the UDoGF regime, characterised by the absence of circulatory flow or vortex within the gap. The UDoGF regime leads to the PIG response, consisting of a rapid increase plateau variation in
 $A^*$
, a rapid increase plateau in
 $f^* \lt 1$
and absence of the phase
 $\phi$
jump with increasing
 $U^*$
as shown in figure 17(c). Figure 17(e) shows that the onset of the PISV response and UDosGF regime occurs at
 $U^* = 20$
and 10 for
 $G^* = 0.3$
and 0.1, respectively. Thus, for
 $G^* = 0.3$
and 0.1, figure 17(d) shows the PIG response at smaller
 $U^*\leqslant U^*_c$
followed by the onset of PISV (at
 $ U^*_c$
) that results in the combined PIG–PISV vibrational response. Further, the figure shows that the PISV response is characterised by a negligible
 $ A^*$
, a change in
 $ f^*$
variation parallel to the
 $f^*_{st}$
and an in-phase to anti-phase jump in
 $\phi$
– with characteristics similar to the final FD branch of the VIV response.
Our study demonstrates a strong correlation between gap-flow rate
 $Q^*_g$
and vibrational amplitude
 $A^*$
characteristics, and presents flow mechanism for amplitude enhancement in each of the gap-flow regimes. For different flow regimes in the gap, figure 17(a)–(d) also shows that the trend of variation of the maximum gap-flow rate
 $Q^*_{g,max}$
is the same as that of amplitude
 $A^*$
(except the PISV response) while the variation of the phase difference
 $\phi _{g}$
(between
 $ Q^*_g$
and
 $ y^*$
) is different. Figure 17(f) shows that the transition from the BDGF to UDnoGF regime occurs when
 $\phi _{g} \lesssim 30$
. For the transitional and PIG response,
 $\phi _g$
is characterised by a rapid decrease plateau variation with a slight increase for the transitional response (figure 17
b,c). The present study also reported distinct shapes of the phase portrait (between
 $y^*$
and
 $Q^*_g$
) for each of the states (figure 15) The phase portraits remain elliptic with a smaller minor axis for the transitional response due to non-orthogonal gap flow in the UDnoGF regime, representing circulatory flow in the gap. The phase portraits transition to an extended-dumbbell shape for the PIG response – representing non-circulatory orthogonal gap flow in the UDoGF regime.
For flow mechanism of the interference-induced amplitude enhancement in the various vibrational responses, a switching of the direction of gap flow results in a gap-flow-based switching of the suction regions (on the two sides of the vibrating cylinder) whose position during the vibration cycle is strongly linked with the value of
 $\phi _{g}$
. The amplitude enhancement for PImVIV (as compared with VIV) is caused by proximity interference-induced enhancement in the circulation of the vortex in the gap, leading to a larger restoring lift
 $C_l$
. Surprisingly, for transitional response, the amplitude
 $A^*$
is significantly larger although the lift is smaller than the PImVIV response. This larger
 $A^*$
is attributed to the UDGF with in-phase
 $\phi _{g} \sim 4{-}12$
, which resulted in the gap-flow-based suction switching closer to the extreme position as compared with the mean position for the BDGF regime with
 $\phi _{g} \sim 42$
(figure 17 at
 $G^* = 2.0$
). For the transitional response, the suction switching near the extreme position delays the restoring force on the upstream cylinder, allowing it to oscillate to a larger amplitude.
The present FmSI study comprehensively investigates the flow mechanism for PIG response, resolving several long-standing questions in the literature. Galloping instability generation occurs due to the formation of two low/high suction regions on the top/bottom sides of the two cylinders, during the motion of the cylinder away from the mean position (as compared with the distinct suction region on the two cylinders for the BDGF regime). This occurs when the downstream cylinder is submerged in the wake of the upstream cylinder, i.e. both cylinders behave as a single extended body having characteristics of a non-axisymmetric galloping bluff body. Further, due to the almost in-phase
 $\phi _{g} \sim 4$
in the UDGF, the gap-flow-based suction switching from exciting to restoring occurs near the extreme position. Thus, with increasing
 $U^*$
, the larger
 $A^*$
and smaller
 $f^*$
result in two effects: first, stronger restoring lift (dip in
 $C_l$
) near extreme position; and second, a prolonged time duration for repulsive/stabilising forces to decelerate the cylinder during its motion towards the mean position. The combined effect of these forces leads to asymptotically increasing amplitude
 $A^*$
in PIG as compared with the monotonic increase in galloping of non-axisymmetric cylinders. With decreasing
 $G^*(\leqslant 0.5)$
, the stabilising/decelerating forces leads to a reduction in the PIG amplitude
 $A^*$
– leading to the existence of an optimum gap (
 $G^* = 0.5$
) for the maximum amplitude
 $A^*$
. Further, with increasing
 $U^*$
for low
 $G^*(\leqslant 0.3)$
, the prolonged exposure to these forces ultimately results in the onset of the PISV response at
 $U^*_c$
.
This study provides valuable insights into the effects of proximity interference from the downstream stationary cylinder on flow regimes in the gap and the associated vibrational response of an elastically mounted upstream cylinder. Qualitative and quantitative analyses of the gap-flow rate
 $Q^*_{g}$
are presented for a more robust demarcation of the various flow regimes in the gap and the associated vibrational response. Remarkably, a comprehensive mechanism for galloping in PIG response and a novel PISV response are presented for the first time in the literature. Additionally, an optimum gap of
 $ G^* = 0.5$
has been identified for maximum amplitude enhancement – offering potential applications in energy harvesting. For energy extraction applications, the present laminar flow study is relevant to flows with low Reynolds number – encountered many times.
Funding
We gratefully acknowledge that this work is supported by a grant (No. CRG/2022/00817) from Anusandhan National Research Foundation (ANRF), Department of Science and Technology (DST), New Delhi, India.
Declaration of interests
The authors report no conflict of interest.