


Introduction
Groutite, is a member of the diaspore group, which has the general formula M3+O(OH). Besides diaspore, AlO(OH), (Hill, Reference Hill1979; Gajda et al., Reference Gajda, Parafiniuk, Fertey, Dera and Wozniak2024) this group includes bracewellite, CrO(OH), goethite, α-Fe3+O(OH) (Gualtieri and Venturelli, Reference Gualtieri and Venturelli1999), montroseite, (V3+, Fe2+, V4+)O(OH) (Evans and Block, Reference Evans and Block1953; Evans and Mrose, Reference Evans and Mrose1955), and tsumgallite, GaO(OH) (Schlüter et al., Reference Schlüter, Klaska, Adiwidjaja and Gebhard2003). Groutite was discovered by John Walter Gruner (Gruner, Reference Gruner1947) and named in honour of Frank Fitch Grout (1880–1958), an American petrographer, geologist and mineralogist. The Commission on New Minerals, Nomenclature and Classification of the International Mineralogical Association (IMA-CNMNC) official symbol is Gro (Warr, Reference Warr2021). Like other members of the diaspore group, groutite crystallizes in the Pnma space group of the orthorhombic crystal system (Z = 4). An alternative, though non-standard, space-group setting is Pbnm.
There are currently four groutite structures deposited in the Inorganic Crystal Structure Database (ICSD) (Hellenbrandt, Reference Hellenbrandt2004). The two earliest entries in ICSD provide only basic information about the groutite structure (Collin and Lipscomb, Reference Collin and Lipscomb1949; Glasser and Ingram, Reference Glasser and Ingram1968). In these papers, the Pbnm setting was used, and we will also use this notation for reasons that will be explained later. The two most recent entries in the ICSD use the Pnma setting. The work by Kohler et al. (Reference Kohler, Armbruster and Libowitzky1997) focuses mainly on structural changes triggered by temperature within the range from room temperature (RT) to 325°C. The work by Scheinost et al. (Reference Scheinost, Stanjek, Schulze, Gasser and Sparks2001) describes results from X-ray absorption fine structure (XAFS) and X-ray absorption near-edge spectra (XANES) investigations. However, none of these studies investigated the behaviour of groutite under high pressure. A more complex investigation of groutite structure under high temperature (up to 450°C) and relatively high pressure (up to 5.5 GPa), aimed at determining the equation of state, was conducted by Wiethoff et al. (Reference Wiethoff, Grevel, Marler, Herrmann, Majzlan, Kirste and Lathe2017). Much higher pressures were achieved during investigations of other members of the diaspore group, such as AlO(OH) and CrO(OH). Friedrich et al. (Reference Friedrich, Wilson, Haussuehl, Winkler, Morgenroth, Refson and Milman2007a, Reference Friedrich, Haussuehl, Boehler, Morgenroth, Juarez-Arellano and Winkler2007b) studied the structural compression mechanism and compressibility of diaspore, initially up to 7 GPa (experimental pressure), and later up to 51.5 GPa. Despite the significant pressure of ∼50 GPa, the single-crystal X-ray synchrotron data did not reveal any phase transitions within the investigated pressure range. However, as described by Komatsu et al. (Reference Komatsu, Kuribayashi, Sano, Ohtani and Kudoh2006), a phase transition of diaspore from the α to δ phase is possible at quite severe conditions, 18 GPa and 1273 K for 10 hrs. There is also information suggesting that another member of the diaspore group, goethite, FeO(OH), may undergo a phase transition at pressure values lower than 50 GPa (Liu et al., Reference Liu, Dai, Li, Hu, Zhuang, Yang, Pu and Hong2019). Liu et al. presented evidence for pressure-induced phase transitions in goethite at ∼7.0 GPa and at ∼20.0 GPa.
In addition to groutite (α-Mn3+O(OH)), other manganese hydroxides are also known. Manganite (γ-Mn3+O(OH)) crystallizes in a monoclinic space group P21/c (Kohler et al., Reference Kohler, Armbruster and Libowitzky1997). It has been investigated within the pressure range up to 12.7 GPa, but no phase transition has been observed (Zhao et al., Reference Zhao, Xu, Zhang, Kuang, Fan, Zhou, Li and Xie2017). Feitknechtite (β-Mn3+O(OH)) is a hexagonal polymorph, but its space group has not yet been determined (Post et al., Reference Post, Heaney, Ilton and Elzinga2023).
In our work, we have focused on groutite and its potential phase transition triggered by high pressure. Our goal was to investigate changes in the structure within the pressure range from 1 GPa to 50 GPa.
Experimental
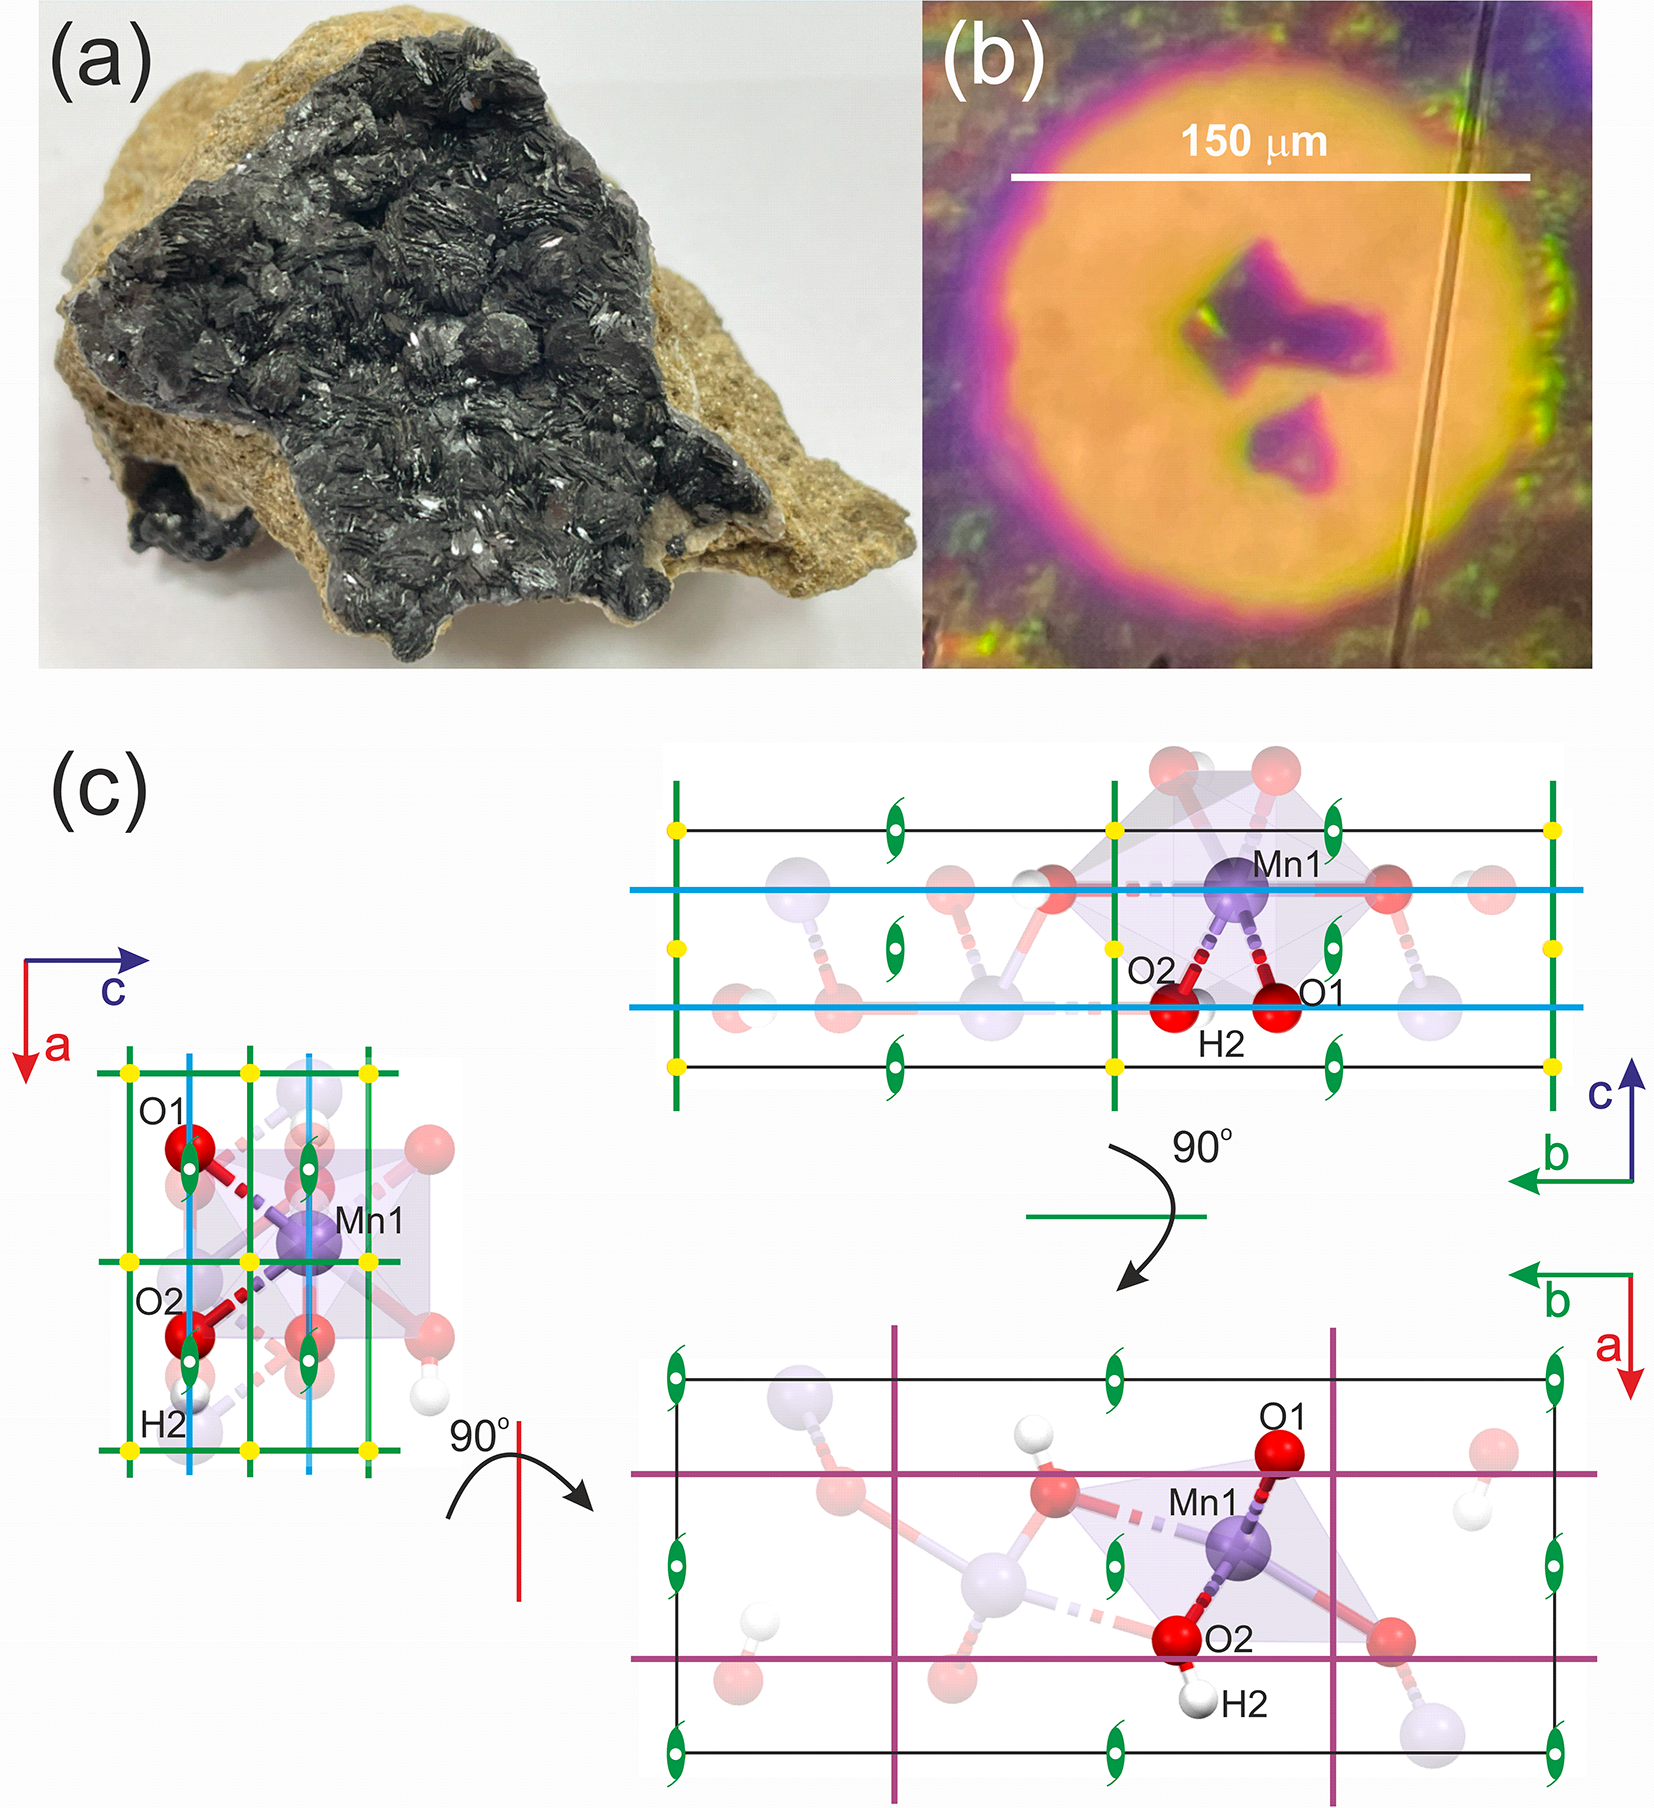
The X-ray experiment was conducted using synchrotron radiation at the CRISTAL beamline (wavelength, λ = 0.41691 Å) at the synchrotron facility SOLEIL (Saint-Aubin, France). The investigated mineral sample of groutite was obtained from the Zavalye graphite mine in Kirovohrad Oblast, Ukraine, (see Fig. 1), (Kvasnytsya and Naumenko, Reference Kvasnytsya and Naumenko2017). Three selected single crystals of groutite, each in a slightly different orientation, were placed inside a membrane diamond anvil cell (DAC) from BETSA (see Fig. 1). The diameter of the diamond culets was 300 μm. A stainless steel gasket was used, with a hole drilled in the gasket measuring 150 μm before pressure was applied. Helium was used as the pressure medium. Because the gasket hole filled in with helium shrinks significantly during the experiment, the single crystals were placed close to the centre of the culet. Their dimensions are as follows: 36 μm × 25 μm × 20 μm (crystal #1); 40 μm × 21 μm × 20 μm (crystal #2) and 28 μm × 27 μm × 20 μm (crystal #3). The effective opening angle (2θ) of the setup was ∼74°. A ruby chip was used to determine the actual pressure within the chamber. Pressure scale according to Jacobsen et al. Reference Jacobsen, Holl, Adams, Fischer, Martin, Bina, Lin, Prakapenka, Kubo and Dera(2008) was used.
(a) Macroscopic sample of groutite from Zavalye graphite mine, Kirovohrad Oblast, Ukraine (specimen from the private collection of Prof. Jan Parafiniuk, author’s photograph). (b) Selected single crystals of groutite (from the same specimen) placed in the DAC. (c) Unit cell with atomic positions (atoms from the asymmetric unit in full colour, others translucent) and symmetry elements: blue lines – mirror planes, purple lines– glides, green lines – twofold screw axis.

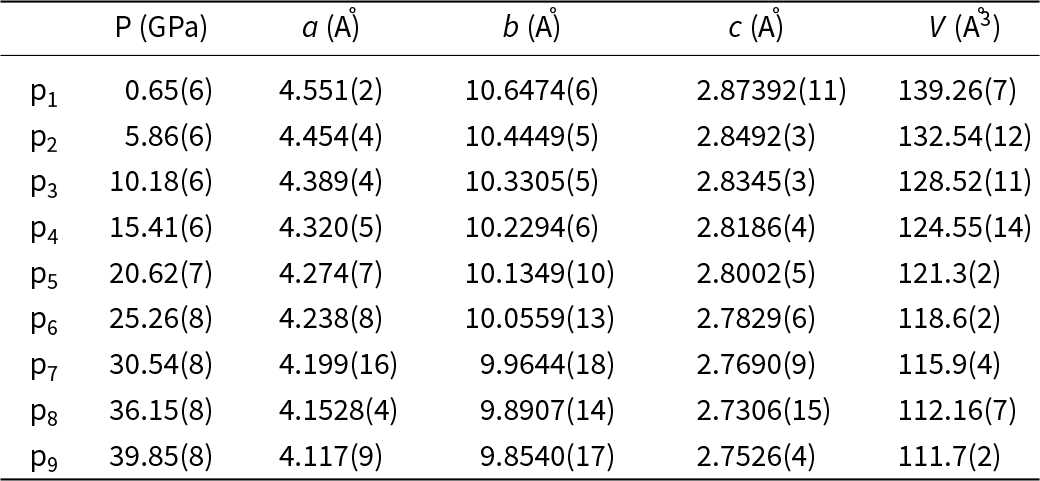
The goal was to achieve pressure values up to ∼50 GPa, but the maximum pressure actually achieved was almost 40 GPa. Data were collected at nine pressure points: 0.65(6) GPa, 5.86(6) GPa, 10.18(6) GPa, 15.41(6) GPa, 20.62(7) GPa, 25.26(8) GPa, 30.54(8) GPa, 36.15(8) GPa, and 39.85(8) GPa. At each pressure point, each of the three single crystals was measured separately. Each measurement consisted of three runs, each with a different setup of parameters such as exposure time (1 s or 5.4 s, achieved with attenuators), detector position (θ angle 0° or 15°), and sample rotation using the chi circle (κ angle 0° or 60°). As a result, the dataset collected at each pressure point generally consisted of nine runs (three runs for each of the three measured crystals). Data reduction and merging were carried out using CrysAlisPro software (CrysAlis Pro, Reference CrysAlis Pro2014). The structure was then solved and refined in the Olex2 program package (Dolomanov et al., Reference Dolomanov, Bourhis, Gildea, Howard and Puschmann2009), using ShelXS and ShelXL (Sheldrick, Reference Sheldrick2008, Reference Sheldrick2015). Additionally Jana 2020 software was used to solve and refine disordered structure at 39.85(8) GPa (Petricek et al., Reference Petricek, Palatinus, Plasil and Dusek2023). The calculations of reflection intensities, their averaging, grouping and integration were carried out using a script written by RG in the Python programming language.
Results
The crystal structure of groutite is relatively simple and comparable with the structure of diaspore, AlO(OH), (Gajda et al., Reference Gajda, Parafiniuk, Fertey, Dera and Wozniak2024). The crystal system is orthorhombic (crystal space group Pbnm/Pnma), with four formula units within the unit cell. The unit cell dimensions are as follows: a = 4.560(2) Å, b = 10.700(5) Å and c = 2.870(1) Å in the Pbnm setting (Glasser and Ingram, Reference Glasser and Ingram1968). Its main building blocks are MnO6 octahedra. Three mirror and glide planes (n, m and a) pass through each unit cell perpendicularly to X, Y and Z, respectively. All of the atoms are placed on the mirror planes (Fig. 1c). As a result, each atom is at a special position with the occupation factor equal to ½ (this is the site multiplicity). There are one manganese, one hydrogen atom and two types of oxygen atoms (one of them is bonded with hydrogen and the other is not) in the asymmetric part of the unit cell. Each Mn atom is surrounded by six oxygen atoms (three bonded to hydrogen atoms and three not bonded).
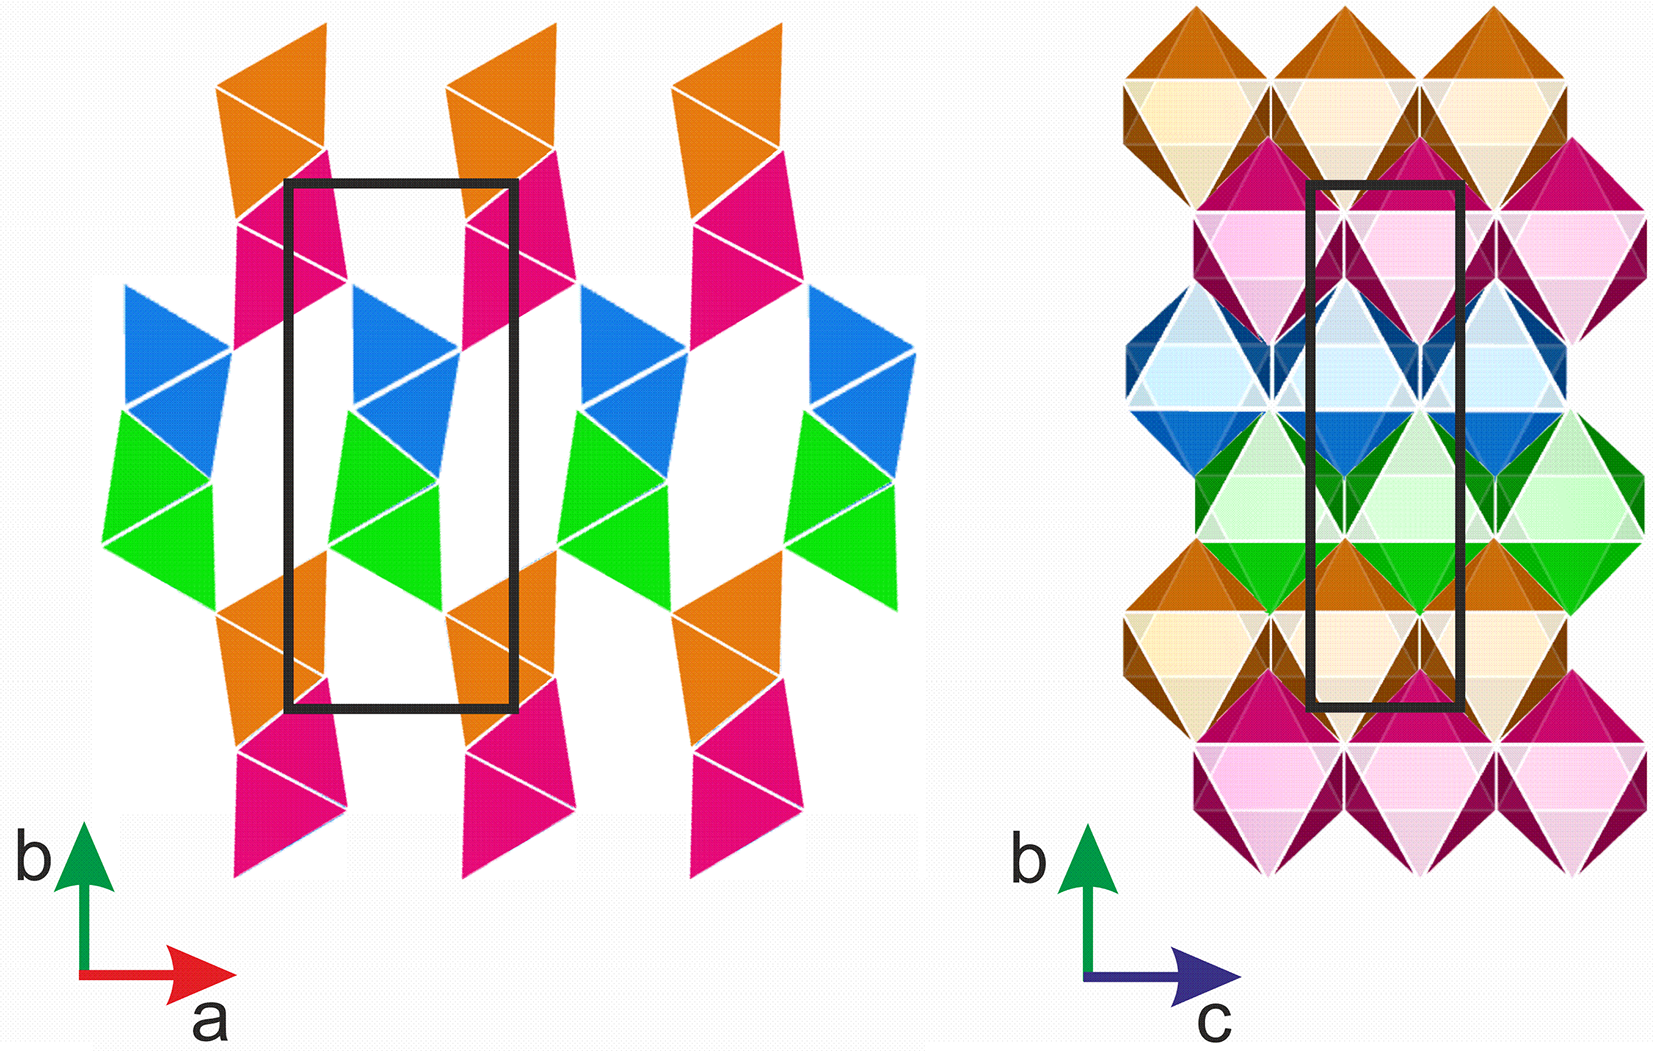
In the MnO(OH) structure, the edge-sharing MnO6 octahedra are organized in rows along the X-direction. Within such a row, the octahedra have the same orientation. Each row of octahedra is connected with three other rows, with one of them sharing edges, and two other sharing vertices. Tunnels in the crystal structure along the Z-axis are formed between the rows connected in this manner.
To simplify this description, we can distinguish four repeating types of rows within the groutite structure (depicted with different colours in Fig. 2). The empty spaces between octahedral ribbons in the crystal structure of groutite, clearly visible along the [001] direction, host H-bonds. However, the H-bonds have been omitted for clarity in Fig. 2.
Arrangement of MnO6 tetrahedra within groutite unit cell at 0.65 (6) GPa, views along: [001] and [100] (from left to right). Black rectangles show the borders of the unit cell.

Figure 2 Long description
The diagram consists of two images depicting the arrangement of MnO tetrahedra within a groutite unit cell. On the left, the view is along the [001] direction, showing rows of tetrahedra in alternating colors: orange, blue, green and pink. These rows are arranged vertically, with black rectangles outlining the borders of the unit cell. The axes are labeled with ′a′ pointing right and ′b′ pointing up. On the right, the view is along the [100] direction, displaying a more complex arrangement of tetrahedra in a grid-like pattern. The colors include orange, blue, green, pink and additional shades, with black rectangles again marking the unit cell boundaries. The axes here are labeled with ′b′ pointing up and ′c′ pointing right. The arrangement highlights the structural organization of the tetrahedra within the unit cell from different perspectives.
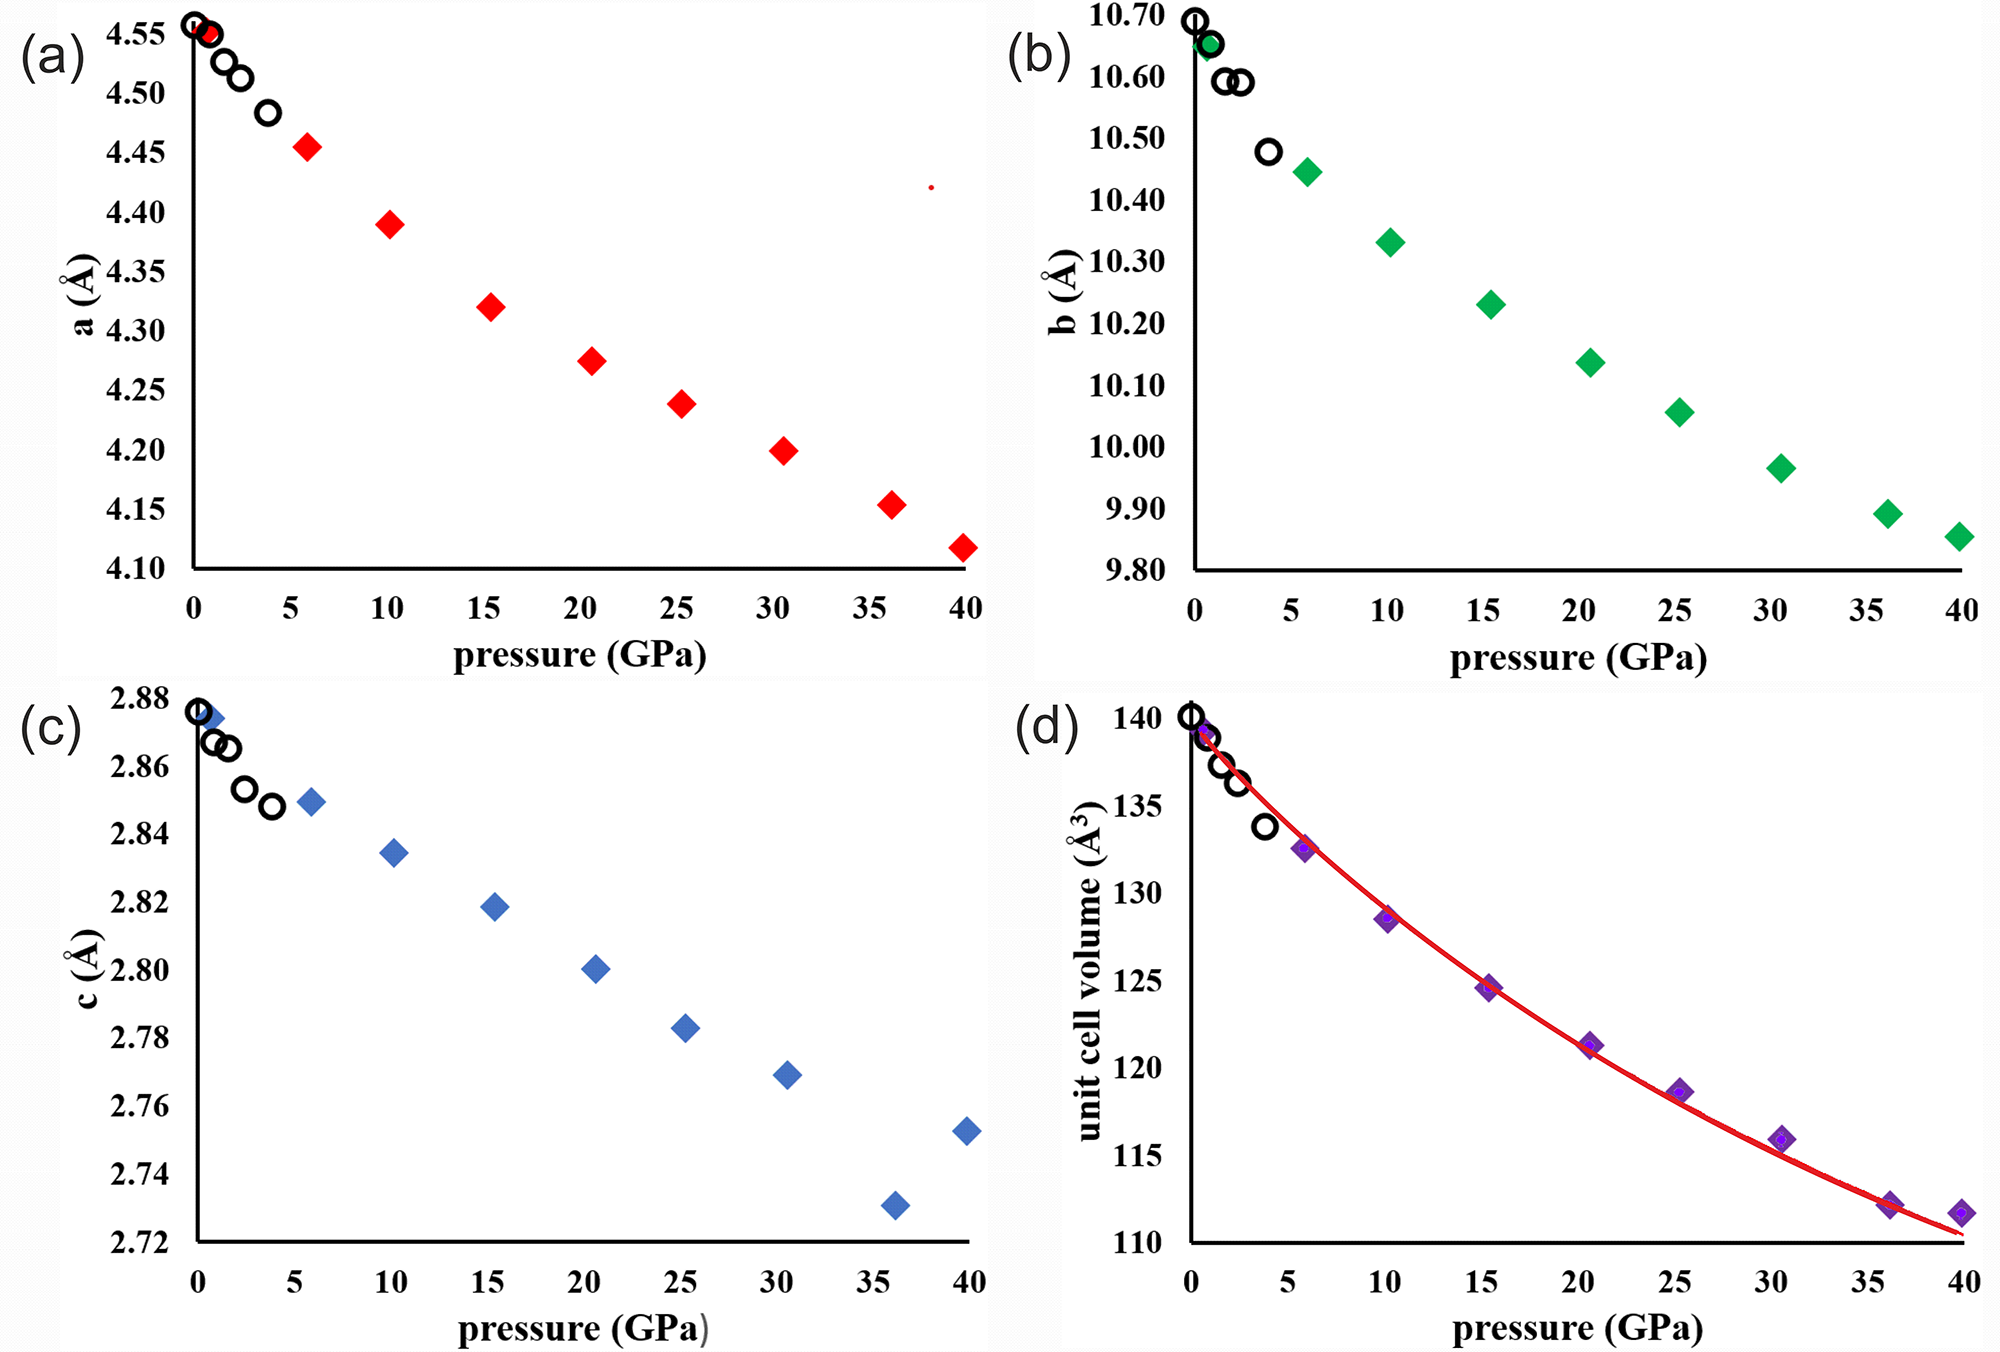
The unit cell dimensions shrink noticeably (see Table 1) as a function of pressure. Within the pressure range from 0.65(6) GPa to 39.85(8) GPa, the parameter a shrinks by about 9.5%, b by ∼7.5%, c by ∼4.2%, and the total unit cell volume V by ∼19.5%. Observed changes of the unit cell parameters correlate very well with those observed by Wiethoff et al. (Reference Wiethoff, Grevel, Marler, Herrmann, Majzlan, Kirste and Lathe2017) (see Fig. 3). Literature data to prepare Fig. 3 was taken from Table S1 presented in supplementary material corresponding with a publication written by Wiethoff et al. (run R06 in this table). Some discrepancies could be perceived for the c parameter but we must be aware of the fact that each subfigure has a different scale on the y-axis.
Unit cell dimensions and unit cell volume as a function of pressure. Open circles are literature data points provided by Wiethoff et al. (Reference Wiethoff, Grevel, Marler, Herrmann, Majzlan, Kirste and Lathe2017). The red solid line in (d) represents the equation of state fitted to the all pressure points.

Figure 3 Long description
The image A showing a scatter plot with the horizontal axis labeled pressure (GPa) and the vertical axis labeled a (Å). The horizontal axis ranges from 0 to 40. The vertical axis ranges from 4.10 to 4.55. Plotted points appear at approximately: (0.65, 4.551), (5.86, 4.454), (10.18, 4.389), (15.41, 4.320), (20.62, 4.274), (25.26, 4.238), (30.54, 4.199), (36.15, 4.1528), (39.85, 4.117). The image B showing a scatter plot with the horizontal axis labeled pressure (GPa) and the vertical axis labeled b (Å). The horizontal axis ranges from 0 to 40. The vertical axis ranges from 9.80 to 10.70. Plotted points appear at approximately: (0.65, 10.6474), (5.86, 10.4449), (10.18, 10.3305), (15.41, 10.2294), (20.62, 10.1349), (25.26, 10.0559), (30.54, 9.9644), (36.15, 9.8907), (39.85, 9.8540). The image C showing a scatter plot with the horizontal axis labeled pressure (GPa) and the vertical axis labeled c (Å). The horizontal axis ranges from 0 to 40. The vertical axis ranges from 2.72 to 2.88. Plotted points appear at approximately: (0.65, 2.87392), (5.86, 2.8492), (10.18, 2.8345), (15.41, 2.8186), (20.62, 2.8002), (25.26, 2.7829), (30.54, 2.7690), (36.15, 2.7306), (39.85, 2.7526). The image D showing a scatter plot with the horizontal axis labeled pressure (GPa) and the vertical axis labeled unit cell volume (Å3). The horizontal axis ranges from 0 to 40. The vertical axis ranges from 110 to 140. Plotted points appear at approximately: (0.65, 139.26), (5.86, 132.54), (10.18, 128.52), (15.41, 124.55), (20.62, 121.3), (25.26, 118.6), (30.54, 115.9), (36.15, 112.16), (39.85, 111.7). A smooth curve is drawn through the plotted points.
Unit cell parameters of groutite at different pressures

On the basis of collected experimental data presented in Fig. 3, one can fit a third order Birch–Murnaghan equation of state:
 \begin{equation*}
P = 1.5* {K_{T}}*\left[{V_{T,r}^{-7} - V_{T,r}^{- 5}}\right]*\left[{1 - 0.75*\left({4 - K_T^{\prime}}\right)*\left({V_{T,r}^{- 2} - 1}\right)} \right]\end{equation*}
Where:  ${V_{T,r}} \equiv {\left(\frac{V}{{{V_{T,0}}}}\right)^{1/3}}$ and
 $\textstyle V_{T,0}=V_0exp\left(\int{\unicode{x03B1}}_{T,0}dT\right)$
Where: V is the unit cell volume at high pressure P (in GPa) and temperature T (in K), and V 0 is the volume at ambient pressure. K T = K + (dK T/dT)p × (T – T 0), KʹT and V T,0 are the isothermal bulk modulus, its pressure derivative and the unit cell volume at temperature and 0.1 MPa, respectively, T 0 = 298.15 K. The thermal expansion at ambient pressure αT ,0 can be approximated as αT ,0 = α + bT.
Using this method, we obtained the values of the isothermal bulk modulus K, its pressure derivative Kʹ and volume at ambient pressure V 0. The fitting procedure was conducted with the use of the EoSFit7 software (Gonzalez–Platas et al., Reference Gonzalez-Platas, Alvaro, Nestola and Angel2016). The results are as follows: V 0 = 140.0(3) (Å3), K = 100(6) (GPa) and Kʹ = 4.5(5) (for all nine pressure points, see Fig. 3d) and V 0 = 140.3(1) (Å3), K = 87(3) (GPa) and Kʹ = 6.8(5) where two pressure points (36.15(8) GPa and 39.85(8) GPa) are excluded. For comparison, the results obtained by Wiethoff et al. (Reference Wiethoff, Grevel, Marler, Herrmann, Majzlan, Kirste and Lathe2017) for much narrower pressure range from 0 to 5.38 GPa are as follows: V 0 = 139.92 (Å3), K = 84.0 (GPa) and Kʹ = 4.
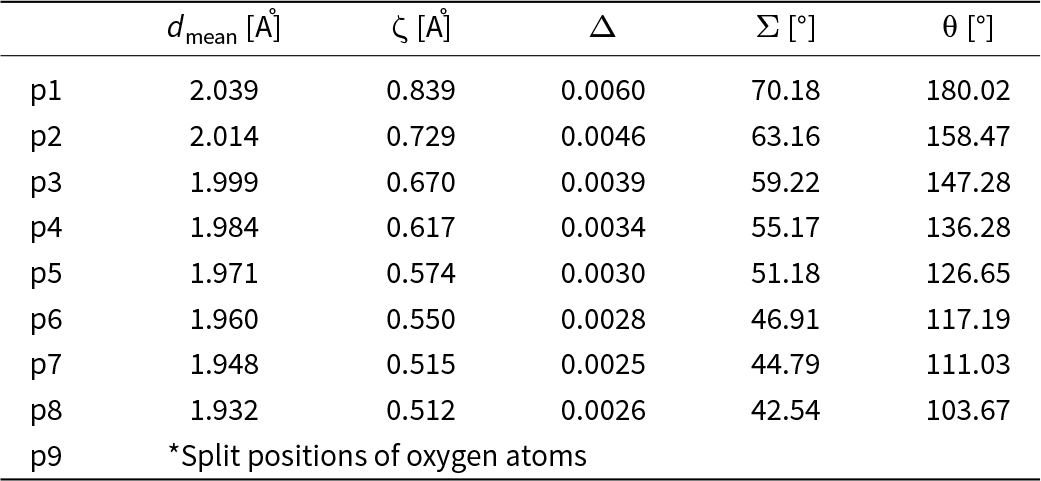
One of the noticeable consequence of rising pressure, next to the shrinking of the unit cell dimensions, is the deformation of the MnO6 octahedra. We tried to describe this deformation by a set of parameters. Parameter d mean, used in Table 2, refers to the average Mn–O distance in the MnO6 octahedron. Other parameters such as ζ and Σ are describing stretching, angular and torsional distortions, respectively. Parameters ζ, Δ, Σ and θ are defined as follows:
 \begin{equation*}\zeta = \sum\limits_{i = 1}^6 {\left| {{d_i} - {d_{mean}}} \right|} \end{equation*}
 \begin{equation*}{{\Delta }} = \frac{1}{6}\mathop \sum \limits_{i = 1}^6 {\left( {\frac{{{d_i} - {d_{mean}}}}{{{d_{mean}}}}} \right)^2}\end{equation*}
 \begin{equation*}{{\Sigma }} = {\text{ }}\mathop \sum \limits_{i = 1}^{12} \left| {90{ - \unicode{x03C6}_i}} \right|\end{equation*}
 \begin{equation*}{{\unicode{x03B8} }} = {\text{ }}\mathop \sum \limits_{i = 1}^6 \left| {{{{\unicode{x03B8} }}_i} - 60} \right|\end{equation*}
Octahedral distortion parameters

Table 2 Long description
Rows p1 through p8 list octahedral distortion parameters for eight positions, giving mean bond length in angstroms, zeta in angstroms, delta, sigma in degrees, and theta in degrees. All measures generally decrease from p1 to p8, indicating progressively smaller distortions and shorter mean bond lengths across the series. Mean bond length falls from 2.039 angstroms at p1 to 1.932 angstroms at p8. Zeta drops from 0.839 angstroms at p1 to 0.512 angstroms at p8, with p7 at 0.515 angstroms and p8 slightly lower. Delta declines from 0.0060 at p1 to 0.0025 at p7, then rises slightly to 0.0026 at p8. Sigma decreases steadily from 70.18 degrees at p1 to 42.54 degrees at p8. Theta also decreases from 180.02 degrees at p1 to 103.67 degrees at p8. The final row p9 is not a numeric entry and instead notes split positions of oxygen atoms, so it should not be compared directly with the numeric rows.
*At this pressure point, we observe disorder among the oxygen atoms; therefore, the distortion parameters have not been determined.
Parameter ζ is the average of the sum of the deviation of six unique Mn–O bond lengths around the central Mn atom (d i) from the average value (d mean). Parameter Δ is known as an octahedral distortion parameter (Lufaso and Woodward, Reference Lufaso and Woodward2004). Parameter Σ is the sum of the deviations of 12 unique cis O–Mn–O angles (ϕi) from 90°. θ represents a distortion from a perfect octahedral (Oh) to a trigonal prismatic geometry (D3h). All the mentioned parameters were calculated with use of OctaDist software (Ketkaew et al., Reference Ketkaew, Tantirungrotechai, Harding, Chastanet, Guionneau, Marchivie and Harding2021). Information about all Mn–O distances in the MnO6 octahedra are summarized in Table S1 in Supplementary materials.
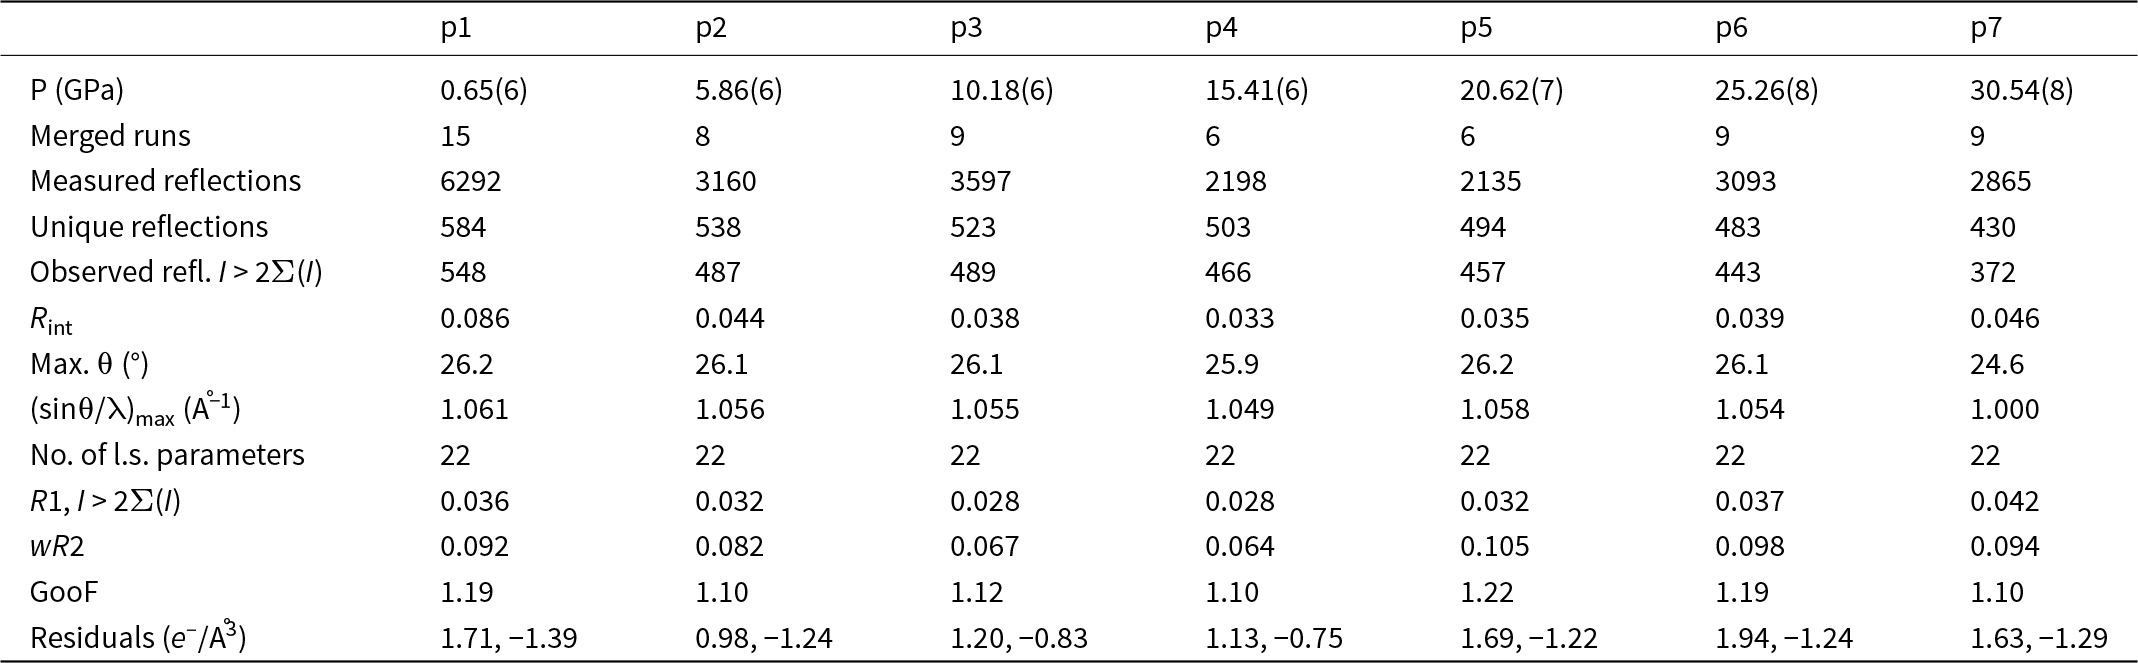
Some basic information about the refinement results for the groutite structure in Pbnm within the pressure range from 1 to 30 GPa is presented in Table 3. A paragraph explaining the different number of merged runs in different pressure points is in the Supplementary materials. We have applied a riding model in the process of refinement of hydrogen atoms. U iso of H atoms are constrained to 1.2 of the values for the bonded O atoms. Within the pressure range from 1 GPa to 15 GPa, the observed length of the O–H bond was too short (which is typical for the X-ray data) so DFIX setting the O–H distance as 0.82 Å was used. Above 20 GPa we observe that the O–H bond is extremely elongated and its value oscillates around 1.2 Å. Simultaneously, the distance between neighbouring O atoms is ∼2.4 Å. We believe that it could be explained by the fact that as a result of structure shrinking hydrogen atoms find a position half way to the next neighbouring O atom which is known as symmetrization of hydrogen bonding.
Details pertaining to the intensity data collections and structure refinements of groutite in Pbnm phase at different pressures (λ = 0.41691 Å)

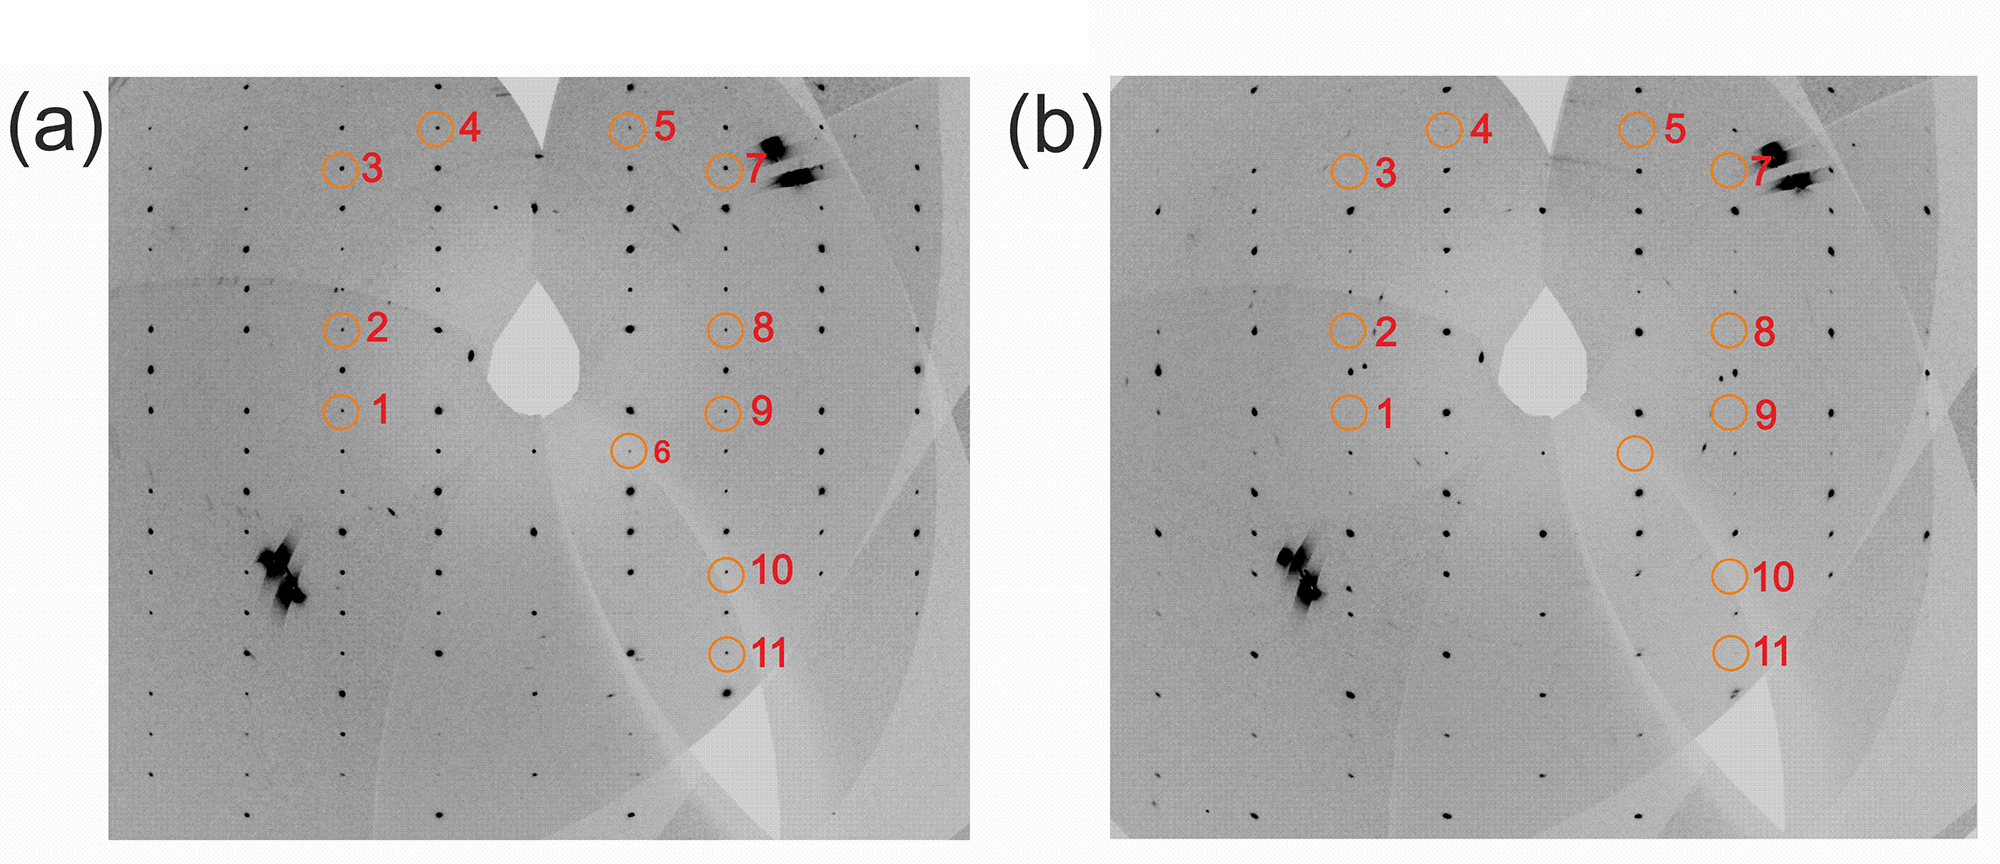
With the increase of pressure, in addition to the above mentioned unit-cell shrinking and deformation of MnO6 octahedra, another phenomenon becomes more and more visible. We have observed that above 30 GPa specific groups of reflections lose their intensities and disappear. As shown, for example, in Fig. 4, a specific group of reflections that follows the rule hk0 h + k = 2n + 1 is partly absent.
Reconstruction of the 0*Y*Z 0kl reciprocal lattice plane at (a) 20 GPa and (b) 39 GPa in setting Pbnm which corresponds to X*Y*0 hk0 in setting Pnma. Specific systematic extinctions, which fulfils the rule h + k = 2n+1 (Pnma setting) which corresponds with k + l = 2n +1 (Pbnm setting) can be observed. List of encircled reflections: 1) 0,–2,–1; 2) 0,–2,1; 3) 0,–2,5; 4) 0,–1,6; 5) 0,1,6; 6) 0,1,–2; 7) 0,2,5; 8) 0,2,1; 9) 0,2,–1; 10) 0,2,–5; 11) 0,2,–7.

The main question which needs to be answered is why some reflections lose their intensity. We see that there is a certain particular pattern in it. Reflections, which are disappearing, are not random. In fact, decreasing intensities of reflections are associated with certain groups of them. This may indicate that they are affected by the pressure crystal structure when it just starts to change in a certain direction. Can one predict in which direction this change is heading? Analysis of the groups of weakening reflections allows us to assume that the unit cell changes from the primitive (P-lattice) to the base-centred (C-lattice) one. This also will be accompanied by the appearance of additional symmetry elements. When we assume that all the groups of reflections, which are significantly less intense, will disappear completely, then reflection extinction conditions for the Cmcm space group will be fulfilled. We have to underline here that at 39 GPa pressure, the reflections conditions for the Cmcm space group are not yet fully met, however we already have reasons to consider if the phase transition from Pbnm to Cmcm is possible and likely in this structure. We decided to refine the groutite structure before the transformation in Pbnm rather than Pnma, as this allows for a direct comparison of the unit cells in Pbnm and Cmcm without requiring any unit cell transformation.
Examples of phase transitions in minerals between the space groups Pbnm and Cmcm are known in the literature. One of the best studied example is SnSe, which undergoes a high-pressure phase transition from Pbnm to Cmcm under ca. 2.5 GPa (Ivanova et al., Reference Ivanova, Troyan, Chareev, Gavriliuk, Starchikov, Baskakov, Frolov, Mezouar and Lyubutin2018; Aseginolaza et al., Reference Aseginolaza, Bianco, Monacelli, Paulatto, Calandra, Mauri, Bergara and Errea2019). More than 100 scientific papers describing different aspects of phase transition in this layered semiconductor have been published so far, which shows how this structure could be transferred, including in seemingly simple arrangements.
When we examine the Bragg peaks within the investigated pressure range, we observe that their intensities can change significantly. To systematize this issue, we decided to focus primarily on groups of reflections that are crucial for understanding a potential phase transition from Pbnm to Cmcm. Because the sample is placed in a pressure cell, which limits access to the reciprocal space, not every group of reflections is well represented in the list of all measured reflections. Additionally, the particular orientations of the measured single crystals affects the list of reflections. Therefore, we decided to first consider reflections that either fulfil or do not fulfil the following conditions: hkl h + k = 2n and its subgroup hk0 h + k = 2n. The first general condition hkl; h + k = 2n is true for the Cmcm space group, but does not occur in Pbnm. This means that if there is no phase transition, reflections that do not fulfil this condition should still be visible. When these reflections disappear, this may suggest that a phase transition is occurring. This is obviously also true for the subgroup hk0 h + k = 2n, but in this case, we can also quickly verify it by visually inspecting the reconstruction of the reciprocal lattice planes 0*Y*Z 0kl (see Fig. 4)
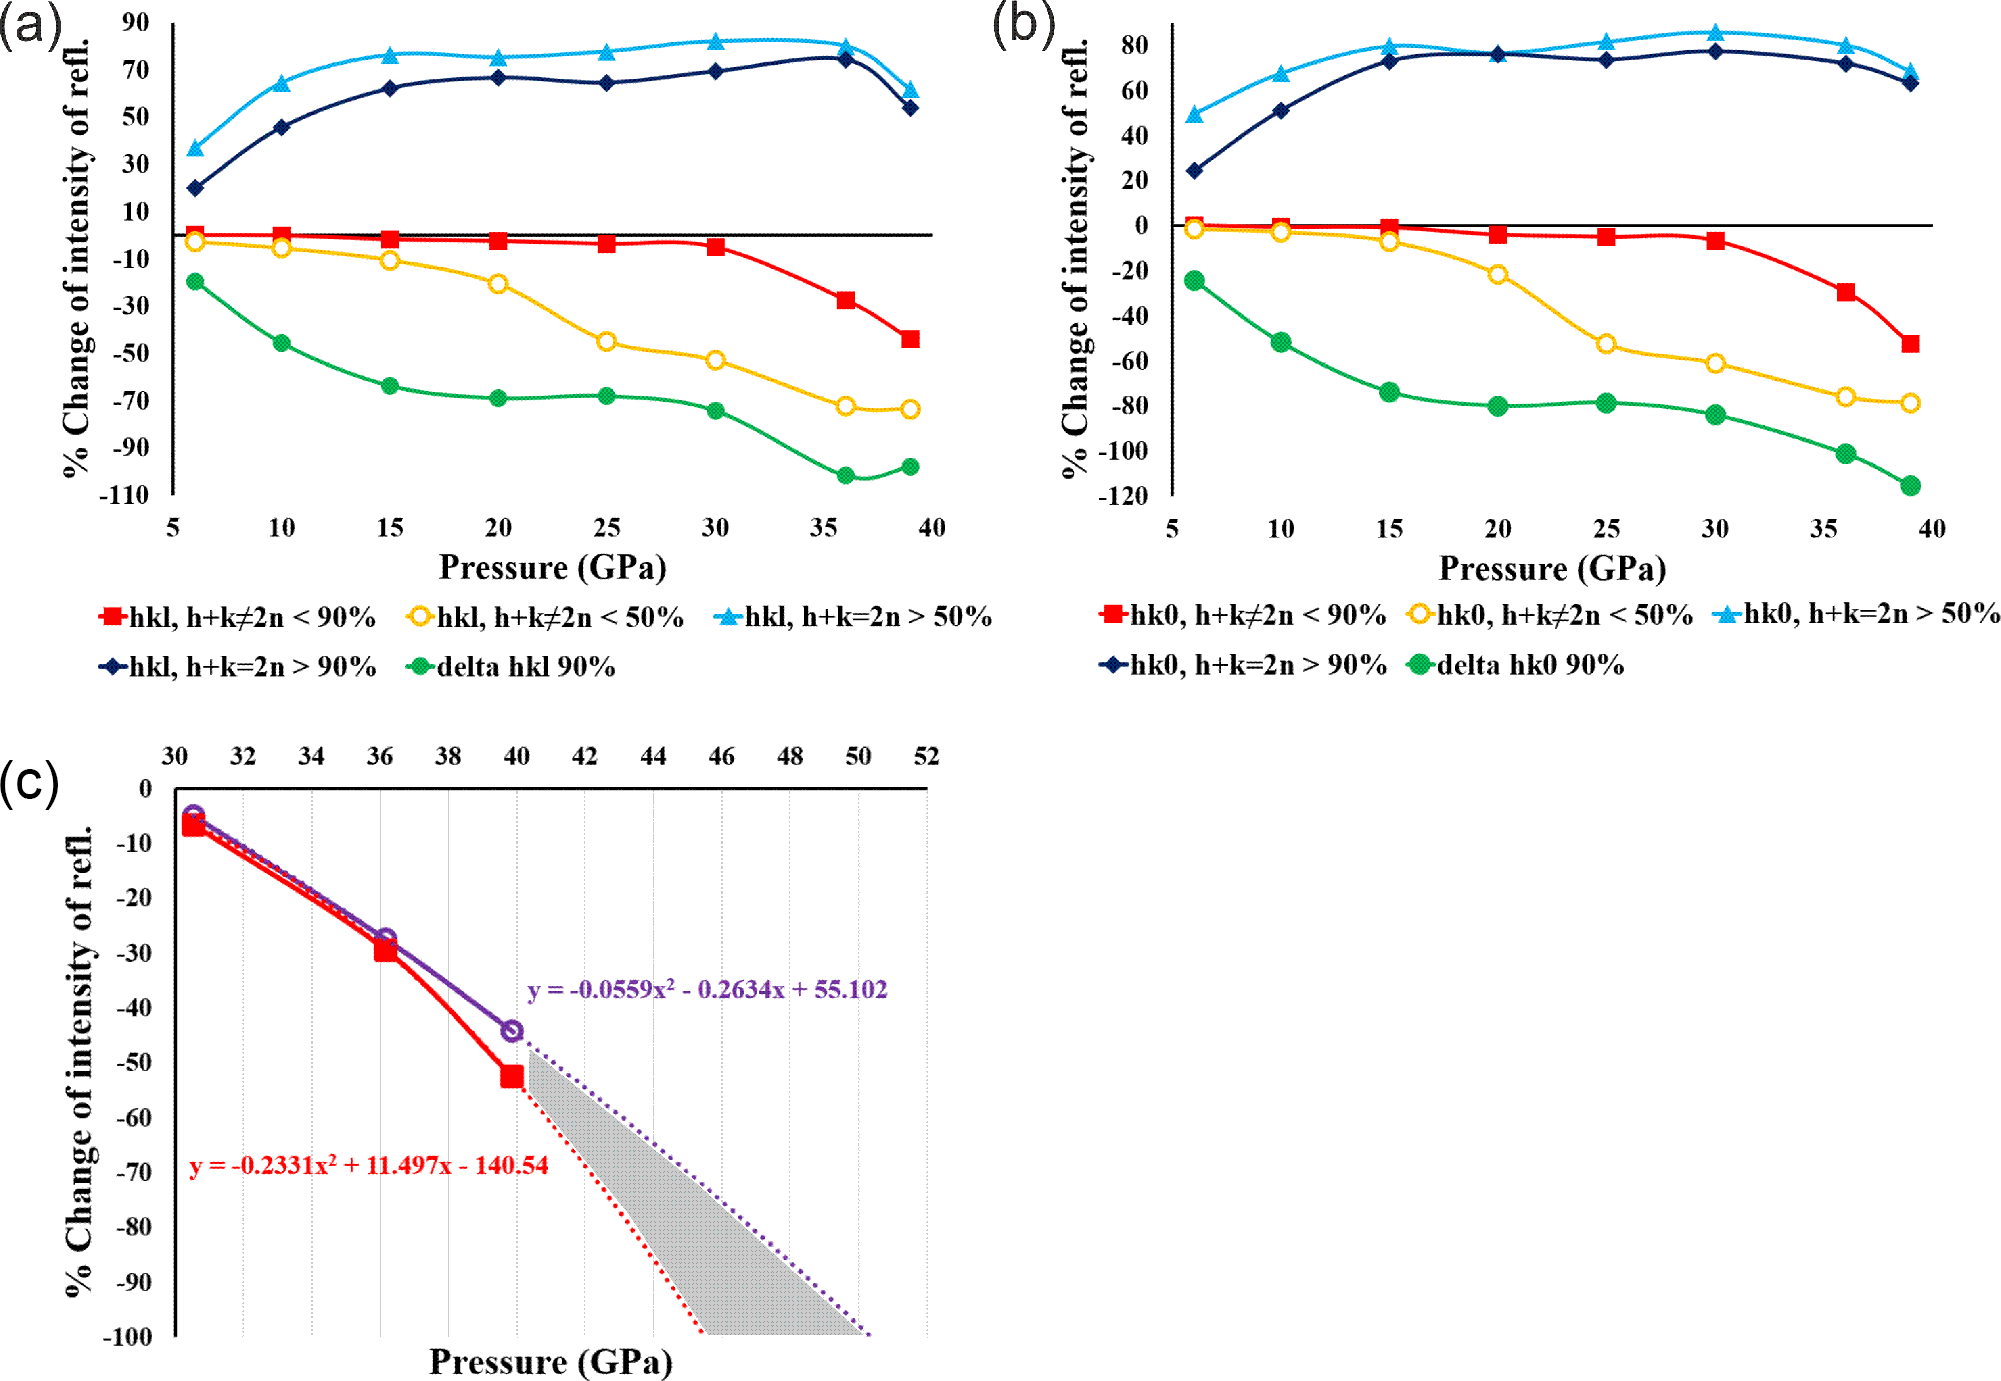
To track absent reflections and intensity changes we applied two intensity thresholds: 50% and 90% (for details see Supplementary material) and compared the intensities of reflections at each pressure point to the reference pressure (p1) (see Fig. 5). We observe that at 15 GPa, in both investigated groups of reflections, hkl h + k ≠ 2n and hk0 h + k ≠ 2n, a significant proportion of reflections show intensities that are weakened by at least 50%, and this proportion increases with pressure. To estimate the fraction of absent reflections, we used a threshold of 90%. This means that when the intensity of a particular reflection decreases by at least 90%, we treat it as practically absent. As we can see from Fig. 5, after 30 GPa, the fraction of Bragg peaks weakened by 90% or more increased sharply. We believe that above 30 GPa, the transformation from Pbnm to Cmcm begins, and the percentage of Bragg peaks hkl h + k ≠ 2n and hk0 h + k ≠ 2n is a good indicator of this process.
Reflection intensity chart. The light blue line represents the fraction of the reflection, the intensity of which increased by at least 50%. The navy blue line represents the fraction of the reflection, the intensity of which increased by at least 90%. The yellow line represents the fraction of the reflection, the intensity of which decreased by at least 50% and red line, the intensity of which decreased by 90%. The green line represents a comparison of how much the intensity of the group of reflections described by the red line decreases relative to the reflections described by the navy blue line. In (c) is an extrapolation (on the basis of experimental points) showing how quickly the considered group of reflections could disappear completely.

Figure 5 Long description
The figure contains three sub-images labeled (a), (b) and (c). (a) The y-axis is labeled “percent Change of intensity in rel.” The x-axis is labeled “Pressure (GPa)”. The x-axis tick labels shown are 10, 15, 20, 25, 30, 35, 40. The y-axis tick labels shown are 0, 20, 40, 60, 80 and the plotted lines also extend below the 0 line into negative values. A legend below the plot lists six series: “hkl, h plus k equals 2n”, “hkl, h plus k not equals 2n”, “hk0, h plus k equals 2n”, “hk0, h plus k not equals 2n”, “delta I 50 percent” and “delta I 90 percent”. Six lines with point markers are plotted across the pressure ticks. Two series increase from about 40 at 10 to about 70 by 20, remain near about 70 through 35, then drop slightly at 40. Four series decrease from near 0 at 10 with the following approximate sequences: one series stays near 0 through about 30, then is about minus 10 at 35 and about minus 30 at 40; one series is about minus 10 at 15, about minus 30 at 20, about minus 50 at 25, about minus 60 at 30, about minus 70 at 35 and about minus 80 at 40; one series is about minus 30 at 15, about minus 50 at 20, about minus 60 at 25, about minus 60 at 30, about minus 70 at 35 and about minus 90 at 40; one series is about minus 40 at 15, about minus 60 at 20, about minus 70 at 25, about minus 70 at 30, about minus 80 at 35 and about minus 90 at 40. (b) The y-axis is labeled “percent Change of intensity in rel.” The x-axis is labeled “Pressure (GPa)”. The x-axis tick labels shown are 10, 15, 20, 25, 30, 35, 40. The y-axis tick labels shown are 0, 20, 40, 60, 80 and the plotted lines also extend below the 0 line into negative values. The legend below the plot lists the same six series names as in (a): “hkl, h plus k equals 2n”, “hkl, h plus k not equals 2n”, “hk0, h plus k equals 2n”, “hk0, h plus k not equals 2n”, “delta I 50 percent” and “delta I 90 percent”. Six lines with point markers are plotted. Two series rise from about 40 at 10 to about 70 by 20, stay near about 70 through 35, then drop slightly at 40. Four series decrease from near 0 at 10 with the same approximate sequences described in (a): near 0 through about 30 then about minus 10 at 35 and about minus 30 at 40; about minus 10 at 15, minus 30 at 20, minus 50 at 25, minus 60 at 30, minus 70 at 35, minus 80 at 40; about minus 30 at 15, minus 50 at 20, minus 60 at 25, minus 60 at 30, minus 70 at 35, minus 90 at 40; about minus 40 at 15, minus 60 at 20, minus 70 at 25, minus 70 at 30, minus 80 at 35, minus 90 at 40. (c) The y-axis is labeled “percent Change of intensity in rel.” The x-axis is labeled “Pressure (GPa)”. The x-axis tick labels shown are 30, 32, 34, 36, 38, 40, 42, 44, 46, 48, 50, 52. The y-axis tick labels shown are 0, minus 20, minus 40, minus 60, minus 80, minus 100. Two solid curves with point markers are plotted near the lower-pressure end, passing through about (30, minus 5), (34, minus 30) and (36, minus 40), then continuing downward. Two dotted fitted lines extend downward toward higher pressure and a shaded region lies between the two dotted lines. Two equation annotations are printed near the dotted lines, one near the higher-pressure side and one near the lower-pressure side.
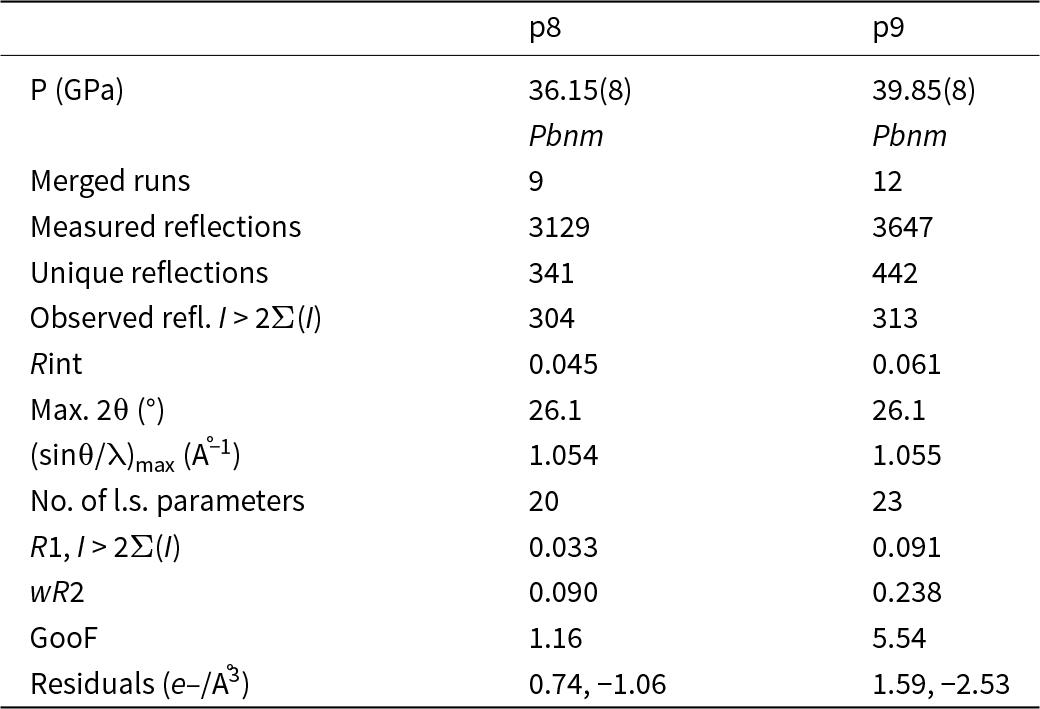
Refinements of the groutite structure for two pressure points: 36.15(8) GPa and 39.85(8) GPa are presented in Table 4. At these pressure points, the percentage of reflections from the considered groups, whose intensities have weakened by 90% or more, varies between 40% and 50%. This is why it is still possible to refine the structures in the ‘old’ space group Pbnm, as ∼50% of reflections that should be forbidden in Cmcm are still observed, although significantly weakened. As ∼50% of the reflections forbidden in the Cmcm space group have already been significantly weakened or are not observed, we cannot yet refine the structure in the Cmcm space group, but we do it instead in a so called intermediate stage, which is the Pbnm space group with split oxygen positions (see Table 4).
Details pertaining to the intensity data collections and structure refinements of groutite in Pbnm phase at different pressures (λ = 0.41691 Å)

Table 4 Long description
Two datasets compare intensity collection and structure refinement statistics for groutite in the Pbnm phase at about 36.15 and 39.85 gigapascals. Both are indexed as Pbnm, with 9 merged runs at 36.15 GPa and 12 at 39.85 GPa. Measured reflections increase from 3129 to 3647, and unique reflections increase from 341 to 442, while observed reflections above the stated intensity threshold rise slightly from 304 to 313. Data consistency decreases with pressure, with Rint increasing from 0.045 to 0.061. The maximum two-theta is the same for both (26.1 degrees), and the maximum sin theta over wavelength is nearly unchanged (about 1.054 to 1.055 inverse angstroms). Refinement complexity increases from 20 to 23 least-squares parameters, but refinement indicators worsen: R1 increases from 0.033 to 0.091, weighted R2 increases from 0.090 to 0.238, and goodness of fit increases from 1.16 to 5.54. Residual electron density becomes larger in magnitude at higher pressure, changing from 0.74 and minus 1.06 to 1.59 and minus 2.53 electrons per cubic angstrom, suggesting a poorer fit or more challenging data at 39.85 GPa.
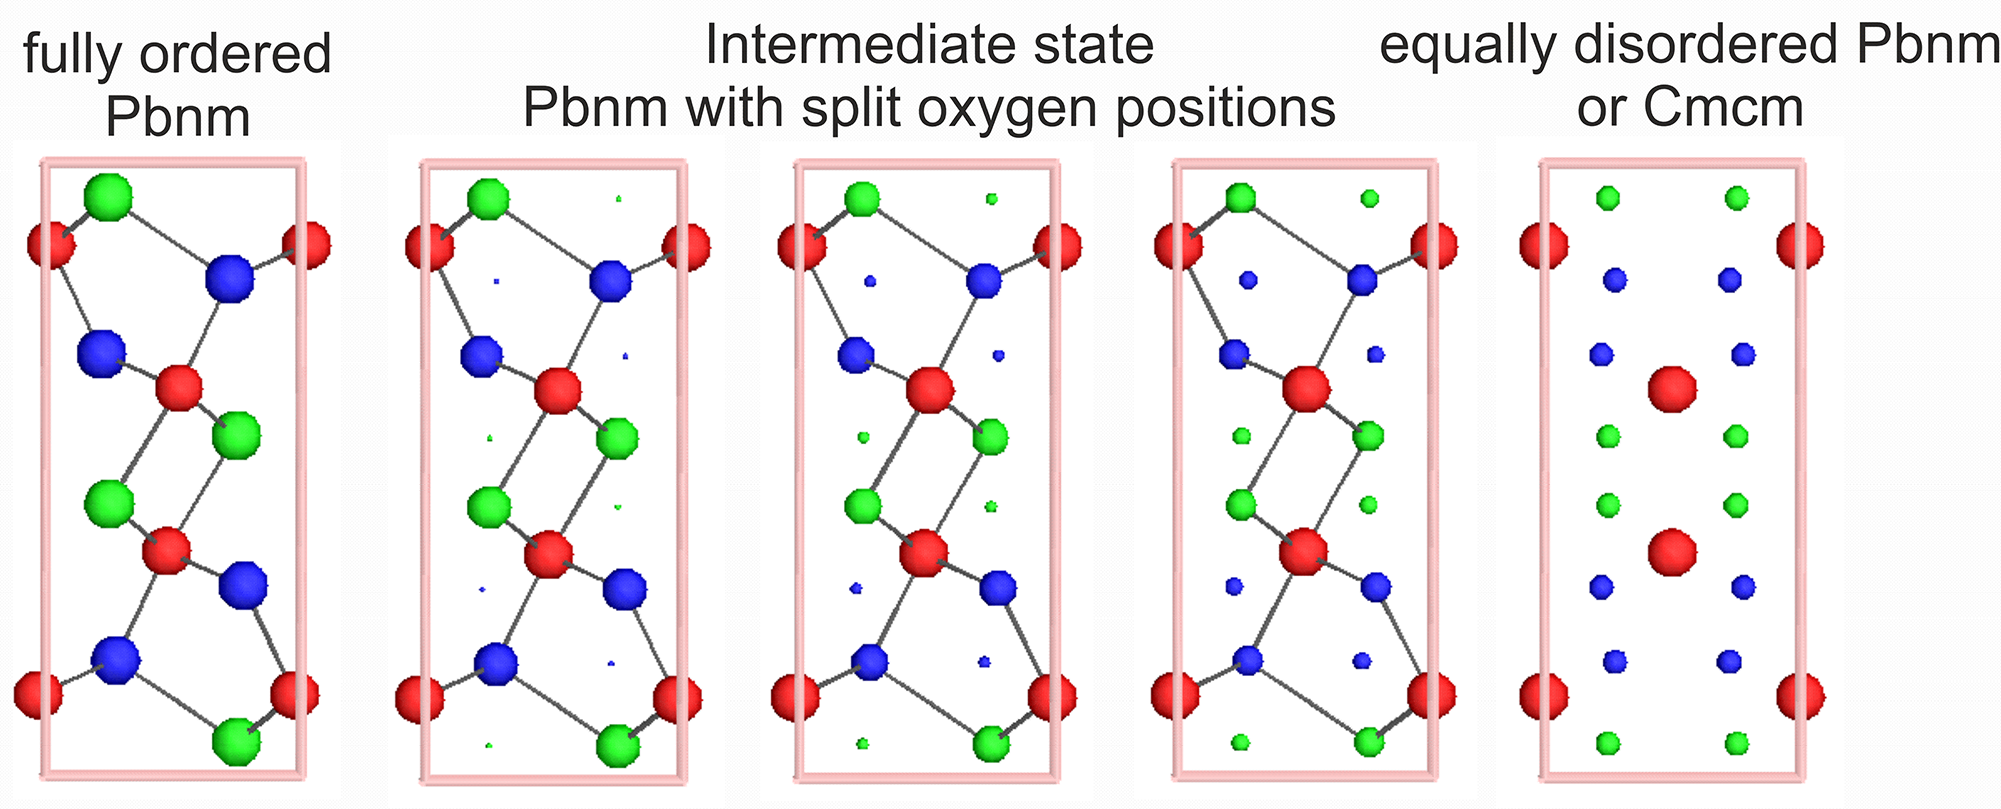
We used Isodistort software (Campbell et al., Reference Campbell, Stokes, Tanner and Hatch2006) to visualize what the reverse phase transition from Cmcm space group (as a parent) to Pbnm (as a child) might look like. Isodistort is a tool for exploring distorted crystal structures in terms of the symmetry modes of the irreducible representations of the parent space-group symmetry. A distorted (child) structure, in our case groutite in the Pbnm space group, can be described as a symmetry-lowering deviation from an undistorted reference (parent) structure, in our case groutite in the Cmcm space group. The transformation of the groutite crystal structure between Cmcm and Pbnm is shown in Fig. 6. In our case, at the beginning, we have the ordered structure of groutite in the Pbnm space group. This corresponds to our refinement results from pressure points within the range from 1 GPa to 30 GPa.
Steps of transformation between Pbnm and Cmcm space group. Red circles – Mn, green circles – O1, blue circles – O2. View along [001] direction.

Figure 6 Long description
The diagram illustrates the transformation steps between Pbnm and Cmcm space groups. It consists of five stages, each represented by a vertical arrangement of circles within a rectangular frame. The first stage, labeled ′fully ordered Pbnm,′ shows a structured arrangement with red circles representing Mn, green circles for O1 and blue circles for O2. The second stage, ′Pbnm with split oxygen positions,′ displays a similar structure with slight variations in the positions of the green and blue circles. The third stage, ′Intermediate state,′ shows further splitting and rearrangement of the oxygen positions. The fourth stage, ′equally disordered Pbnm,′ depicts a more randomized distribution of the circles. Finally, the fifth stage, ′or Cmcm,′ presents a similar disordered arrangement, indicating a transition to the Cmcm space group. Each stage visually represents the gradual transformation and disordering of the atomic positions.
At 39 GPa pressure, it is possible to solve the structure still in the Pbnm space group but already in a slightly different way. Let us call this stage an ‘intermediate step’. We have still the Pbnm symmetry but already have the split positions of the oxygen atoms as this is the case in the Cmcm space group. Positions of the oxygen atoms could be refined as split ones with the ratio 80:20. We can estimate that at some higher pressure values, this ratio will achieve 50:50. This disorder allows us to turn towards a new phase. A potential situation, where oxygen atom positions are split in a 50:50 ratio means complete extinction of previously weakened reflections (reflection conditions for Cmcm are fully met) and possibility of refinement in the Cmcm space group. As we see from Fig. 5d, where lines showing disappearing groups of reflections are extrapolated to the higher values of pressure, such a situation could probably occur somewhere within the pressure range 45 GPa to 50 GPa. However, it is just a prediction on the basis of very few experimental points. A movie presenting the transformation depicted in Fig. 6 is provided as a separate mp4 file in the Supplementary information.
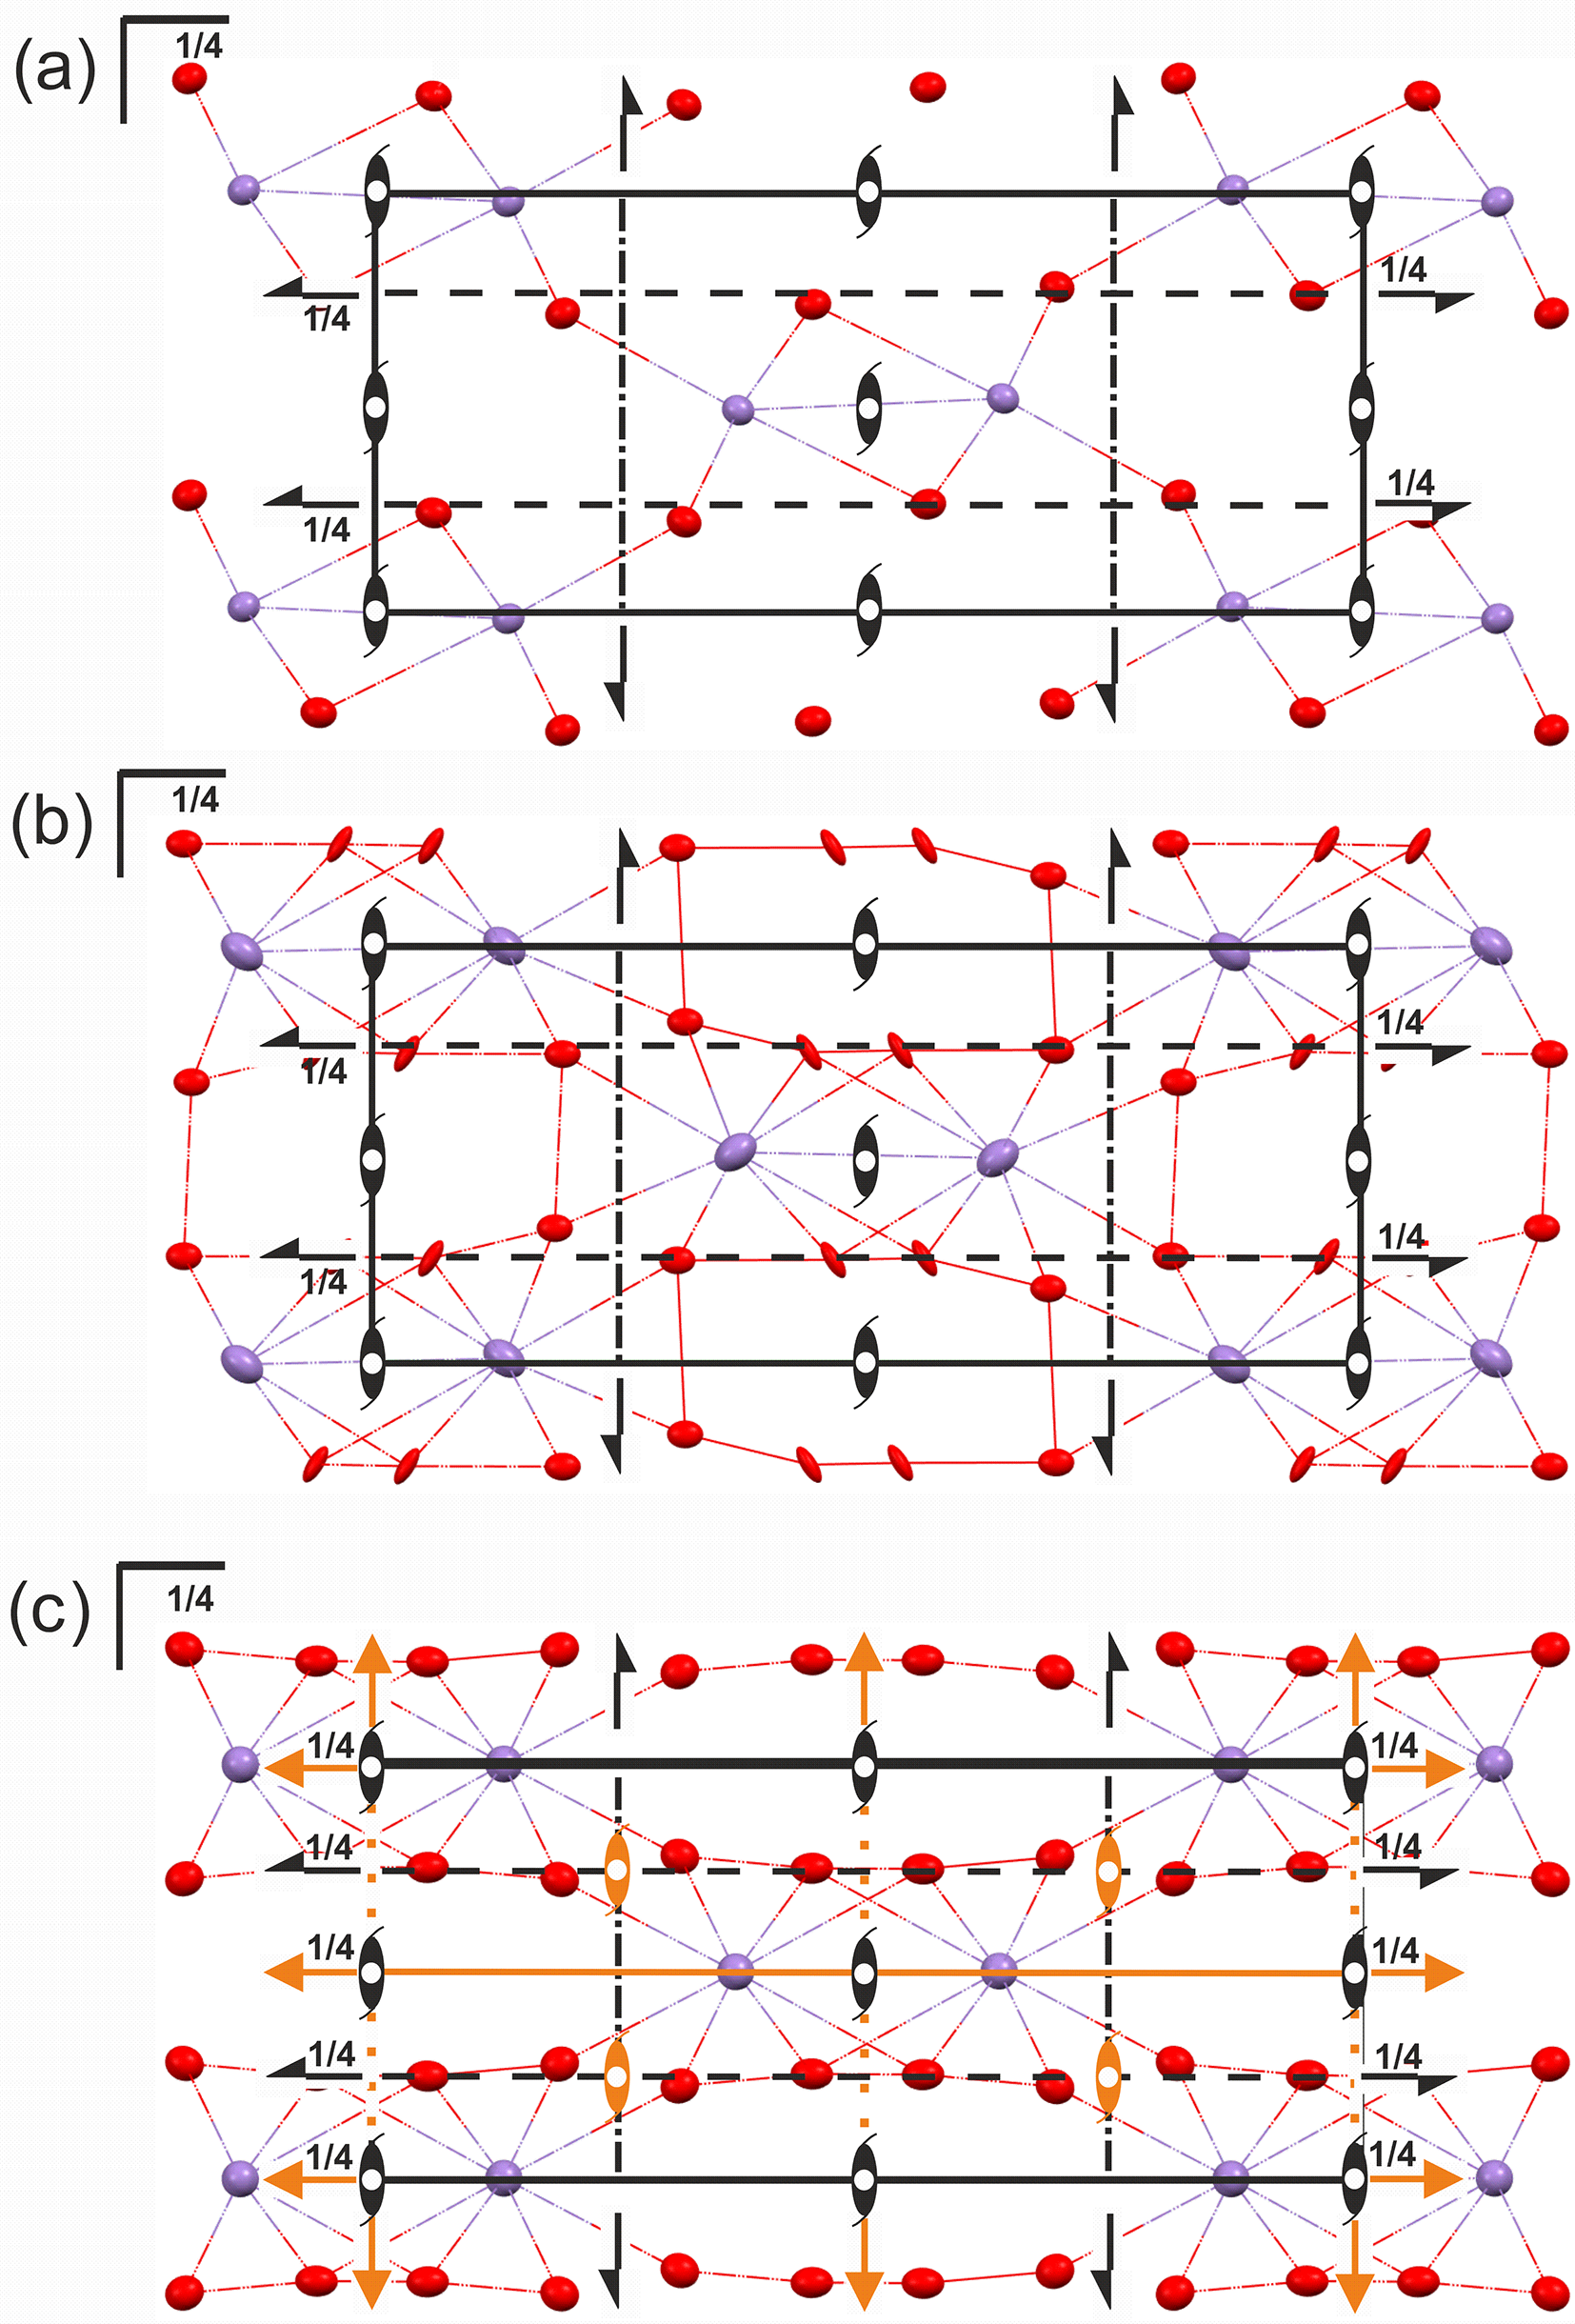
The high-pressure phase transition of the groutite structure from the Pbnm to the intermediate stage (Pbnm with split oxygen atoms) and then further to a potential Cmcm space group, as postulated by us, requires a more in-depth explanation. First of all, this appears to be more of a continuous process than a sharp event. Initially, it is 80:20 at 39 GPa. However, to meet Cmcm requirements it should be finally a 50:50 ratio. In the initial Pbnm space group, each oxygen atom is characterized by the m site symmetry and a site occupancy factor (sof) of 1 (Wyckoff position 4c). In the expected final result of the transformation, the Cmcm space group, the sof changes to 0.5, and the Wyckoff position shifts to 8g. A slight shift of the manganese atom is also observed, with its site symmetry in Cmcm changing from m (in Pbnm) to m2m. As a result, additional symmetry elements are allowed to appear in the unit cell (see Fig. 7). Because the oxygen atom position is split, it seems that the atomic position of the hydrogen atom should split as well. However, on the basis of collected data, we were unable to determine and refine stable and reasonable split positions of a possibly disordered hydrogen atom in the intermediate stage (Pbnm with split oxygen atoms, p9).
The packing diagram of groutite: (a) at 30 GPa (Pbnm) with symmetry elements; (b) 39 GPa (Pbnm) with split positions of oxygen atoms; (c) potential equal ratio of the split oxygen positions at some point with higher pressure would allow refinement of the structure in Cmcm. View along the [001] direction. The symmetry elements which appear in Cmcm but are not observed in Pbnm are coloured orange. Hydrogen atoms are omitted for clarity. Ellipsoids of anisotropic displacement parameters at 75% level.

Figure 7 Long description
The image A shows a diagram of groutite packing at 30 GPa, featuring symmetry elements. The structure is composed of red and purple spheres connected by lines, with black arrows indicating symmetry directions. The label ′1 over 4′ appears at various points along the lines. The image B shows a similar diagram at 39 GPa, with additional red lines and more complex connections between the spheres. The split positions of oxygen atoms are indicated and the ′1 over 4′ labels are present. The image C shows a potential equal ratio of split oxygen positions at higher pressure, with orange elements indicating new symmetry features. The structure is more intricate, with additional orange lines and spheres, maintaining the ′1 over 4′ labels throughout the diagram.
Conclusions
A smooth, continuous shrinkage in the unit cell volume (∼19.5% from 0.65(6) GPa to 39.85(8) GPa) is a direct result of the pressure increase. This reduction in volume is accompanied by distortion of MnO6 octahedra. Up to ca 30 GPa we observe just the expected results of the rising pressure. However, above ca 30 GPa, certain Bragg reflections that are allowed in the Pbnm phase become progressively absent as pressure increases. It may suggest a forthcoming phase transition.
At 39 GPa, it is still possible to solve the structure in the Pbnm space group but already with split positions of the oxygen atoms. At this stage, the split ratio is still unequal (80:20). The simulations in Isodistort shows that when the split ratio achieves 50:50, the lattice will be fully corresponding to the base-centred unit cell. At this pressure point, the phase transition from Pbnm to Cmcm should be completed with all reflections corresponding to the Pbnm symmetry probably absent. The continuous nature of the transition suggests that groutite’s crystal structure evolves gradually under pressure, with the transformation from an ordered to a disordered structure.
This study underscores the importance of monitoring reflection intensities and symmetry changes as a function of pressure when studying high-pressure phase transitions. The findings could have broader implications for understanding the behaviour of manganese oxide minerals under extreme conditions, which could inform both mineralogical and industrial applications, such as in the development of new materials under high-pressure environments.
Supplementary material
The supplementary material for this article can be found at https://doi.org/10.1180/mgm.2025.10161.
Acknowledgements
Support for this work provided by the National Science Centre, Poland (OPUS grant No. UMO-2019/33/B/ST10/02671 awarded to KW) is gratefully acknowledged. This work was partly carried out at the Biological and Chemical Research Centre, University of Warsaw, established within a project co-financed by the European Union through the European Regional Development Fund under the Operational Program Innovative Economy, 2007–2013. The research was conducted at the TEAM TECH Core Facility for crystallographic and biophysical research, which supports the development of medicinal products, sponsored by the Foundation for Polish Science (FNP). We also acknowledge SOLEIL for providing synchrotron radiation facilities. The experiment was conducted at beamline CRISTAL, proposal number 20231567.
Competing interests
The authors declare none.


 Open access

