I. INTRODUCTION
Calcium phosphates form a vast family of biominerals, which are present in a large number of biological tissues.Reference Elliott1–Reference Wang and Nancollas5 Hydroxyapatite (HA) is the most studied calcium phosphate phase because it is the main mineral component of bone and teeth. Its composition differs from that of stoichiometric HA [Ca10(PO4)6(OH)2] due to the presence of several ionic substitutions in the HA lattice, such as CO32−, HPO42−, Na+, and Mg2+. Brushite (dicalcium phosphate dihydrate, CaHPO4.2H2O) and octacalciumphosphate [OCP, Ca8(HPO4)2(PO4)4.5H2O] phases have been observed in pathological calcifications like dental calculi and urinary stones.Reference Dorozhkin2 Substituted β-Ca3(PO4)2 (β-TCP) can also be present in some forms of dental calculi and salivary stones, while calcium pyrophosphate dihydrate (Ca2P2O7.2H2O) crystals can form in connective tissues and joints, leading to diseases like pseudo-gout (also referred to as Calcium Pyrophosphate Deposition Disease) and acute arthritis. In addition to these crystalline calcium phosphates, another important phase is amorphous calcium phosphate (ACP, CaxHy(PO4)z.nH2O). ACP is generally unstable in physiological conditions, where it tends to transform into crystalline HA. Although details of its structure have not yet been fully elucidated, experiments carried out in vitro suggest that there are several compositions for ACP, depending on the precipitation conditions, and notably on the pH and the supersaturation of the calcium and phosphate ions in solution.Reference Wang and Nancollas5
Because of the biological importance of calcium phosphates, many research teams have endeavored to understand their formation and stability under physiological conditions, one of the main objectives being to develop efficient calcium phosphate-based biomaterials or cements for bone tissue regeneration. In this context, a particular effort was made in trying to describe the structure of these biological phases and compare it with synthetic calcium phosphate analogues. Several analytical techniques have thus been used, such as x-ray diffraction (XRD),Reference Bazin, Chappard, Combes, Carpentier, Rouzière, André, Matzen, Allix, Thiaudière, Reguer, Jungers and Daudon6–Reference Rey, Combes, Drouet and Glimcher8 electron microscopy,Reference Rubin, Jasiuk, Taylor, Rubin, Ganey and Apkarian9, Reference Rubin and Jasiuk10 IR and Raman spectroscopies,Reference Bazin, Chappard, Combes, Carpentier, Rouzière, André, Matzen, Allix, Thiaudière, Reguer, Jungers and Daudon6, Reference Miller, Vairavamurthy, Chance, Mendelsohn, Paschalis, Betts and Boskey11–Reference Rey, Combes, Drouet, Sfihi and Barroug16 Ca K-edge x-ray absorption spectroscopy,Reference Laurencin, Wong, Chrzanowski, Knowles, Qiu, Pickup, Newport, Gan, Duer and Smith17–Reference Harries, Hukins and Hasnain19 and solid state Nuclear Magnetic Resonance (NMR).
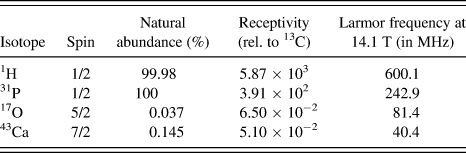
Solid state NMR is a technique which is well adapted to the study of the structure of biological and synthetic calcium phosphate minerals at the atomic level.Reference Laurencin, Wong, Chrzanowski, Knowles, Qiu, Pickup, Newport, Gan, Duer and Smith17, Reference Kolodziejski20–Reference Laurencin, Almora-Barrios, de Leeuw, Gervais, Bonhomme, Mauri, Chrzanowski, Knowles, Newport, Wong, Gan and Smith40 Indeed, the four main nuclei present in calcium phosphates are calcium, phosphorous, oxygen, and hydrogen, each of which has an isotope that can be studied by NMR (Table I). As detailed below, most of the solid state NMR investigations reported so far concern 1H and 31P, as these are two spin 1/2 isotopes of high natural abundance and receptivity. In contrast, 43Ca and 17O are quadrupolar nuclei (which means that they have a nuclear spin I > ½ and a quadrupole moment Q), and their natural abundance is low. It is only more recently that they have started to be used for the characterization of calcium phosphates or bone, notably because high-field magnets are needed to obtain high-resolution spectra.
Main NMR isotopes present in calcium phosphates.

Early 31P NMR studies of calcium phosphates and bone used mainly Magic Angle Spinning (MAS) single-pulse experiments and 1H→31P cross-polarization (CP) techniques. The comparison of single-pulse and 1H→31P CPMAS spectra can help distinguish different phosphate environments,Reference Kolodziejski20, Reference Rothwell, Waugh and Yesinowski33, Reference Kolmas, Ślósarczyk, Wojtowicz and Kolodziejski34 as only the phosphorous atoms close to protons appear in the latter spectra. Important structural information can be thus derived, and further insight into 1H-31P proximities can be obtained by recording a series of 1D CPMAS experiments,Reference Kaflak-Hachulska, Samoson and Kolodziejski23, Reference Wilson, Awonusi, Morris, Kohn, Tecklenburg and Beck25 and/or by recording two dimensional (2D) 1H-31P heteronuclear-correlation (HETCOR) spectra, which show which phosphates are close to which hydrogen atoms (OH, P-OH or H2O) in the material.Reference Kolodziejski20, Reference Maltsev, Duer, Murray and Jaeger22, Reference Cho, Wu and Ackerman35, Reference Jäger, Welzel, Meyer-Zaika and Epple38 For more complex species, experiments based on 31P-31P dipolar couplings and J-couplings (if P–O–P bonds are present) can be carried out,Reference Pourpoint, Gervais, Bonhomme-Coury, Azaïs, Coelho, Mauri, Alonso, Babonneau and Bonhomme21, Reference Pourpoint, Kolassiba, Gervais, Azaïs, Bonhomme-Coury, Bonhomme and Mauri36, Reference Tseng, Mou and Chan37 as recently illustrated in the case of OCP.Reference Tseng, Mou and Chan37
High-resolution 1H solid state NMR is generally more difficult to carry out than 31P NMR because of strong homonuclear 1H-1H dipolar couplings. Nevertheless, the signals from different hydrogen atoms (OH, P-OH, or H2O) present in synthetic calcium phosphate phases can be observed.Reference Kolodziejski20, Reference Pourpoint, Gervais, Bonhomme-Coury, Azaïs, Coelho, Mauri, Alonso, Babonneau and Bonhomme21 In the case of bone, more complex spectra are obtained because of the presence of additional 1H signals due to the organic collageneous matrix. In this case, the 1H peaks coming from the mineral phase of bone can be picked out by recording a 2D 1H-31P HETCOR spectrumReference Maltsev, Duer, Murray and Jaeger22, Reference Cho, Wu and Ackerman35 or a 1D 31P→1H CPMAS spectrum.Reference Kolmas and Kołodziejski29, Reference Isobe, Nakamura, Nemoto, Senna and Sfihi39
43Ca solid state NMR is intrinsically difficult: calcium-43 is a spin 7/2 nucleus with a low resonance frequency (it is referred to as a low-gamma nucleus) and a very low natural abundance (Table I). Nevertheless, we have recently shown that 43Ca NMR spectra of calcium phosphates and bone can be recorded at natural abundance,Reference Laurencin, Wong, Chrzanowski, Knowles, Qiu, Pickup, Newport, Gan, Duer and Smith17, Reference Laurencin, Wong, Dupree and Smith31, Reference Gervais, Laurencin, Wong, Pourpoint, Labram, Woodward, Howes, Pike, Dupree, Mauri, Bonhomme and Smith32, Reference Laurencin, Almora-Barrios, de Leeuw, Gervais, Bonhomme, Mauri, Chrzanowski, Knowles, Newport, Wong, Gan and Smith40 using large volume rotors and signal-enhancement schemes specific to quadrupolar nuclei, most helpfully in combination with high magnetic fields. Calcium-43 being a quadrupolar nucleus, the position and lineshape of a 43Ca NMR signal will vary with the magnetic field used for the measurement due to variations of the second order quadrupolar shift and broadening (the latter being inversely proportional to the magnetic field). In MAS, the lineshape mainly depends on three parameters, the isotropic chemical shift δ iso and the quadrupolar parameters η Q and CQ. By recording the 43Ca NMR spectra of a calcium phosphate sample at different magnetic fields, it is possible to extract these NMR parameters, and notably an isotropic chemical shift δiso,Reference Laurencin, Wong, Chrzanowski, Knowles, Qiu, Pickup, Newport, Gan, Duer and Smith17, Reference Laurencin, Wong, Dupree and Smith31, Reference Gervais, Laurencin, Wong, Pourpoint, Labram, Woodward, Howes, Pike, Dupree, Mauri, Bonhomme and Smith32 which can provide information on the average Ca…O bond distance.Reference Gervais, Laurencin, Wong, Pourpoint, Labram, Woodward, Howes, Pike, Dupree, Mauri, Bonhomme and Smith32
Oxygen-17 is another difficult quadrupolar nucleus, with a very low sensitivity. However, it is a key nucleus for the characterization of materials, as oxygen-17 NMR parameters can provide very valuable structural information.Reference Pourpoint, Gervais, Bonhomme-Coury, Azaïs, Coelho, Mauri, Alonso, Babonneau and Bonhomme21, Reference Ashbrook and Smith41, Reference MacKenzie and Smith42 Because of the very low sensitivity of oxygen-17 NMR, very few 17O NMR spectra of calcium phosphates have been reported so far, and concerning the HA phase, only the spectrum of a HA sample 17O-enriched in only the phosphate position has been reported.Reference Wu, Rovnyank, Sun and Griffin43
Due to the complexity of materials like calcium phosphates, solid state NMR spectra can also be particularly complex, especially in biological materials like bone, where distributions in local environments can lead to broader NMR signals. Two key points are thus essential to interpret the spectra: (i) obtaining high-resolution solid state NMR spectra of these materials, (ii) developing means to help assign the signals observed and explain the nature of the chemical environment of the nuclei. In the latter case, it has been demonstrated over the past few years that the combination of computational modeling and density-functional theory (DFT) calculations of NMR parameters [using the Gauge-Including Projector Augmented Wave method (GIPAW)]Reference Pickard and Mauri44 can be used to help interpret solid state NMR spectra, including for calcium phosphate phases.Reference Pourpoint, Gervais, Bonhomme-Coury, Azaïs, Coelho, Mauri, Alonso, Babonneau and Bonhomme21, Reference Gervais, Laurencin, Wong, Pourpoint, Labram, Woodward, Howes, Pike, Dupree, Mauri, Bonhomme and Smith32, Reference Pourpoint, Kolassiba, Gervais, Azaïs, Bonhomme-Coury, Bonhomme and Mauri36, Reference Laurencin, Almora-Barrios, de Leeuw, Gervais, Bonhomme, Mauri, Chrzanowski, Knowles, Newport, Wong, Gan and Smith40, Reference Chappell, Duer, Groom, Pickard and Bristowe45 In particular, the experimental 31P, 1H, and 43Ca NMR spectra of crystalline calcium phosphates of known structure have been shown to be in very good agreement with the calculated NMR data.
The purpose of this article is to show two examples of recent progress made in the field of solid state NMR, which can help in the interpretation of the structure of complex calcium–phosphate biomaterials, whether they are synthetic (as is the case for calcium–phosphate phases used for tissue engineering) or natural. The first concerns a high-resolution 17O, 31P, and 1H NMR study of a synthetic mixture of monocalcium phosphate monohydrate [MCPM, Ca(H2PO4)2.H2O] and monetite (CaHPO4), and emphasizes the importance of using a combined experimental/computational approach, notably for nuclei like oxygen-17. The second concerns high-field fast MAS 1H and 31P NMR experiments on biological specimens (mice teeth) to demonstrate how high-resolution spectra can now be obtained in a reasonable time on very small volumes of sample.
II. EXPERIMENTAL DETAILS
A. Sample preparation and origin
1. Preparation of 17O-labeled samples
17O-labeled MCPM, Ca(H2PO4)2.H2O was synthesized by reacting 0.474 g (2 eq) of phosphoric acid (H3PO4, 85%) with 0.206 g of CaCO3 (1 eq) at room temperature and under stirring, until precipitation of the powder was observed. 1.147 g of 40% labeled water, H217O, was used as the solvent. The precipitate corresponds to pure MCPM as shown by powder XRD and is referred to as MCPM hereafter. This protocol led to the 17O labeling of the water molecule only (see later), the sample prepared being Ca(H2PO4)2.H217O.
In a second synthetic approach, labeled phosphoric acid (H3P17O4) was first obtained by reacting 1.064 g of PCl5 (98% purity) with 0.512 g of 40%-labeled H217O to form H3P17O4. The reaction medium was stirred under argon in ice for 30 min and then heated at 90 °C for 2 h. 0.299 g of CaCO3 were then added, together with 0.5 g of 20%-labeled H217O and 0.5 g of 40%-labeled H217O, and the reaction medium was stirred at room temperature. This protocol led to a mixture of 17O-labeled phases, MCPM [Ca(H2P17O4)2.H217O] and monetite (CaHP17O4). Powder XRD shows that the material is mainly composed of ∼60% MCPM and ∼40% monetite (see Figure S1, in supplementary materials). This sample thus is referred to as MCPM–monetite in the rest of this article. It should be noted that considering the synthetic procedure used (i.e., hydrolysis of a chlorinated precursor by 17O-enriched water), the level of labeling of each phosphate oxygen atom in the MCPM and monetite components of the mixture is expected to be the same.
2. Biological specimens
Four-week-old mice (breed C57BL/6) were anaesthetized then decapitated after cervical dislocation. First lower molars were extracted under a dissecting microscope and frozen at −20 °C before NMR examination. All experiments were performed in accordance with the principles and guidelines established by the Institut National de la Santé et de la Recherche Medical (INSERM) employing the principles and procedures dictated by the highest standards of humane animal care.
B. Solid state NMR experiments
1. 17O, 1H, and 31P solid state NMR experiments on MCPM and MCPM–monetite
a. 17O solid state NMR
17O MAS NMR experiments on MCPM–monetite were performed on Avance II+ and Avance III Bruker NMR spectrometers (Bruker, Karlsruhe, Germany) operating at 14.1 and 17.6 T, respectively. MAS Bruker probes of 3.2 and 4 mm were used with sample spinning frequencies of 24 and 14 kHz, respectively. Central transition (CT) MAS spectra were recorded using single-pulse and rotor-synchronized Hahn echo sequences (90°–τ–180°), with CT selective 90° (6.2 μs) and 180° (12.4 μs) pulses (nutation frequency of 13 kHz). 17O 3Q-MAS experiments were performed at 17.6 T using the z-filter three pulse sequence.Reference Amoureux, Fernandez and Steuernagel46 A Bruker 3.2-mm MAS probe was used with a spinning frequency of 24 kHz. Spinal 64 1H decouplingReference Fung, Khitrin and Ermolaev47 was applied during the acquisition of the 17O NMR signals. 90 t 1 increments of 41.67 μs (i.e., one rotor period) with 360 transients each were recorded. Quadrature detection in the indirect dimension was achieved using the States method.
17O double rotation (DOR) experiments on MCPM–monetite were performed on an Avance II+ Bruker NMR spectrometer operating at 14.1 T with a DOR probe designed by A. Samoson.Reference MacKenzie and Smith42 In this case, no 1H decoupling was applied during the acquisition of the 17O signals. Before the experiments, the samples were diluted in unlabeled MgO to facilitate the combined rotation of the DOR rotors.
The 17O solid state NMR spectrum of MCPM was recorded on a Bruker Avance II+ 600 spectrometer operating at 14.1 T, using a Varian 3.2 mm MAS T3 probe and a spinning frequency of 20 kHz. The CT MAS spectrum was acquired with a rotor-synchronized Hahn echo experiment, with solid 90° and 180° pulse lengths of 1.0 and 2.0 μs, respectively (nutation frequency of 83 kHz). A total of 17,200 transients were averaged using a recycle delay of 5.0 s.
All 17O NMR spectra were externally referenced to H2O (tap water) at 0 ppm. For further details on individual experiments, please see the relevant figure captions.
b. 1H and 31P solid state NMR
31P MAS experiments were performed at 7.0 T and 17.6 T on Avance III Bruker NMR spectrometers using 4 mm MAS Bruker probes. {31P-17O} J-MAS-HMQC (Heteronuclear Multiple Quantum Coherence) experiments were performed at 17.6 T using a 3.2 mm MAS Bruker probe. 31P chemical shifts were referenced to H3PO4, 85% at 0 ppm.
1H experiments were performed at 300, 400, 700, and 750 MHz using 4, 2.5, and 1.3 mm Bruker MAS probes. The 1H-1H 2D Frequency Switched Lee Goldburg (FSLG) experimentsReference Coelho, Rocha, Madhu and Mafra48, Reference Van Rossum, Förster and de Groot49 were performed at 17.6 T (4 mm probe). 1H chemical shifts were referenced to tetramethylsilane (1H) at 0 ppm.
For further details on individual experiments, please see the relevant figure captions.
2. 1H and 31P solid state NMR experiments on a mouse tooth
The 1H and 31P solid state NMR experiments on the ground mouse tooth were recorded on a Bruker Avance III 750 (17.6 T) spectrometer using a Bruker 1.3 mm MAS HX probe spinning at 50 kHz. The temperature was regulated to 273 K to avoid any overheating of the sample during the experiments. 1H single-pulse and rotor-synchronized Hahn echo NMR experiments were recorded using a 1.3 μs 90° pulse (and 2.6 μs 180° pulse) and a recycle delay of 5 s; 32 transients were acquired for each spectrum. For the 1H Hahn echo experiment, an interpulse delay τ = 0.1 ms was used (corresponding to 50 rotor periods). The 31P single-pulse NMR experiment was performed using a 0.7-μs pulse (30° flip angle) with a recycle delay of 30 s. A total of 212 transients were acquired and spinal-64 1H decoupling was applied during the acquisition. 1H → 31P 1D CPMAS experiments were carried out using square-shaped contact pulses, for contact times of 0.3, 1, and 6 ms. A total of 640 transients were acquired for each spectrum, and spinal-64 1H decoupling was applied during the acquisition. 1H → 31P 2D HETCOR CPMAS spectra were recorded with contact times of 1, 6 (with 264 transients for each t1 increment), and 0.3 ms (with 512 transients for each t1 increment). The recycle delay was set to 1 s. Quadrature detection in the indirect dimension was achieved using the States method. 1H and 31P NMR spectra were referenced to tetramethylsilane (at 0 ppm) and NH4H2PO4 (at 0.9 ppm), respectively.
C. GIPAW calculations
The calculations were performed within Kohn–Sham DFT using the PARAllel Total Energy Code code.Reference Pfrommer, Raczkowski, Canning and Louie50 The PBE-generalized gradient approximationReference Perdew, Burke and Ernzerhof51 was used and the valence electrons were described by norm conserving pseudopotentialsReference Troulier and Martins52 in the Kleinman–Bylander form.Reference Kleinman and Bylander53 The core definition for O is 1s2 and 1s22s22p6 for P and Ca. The core radii are 1.2 a.u. for H, 1.5 a.u. for O, and 2.0 a.u. for P and Ca. The wave functions are expanded on a plane wave basis set with a kinetic energy cutoff of 80 Ry (it was verified that with this cutoff the calculations have properly converged). The crystalline structure is described as an infinite periodic system using periodic boundary conditions. The NMR calculations were performed for the experimental geometries determined by neutron diffraction for MCPMReference Schroeder, Prince and Dickens54 and monetite (as calculations carried out on relaxed structures did not appear to lead to better results); the atomic forces in these structures were found to be <0.15 eV/Å.Reference Catti, Ferraris and Filhol55 In the calculations, absolute shielding tensors are obtained. To fix the 17O NMR scales, σ ref was chosen in such a way that the sum of all calculated σ iso for a series of SiO2 polymorphs coincides with the corresponding sum of experimental values.Reference Profeta, Mauri and Pickard56
III. RESULTS AND DISCUSSION
A. High-resolution solid state NMR studies of MCPM and MCPM–monetite
1. Synthetic approaches for 17O-labeled calcium phosphates
In the framework of inorganic and hybrid calcium phosphate materials, several 17O labeling schemes have been proposed in the literature. Cherry et al. performed the reaction of red phosphorus at 300 °C under reduced pressure with 17O2 gas, ending with P217O5 vapor. After condensation, P417O10 was finally obtained.Reference Cherry, Alam, Click, Brow and Gan57 Using this synthetic process, labeling is optimal but strictly anhydrous experimental conditions are required. Flambard et al. used the reactivity of powdered solids with H217O vapor by designing a purpose-built furnace.Reference Flambard, Montagne and Delevoye58 In this case, the key parameters are the temperature of the furnace (related to the reactivity of the enriched water vapor with the solid sample) and the experimental time monitoring the final labeling percentage. 17O-labeled water has also been used as a reactant in sol–gel chemistry reactions at room temperature to prepare 17O-labeled oxides.Reference Gervais, Babonneau and Smith59 However, in the case of phosphates or phosphonates, the phosphoric or phosphonic acid precursors do not react with water under mild conditions (which shows that there is no nucleophilic attack of water at the phosphorus atom). It is thus necessary to first prepare in a separate step 17O-labeled phosphoric or phosphonic acid precursors, by reaction of chlorinated phosphorus compounds with enriched water.Reference Gervais, Profeta, Lafond, Bonhomme, Azaïs, Mutin, Pickard, Mauri and Babonneau60 This approach is robust and is characterized by minimal losses in 17O. In particular, the reaction of PCl5 with H217O, leads to labeled phosphoric acid, H3P17O4, which can then be used as a precursor for standard sol–gel chemistry. In this work, pure MCPM, Ca(H2PO4)2.H217O, and a mixture of MCPM–monetite, Ca(H2P17O4)2.H217O-CaHP17O4, were prepared by sol–gel reactions starting with H217O and H3P17O4/H217O, respectively (see the Experimental section for details).
2. 17O NMR spectroscopy and GIPAW calculations
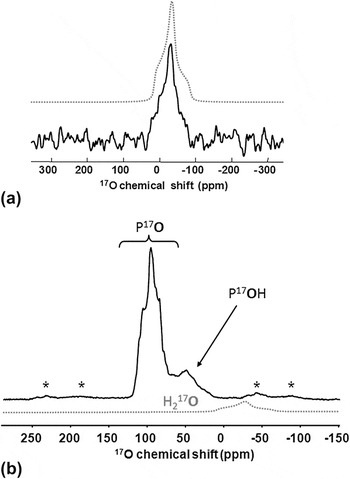
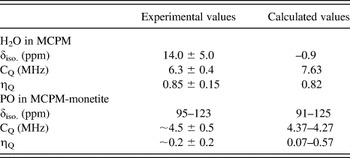
The 17O MAS spectrum of MCPM recorded on a 600-MHz NMR spectrometer is presented in Fig. 1(a). A single resonance characterized by a second-order broadened quadrupolar lineshape is observed (δ iso = 14.0 ± 5.0 ppm, CQ = 6.3 ± 0.4 MHz, η Q = 0.85 ± 0.15, see Table II). The large CQ value is characteristic of the structural water molecules of MCPM, excluding therefore the contribution of mobile water molecules adsorbed onto the MCPM crystals. Comparing the 17O quadrupolar parameters calculated by GIPAWReference Pourpoint, Gervais, Bonhomme-Coury, Azaïs, Coelho, Mauri, Alonso, Babonneau and Bonhomme21 with the experimental data, the resonances related to P17O and P17OH groups are obviously not observed (as confirmed below by the analysis of the MCPM–monetite sample). This is not surprising given that this synthetic approach of MCPM involves nonlabeled H3PO4, and no P-OH/H2O exchange is expected under the conditions used here. Only the selective enrichment of the H2O molecules thus occurs. The 17O GIPAW parameters for these structural water molecules areReference Pourpoint, Gervais, Bonhomme-Coury, Azaïs, Coelho, Mauri, Alonso, Babonneau and Bonhomme21: δ iso = −0.9 ppm, CQ = 7.63 MHz, η Q = 0.82. One notices a moderate overestimation of the quadrupolar constant CQ, as already stressed in several articles.Reference Gervais, Dupree, Pike, Bonhomme, Profetta, Pickard and Mauri62, Reference Gervais, Profeta, Babonneau, Pickard and Mauri63 The largest discrepancy between calculated and experimental values is for δ iso, as the difference observed (∼15 ppm; see Table II) is larger than the estimated accuracy of 17O isotropic chemical shifts calculated by GIPAW (± 3 ppm).Reference Gervais, Profeta, Lafond, Bonhomme, Azaïs, Mutin, Pickard, Mauri and Babonneau60, Reference Gervais, Coelho, Azaïs, Maquet, Laurent, Pourpoint, Bonhomme, Florian, Alonso, Guerrero, Mutin and Mauri64 Nevertheless, it would be worth seeing whether it is possible to reduce such a discrepancy (i) by obtaining more accurate experimental NMR data, for instance by recording an additional experimental spectrum of MCPM at a higher magnetic field (as attempts to record the spectrum on a lower field magnet led to a very noisy/unexploitable spectrum, even after 48 h of acquisition), and simulating the spectra recorded at both magnetic fields, and (ii) by evaluating more precisely the accuracy of GIPAW calculations, when it comes to calculating the 17O NMR parameters for water molecules. Indeed, to the best of our knowledge, these data correspond to the first ones ever reported for water molecules in calcium phosphates.
(a) 17O MAS NMR spectrum of MCPM at 14.1 T (3.2 mm rotor, recycle delay: 5 s, number of scans: 17196, ν rot: 20 kHz, 1H decoupling). The dotted spectrum corresponds to a simulationReference Massiot, Fayon, Capron, King, Le Calvé, Alonso, Durand, Bujoli, Gan and Hoatson61 with a second-order quadrupolar interaction. (b) 17O Hahn echo MAS NMR spectrum of MCPM-monetite at 17.6 T (4 mm, recycle delay: 15 s, number of scans: 64, ν rot: 14 kHz, 1H decoupling). The dotted spectrum corresponds to the expected H217O signal of MCPM with the quadrupolar parameters given in the text (and the intensity expected with respect to the composition of the sample). ‘*’ spinning side bands; MAS, Magic Angle Spinning; NMR, Nuclear Magnetic Resonance; MCPM, monocalcium phosphate monohydrate.

Comparison of calculated and experimental 17O NMR parameters.

MCPM, monocalcium phosphate monohydrate.
The 17O echo MAS spectrum of MCPM–monetite is presented in Fig. 1(b). Two main contributions centered at δ ∼100 and ∼50 ppm are observed. They can be assigned safely to P17O and P17OH resonances, respectively.Reference Pourpoint, Gervais, Bonhomme-Coury, Azaïs, Coelho, Mauri, Alonso, Babonneau and Bonhomme21 The quadrupolar constants for P17O are smaller than for P17OH (see Table II).Reference Pourpoint, Gervais, Bonhomme-Coury, Azaïs, Coelho, Mauri, Alonso, Babonneau and Bonhomme21, Reference Gervais, Coelho, Azaïs, Maquet, Laurent, Pourpoint, Bonhomme, Florian, Alonso, Guerrero, Mutin and Mauri64 This is in agreement with GIPAW calculations: for example, in the case of MCPM, the averaged GIPAW calculated CQ for P17O and P17OH are 4.63 and 7.20 MHz, respectively, leading to a much stronger quadrupolar broadening for P17OH groups, and a dramatic loss in signal-to-noise ratio. At this stage, it has to be emphasized that the complexity of the 17O spectrum presented in Fig. 1(b) is due to a large number of independent crystallographic oxygen sites: 9 for MCPM, including one unique water 17O site (see JCPDS number 700090), and 16 for monetite.Reference Catti, Ferraris and Filhol55 Assuming a ∼60/40 mixture of MCPM and monetite (see the Experimental section), the percentage of P17O, P17OH, and H217O groups can be estimated to ∼56, 37, and 7%, respectively. It follows that the H217O resonance is not detected in Fig. 1(b), mainly because of its low content in this mixture.
3. High-resolution 17O and 31P NMR experiments
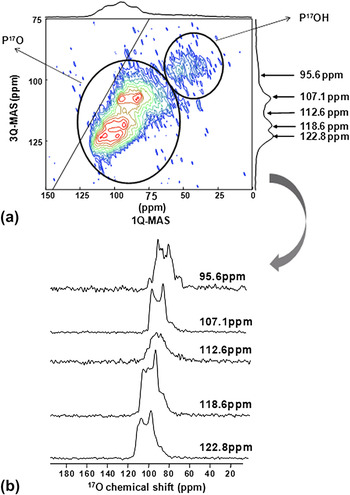
To increase the resolution of the 17O NMR spectrum of MCPM–monetite, MQ-MASReference Amoureux, Fernandez and Steuernagel46, Reference Frydman and Harwood65 and DORReference MacKenzie and Smith42, Reference Samoson, Lippmaa and Pines66, Reference Hung, Howes, Parkinson, Anupold, Samoson, Brown, Harrison, Holland and Dupree67 experiments were performed at very high magnetic field. Both aim at obtaining high-resolution spectra of quadrupolar nuclei by removing the second-order quadrupolar interaction.Reference MacKenzie and Smith42 In brief, the former experiment consists on recording a 2D spectrum under MAS in which highly resolved isotropic peaks are obtained in the indirect dimension, whereas the latter consists on spinning the sample at two different angles simultaneously to average out the quadrupolar interaction, and a well resolved 1D spectrum with isotropic lines can thus be obtained.Reference MacKenzie and Smith42 The 17O 3Q-MAS spectrum of MCPM–monetite is presented in Fig. 2. Two regions are clearly distinguished. The P17OH region is characterized by a low signal/noise ratio, as it corresponds to the strongest CQ constants; this part of the spectrum will not be commented further. The P17O region exhibits several 17O isotropic contributions in the 3Q-MAS dimension (some of the corresponding lineshapes in the 95.6 to 122.8 ppm range are presented). At this stage, it is not possible to extract the individual NMR parameters for all 17O sites involved in the MCPM–monetite mixture (due to the significant spectral overlap). Nevertheless, estimations of δ iso, CQ, and η Q can be given, as shown in Table II. Such estimates are in general in good agreement with the corresponding isotropic shift ranges obtained by GIPAW (all the GIPAW calculated values for MCPM–monetite are given in Table S1 in supplementary information).
(a) 17O 3Q-MAS NMR spectrum of MCPM–monetite at 17.6 T (3.2 mm, recycle delay: 2 s, ν rot: 24 kHz, 1H decoupling). The P17O and P17OH regions are indicated. (b) Isotropic contributions to the highly resolved dimension and the corresponding MAS lineshapes. (color online)

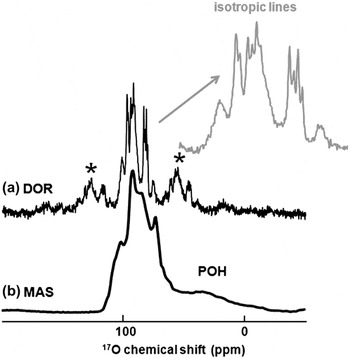
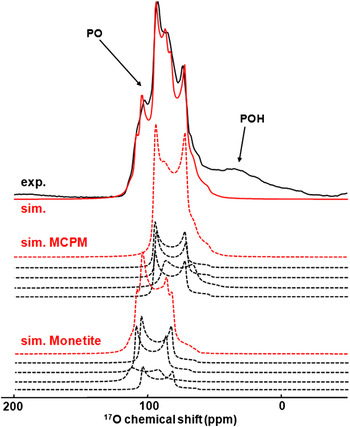
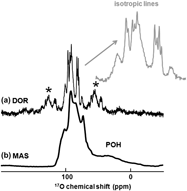
The 1D 17O DOR NMR experiment leads also to the complete averaging of the second-order quadrupolar effects. Recently, DOR has been implemented to study organic and inorganic phases in combination with more involved pulse sequences, such as spin diffusion and MQ-DOR.Reference Hung, Howes, Parkinson, Anupold, Samoson, Brown, Harrison, Holland and Dupree67 The DOR spectrum of MCPM–monetite at 14.1 T, together with the corresponding MAS spectrum, are presented in Figs. 3(a) and 3(b), respectively. A spectacular increase in resolution is observed. The chemical shift range of the peaks shows that they correspond to P17O resonances. The P17OH resonances are not detected, because no 1H decoupling scheme was applied during the acquisition of the 17O signals. Most of the P17O resonances obtained are sharp (∼60 Hz) and correspond obviously to doublets. Two isotropic components at ∼75 and ∼100 ppm are nevertheless broader, without any evidence of J splitting; motional averaging and/or particular relaxation effects could explain this observation. The doublets observed for the sharp signals are expected from isotropic 1JO–P coupling constants, as I = ½ and 100% natural abundance for 31P (see Table I). The average value of |1JO-P| coupling constants is estimated as ∼160 Hz. Such values are comparable to those obtained for other compounds containing P–O bonds.Reference Roiland68–Reference Hung, Wong, Howes, Anupõld, Past, Samoson, Mo, Wu, Smith, Brown and Dupree70 They will be compared to GIPAW calculations in the near future, following similar approaches as those previously published in the literature.Reference Bonhomme, Gervais, Coelho, Pourpoint, Azaïs, Bonhomme-Coury, Babonneau, Jacob, Ferrari, Canet, Yates, Pickard, Joyce and Mauri71 It has to be noticed that the 17O DOR experiments led easily to the observation of the J-multiplet patterns, whereas such data would have been very hard to obtain by standard 17O MQ-MAS experiments. By measuring the center of gravity of all doublets and by taking into account the DOR isotropic shift expression,Reference MacKenzie and Smith42 it is possible to recalculate the true 17O isotropic chemical shifts of the various lines, using the averaged values CQ ∼4.6 MHz and η Q ∼0, based on GIPAW results. The experimental centers of gravity correspond to two groups of four lines centered at δ iso = 95.2, 101.1, 102.1 (× 2) ppm and 111.8, 112.7, 116.6, 121.6 ppm. Taking into account Table S1, it is reasonable to assign the four more shielded resonances to MCPM. As a consequence, the four remaining lines are assigned to monetite. Strictly speaking, 12 isotropic lines ranging from 106.67 to 125.04 ppm would have been expected for monetite given the number of crystallographically inequivalent P–O sites, but such an ultimate resolution is not obtained even by DOR at 14.1 T. Nevertheless, from these values, it was then possible to simulate the corresponding MAS spectrum in the PO region at 14.1 T (Fig. 4). The agreement with the experimental MAS spectrum is obviously good, and the accuracy of the simulation is further demonstrated by comparing the experimental MAS spectrum recorded at a higher magnetic field (17.6 T, see Figure S2 in supplementary materials), with the one simulated using the same set of NMR parameters.
(a) 17O DOR NMR spectrum of MCPM-monetite at 14.1 T (recycle delay: 1 s, number of scans: 5000, inner ν rot: 6.50 kHz, outer ν rot: 1.44 kHz, no 1H decoupling). Only the P17O groups are detected. ‘*’ spinning side bands. In red: expansion of the DOR spectrum showing the J doublets (1JO–P couplings). The P17OH resonances are not detected (no 1H decoupling, see text). (b) The corresponding 17O echo MAS NMR spectrum at 14.1 T (4 mm, recycle delay: 20 s, number of scans: 3200, ν rot: 12.5 kHz, 1H decoupling). In this case the P17OH signals are observed. DOR, double rotation.

17O MAS NMR spectrum of MCPM–monetite at 14.1 T in black, top spectrum. The simulation in the PO region (in red, top) corresponds to the sum of the contributions of MCPM and monetite (the isotropic chemical shifts were extracted from the DOR data, the quadrupolar parameters were estimated from GIPAW calculations—see text for further details). (color online)

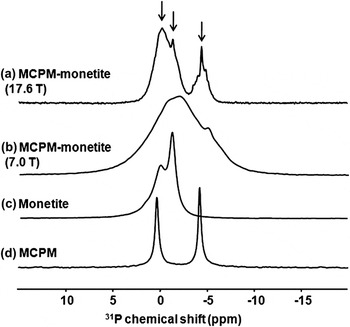
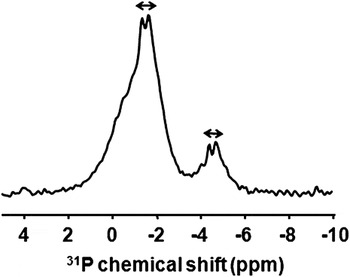
Because the most accurate description of chemical bonds in NMR is given by the indirect spin–spin J-coupling which occurs through interatomic bonds, it is worth trying to evidence and measure J-coupling values by NMR. It is usually accepted that the J-coupling interaction is much less intense than the Chemical Shift Anisotropy (CSA), dipolar and quadrupolar interactions,Reference MacKenzie and Smith42 making its measurement challenging. Therefore, very few J data for calcium phosphates have been published so far in the literature. It follows that JP–O coupling constants appear as a new NMR observable which should be sensitive to subtle variations in the P–O bonds. To measure 1JO–P coupling constants, an alternate approach to the DOR study presented above (which relies on being equipped of a DOR probe) consists on performing high-resolution 31P NMR spectroscopy experiments. The single-pulse 31P MAS spectra of 17O-labeled MCPM–monetite at various fields are presented in Figs. 5(a) and 5(b) (at 17.6 and 7.0 T, respectively). The spectrum obtained at 7.0 T is extremely broad and cannot be interpreted by a simple addition of the 31P spectra of pure nonlabeled monetite [Fig. 5(c)] and MCPM [Fig. 5(d)]. A dramatic increase in resolution is observed at higher field [17.6 T, Fig. 5(a)]. The gain in resolution is related to 31P-17O second-order heteronuclear dipolar coupling/quadrupolar effects,Reference Menger and Veeman72 which decreases at higher magnetic field. Rather sharp lines are observed at δ iso. = 1.4, 0.3, and −4.4 ppm. They are comparable to the resonances of pure monetite and MCPM and are therefore assigned to P16O4 groups. The asymmetric multiplet patterns observed around these main signals correspond to P16O317O, P16O217O2, P16O17O3, and P17O4 groups with an increasing number of 1JP–O couplings (it is noteworthy that the probability of having P17O4 groups is < 3%, and can thus be neglected). In the case of partly enriched 17O samples (<40%), the analysis of these multiplet patterns is not straightforward: assuming a unique 1JP–O constant, P16O317O, P16O217O2, and P16O17O3 groups should lead to 6, 11, and 16 lines shifted by second-order effects, respectively. Thus, it appears necessary to simplify the spectra. To suppress all components related to P16O4 groups, and to selectively observe only the central components of each J-multiplet (related to coupling with 17O nuclei in the 1/2 and -1/2 states), J-MAS-HMQC experiments can be implemented,Reference Massiot, Fayon, Alonso, Trebosc and Amoureux73, Reference Montouillout, Morais, Douy, Fayon and Massiot74 using purge pulses and selective excitation of the 17O CTs.Reference Martineau, Fayon, Legein, Buzare, Silly and Massiot75 The {31P-17O} J-MAS-HMQC spectrum of MCPM–monetite is presented in Fig. 6. Obviously, the sharp components [P16O4, see Fig. 5(a)] have been efficiently suppressed. Moreover, doublets are observed and a 1JP–O coupling constant ∼110 Hz can be estimated. This 1JP–O coupling constant is fairly consistent with the DOR results, but it is slightly smaller. The discrepancy may be related to the fact that the {31P-17O} J-MAS-HMQC experiment is slightly less accurate because the splitting observed is caused by all the different 17O atoms bound to the phosphorous. In contrast, in the DOR experiment, the splitting is a more accurate measurement of 1JP–O because each oxygen is connected to only one phosphorous.
31P MAS NMR spectra (a) 17O-labeled MCPM-monetite at 17.6 T (3.2 mm, recycle delay: 90 s, number of scans: 16, ν rot: 24 kHz, 1H decoupling). b) 17O-labeled MCPM-monetite at 7.0 T (4 mm, recycle delay: 30 s, number of scans: 16, ν rot: 14 kHz, 1H decoupling). (c) Unlabeled monetite at 7.0 T (4 mm, recycle delay: 30 s, number of scans: 16, νrot: 14 kHz, 1H decoupling). (d) Unlabeled MCPM at 7.0 T (4 mm, recycle delay: 30 s, number of scans: 4, ν rot: 14 kHz, 1H decoupling). Vertical arrows: P16O4 resonances.

{31P-17O} J-MAS-HMQC NMR spectrum of MCPM-monetite at 17.6 T (3.2 mm, recycle delay: 120 s, number of scans: 64, ν rot: 24 kHz, τ = 3.6 ms, 1H decoupling).

The range of high-resolution 17O and 31P NMR experiments presented above demonstrates that it is now possible to characterize in detail calcium phosphate phases. Good agreement between experimental and calculated 17O NMR data for these two phases can be obtained, confirming the accuracy of 17O NMR calculations. Determining 31P-17O J-couplings experimentally on calcium phosphates of known structure (like MCPM–monetite) is also particularly useful for helping in the development of DFT calculations of NMR parameters. Indeed, methods to calculate J-coupling values have been proposed, and it is crucial to validate the accuracy of the computational methods used by comparing experimental and calculated values.
4. High-resolution 1H NMR spectroscopy
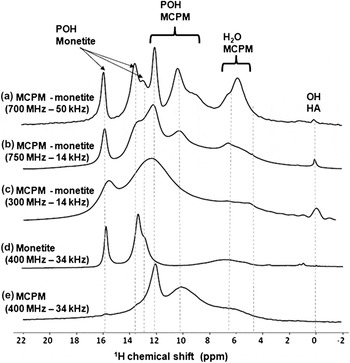
The aim of this part is to demonstrate methods which can be used to obtain 1H high-resolution NMR spectra. One possibility is to perform very fast MAS experiments (up to 67 kHz) at high magnetic field. The very fast MAS technique has led recently to spectacular results, especially for strongly coupled spins such as protons (the strong coupling corresponds here to the homonuclear dipolar interaction).Reference Lesage76 Spinning at very high spinning speeds requires using small (1.3 mm diameter or less) rotors, which means that the mass of samples in the rotor is very limited (∼5 mg or less). This raises the fundamental question of sensitivity of the NMR experiments. As shown in Fig. 7 for MCPM–monetite, the 1H sensitivity remains high even for small sample volumes. Furthermore, the comparison of spectra recorded spinning at 50 kHz on a 750 MHz spectrometer with those obtained at lower spinning speeds and/or lower magnetic fields clearly shows that the great advantage of increasing both the magnetic field B0 and the MAS frequency. At 750 MHz and ν rot = 50 kHz, the resolution is optimal, and the resonances of the different crystallographically inequivalent HPO42− and H2O species become evident, when comparing with the spectra of phase pure MCPM and monetite samples. The small peak which appears at ∼0 ppm probably corresponds to the OH resonance of a HA impurity in the sampleReference Kolodziejski20; the amount of this phase is very limited given that it is not detected by XRD.
1H NMR spectra of MCPM-monetite at various fields and the nonlabeled corresponding pure phases, and various spinning speeds ν rot [4 mm (14 kHz), 2.5 mm (34 kHz), 1.3 mm (50 kHz), recycle delay: from 5 to 60 s, number of scans: 8]. (d) The spectrum of monetite shows the presence of water signals at ∼4 to 7 ppm, suggesting that this phase was not well dried before the NMR measurement.

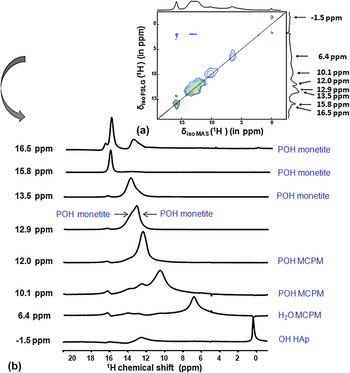
Alternatively, to obtain high-resolution 1H NMR data, 2D 1H-1H MAS experiments can be implemented at high field, in combination with homonuclear decoupling (here, FSLG).Reference Coelho, Rocha, Madhu and Mafra48, Reference Van Rossum, Förster and de Groot49, Reference Lesage76 In Fig. 8(a), the 2D FSLG spectrum (after rescaling the indirect FSLG dimension) of MCPM–monetite is shown. Several isotropic slices are presented as well [Fig. 8(b)]: showing that all P-OH and H2O resonances can be distinguished. It should be noted, however, that off-resonance effects lead to incorrect rescaling of the HA resonance in the indirect FSLG dimension.
(a) 1H-1H 2D Frequency Switched Lee Goldburg NMR spectrum of MCPM-monetite at 17.6 T (4 mm, recycle delay: 5 s, number of scans: 16, ν rot: 14 kHz). (b) The corresponding isotropic contributions. (color online)

All in all, these experiments demonstrate that by combining high magnetic fields, fast MAS, and specific NMR pulse sequences, it is now possible to obtain high-resolution 17O and 1H NMR spectra on complex mixtures of calcium phosphates (like the MCPM–monetite sample). The focus of the next section is to show how some of these techniques can be applied to the characterization of biological calcium phosphates.
B. 31P and 1H solid state NMR experiments of mice teeth
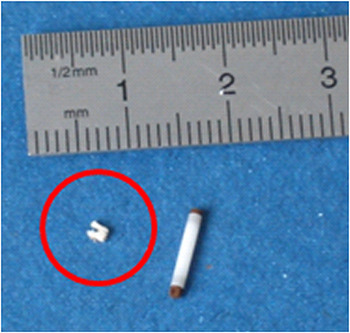
As shown in Fig. 9, the 1.3–mm-diameter rotors mentioned above are perfectly adapted to the study of very small biological samples like mice teeth. A mouse tooth was ground and inserted into a rotor for NMR analysis. The complete tooth was analyzed, which means that the spectra recorded are a reflection of all three components of teeth: dentin, cement, and enamel. Each of these constituents contains apatite.Reference Bowes and Murray77 The fraction of mineral phase is the most important for enamel (>96% weight), in contrast with cement and dentine, which contains a more significant fraction of organic phase and water.
Representation of mouth tooth (circled in red) and MAS rotor used. (color online)

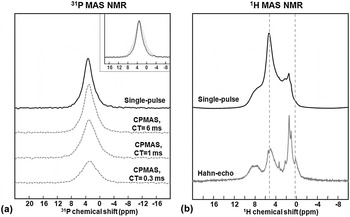
Figure 10 shows the 1D 1H and 31P NMR spectra recorded at high magnetic field (750 MHz spectrometer) and spinning at 50 kHz. The single-pulse 31P NMR spectrum presents a single peak at 3.2 ppm [Fig. 10(a)], which corresponds to the phosphate groups of the HA crystallites in teeth.Reference Reid, Duer, Murray and Wise27, Reference Huang, Tsai, Lee, Lin and Chan28 This peak is broader than generally observed for synthetic crystalline HA, in agreement with previous studies,Reference Kolodziejski20, Reference Maltsev, Duer, Murray and Jaeger22, Reference Kolmas, Ślósarczyk, Wojtowicz and Kolodziejski34 meaning that there are different phosphorus local environments in this biological sample. In particular, 1H→31P CPMAS spectra recorded using different contact times show that all phosphates do not have the same 1H environment because the breadth of the peak decreases as the contact time increases. On the basis of previous studies,Reference Maltsev, Duer, Murray and Jaeger22 such an observation could reflect that not only hydroxyl groups (OH−) are in close proximity with the phosphates in this sample but also H2O molecules or HPO42− anions.
(a) 31P single-pulse spectrum (in black, top) and 1H/31P CPMAS spectra (in grey, bottom), recorded with contact times of 0.3, 1.0, and 6.0 ms. The inset at the top right compares the line widths of the single-pulse spectrum with those of the CPMAS spectra recorded with contact times of 1 and 6 ms (the breadth of the phosphate peak varies as indicated in the text). (b) 1H NMR spectra recorded using the single-pulse sequence (in black, top) and the Hahn echo sequence (in grey, bottom). Details on all the acquisition parameters can be found in the experimental section of the manuscript.

The 1H single-pulse spectrum shows several unresolved signals [Fig. 10(b)], and is dominated by the signal centered at ∼5 ppm which corresponds mainly to water. The complexity of the 1H NMR spectra arises from the overlapping of contributions from the organic and mineral phases of teeth, and of water. Partial resolution of the peaks can be achieved using the spin-echo sequence, as the different signals have different transverse dephasing times T2. The relative intensity of the water peak dramatically decreases in the spin-echo spectrum, and the signal coming from the hydroxyl groups of the HA crystallites (∼0 ppm) appears more distinctly (see Fig. 10). The contribution of the organic component of teeth also becomes more visible.Reference Kolodziejski20, Reference Kaflak-Hachulska, Samoson and Kolodziejski23 In particular, a broad signal centered at ∼8 ppm is clearly observed, which is probably due to the NH groups of the peptide bonds in collagen.Reference Melacini, Feng and Goodman78
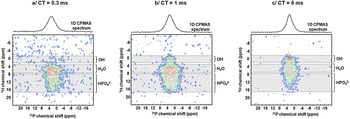
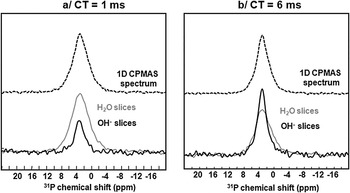
To gain more information about the distribution in phosphate environments in the mineral phase of the mouse tooth, 2D 1H-31P HETCORReference Kolodziejski20, Reference Jäger, Welzel, Meyer-Zaika and Epple38 spectra were recorded using contact times of 0.3, 1, and 6 ms (Fig. 11) to look at the relative proximities between protons and phosphorus atoms in the structures. The appearance of the 2D maps is different, which is not surprising given the differences already observed on the 1D 1H→31P CPMAS NMR spectra. For the longest contact time [CT = 6 ms; Fig. 11(c)], the most intense cross-peak correlates phosphates with the OH− signal of HA at ∼0 ppm. This cross-peak corresponds to a relatively narrow 31P NMR resonance [see Fig. 12(b)], meaning that these phosphates are in a well ordered and relatively crystalline HA environment. Another broader cross-peak correlates the phosphate signal with the H2O resonance centered at ∼5.5 ppm. The proximity between phosphate groups and water molecules is not surprising, given that (i) biological HA crystallites are nanocrystalline and have water molecules at their surface and (ii) structural water is also present as lattice defects within biological HA phases. This cross-peak corresponds to a much broader 31P NMR resonance, as illustrated in Fig. 12(b), confirming that these phosphates are in a more disordered environment. Finally, a broad phosphate signal also correlates with a weaker 1H intensity between ∼8 and 16 ppm, which, according to previous studies,Reference Kolodziejski20 can be assigned to HPO42− groups. As it appears on the 2D spectra shown in Figs. 11(a) and 11(b) and in the slices shown in Fig. 12(a), the contribution to the phosphate signal coming from H2O and HPO42− resonances is more significant when the contact time decreases, to the point that at the shortest contact time, the OH− resonance is not even observed on the 2D map [Fig. 11(a)]. This explains the changes in lineshape observed on the 1D 1H→31P CPMAS spectra, as the contributions from the less ordered environments increase as the contact times decrease. Studying in detail the CP build up curves for each of these sites may help estimate more accurately the relative proximity of OH and H2O components to the phosphate group.Reference Kaflak-Hachulska, Samoson and Kolodziejski23, Reference Wilson, Awonusi, Morris, Kohn, Tecklenburg and Beck25
2D 1H-31P HETCOR CPMAS NMR spectra recorded using contact times of a/0.3, b/1.0, and c/6.0 ms, respectively. HETCOR, heteronuclear-correlation. (color online)

Top spectra: 1D 1H→ 31P CPMAS spectra (recorded with contact times of 1.0 and 6.0 ms). Bottom spectra: 31P NMR cross sections of the 2D 1H-31P HETCOR spectra, corresponding to the OH− (in black) and H2O (in grey) signals.

All in all, the experiments carried out here only give a glimpse of the complexity of the structure of a 4-week-old mouse tooth and of the organization of its mineral phase at the atomic scale. Nevertheless, one of the key points to emphasize is that the overall experimental time necessary to carry out all the experiments presented here was only ∼14 h: the 1H-31P HETCOR spectra recorded with contact times of 1 and [Figs. 11(b) and 11(c)] 6 ms only required 3 h each. Thus, such experiments could be used on a wider range of samples in a time that makes the experiment manageable to help understand the evolution in the mineralization of mice teeth with age or to help determine the role of specific proteins or lipids in their mineralization. It is worth noting that other solid state NMR experiments should also be feasible on these mice teeth to help reach a better description of structure of the mineral phase (and notably the role of other substitutions present in the HA lattice like CO32− or Na+),Reference Laurencin, Wong, Chrzanowski, Knowles, Qiu, Pickup, Newport, Gan, Duer and Smith17 of the organic matrix, and of the interaction between the organic and mineral phases.Reference Reid, Jackson, Duer and Rodgers26, Reference Reid, Duer, Murray and Wise27 In particular, it is expected that better resolution of the 1H NMR spectra shown in Fig. 10 should be obtained using a 2D 1H-1H FSLG experiment like the one presented for MCPM–monetite. More generally, the methodology presented here may also be applied to other small fractions of biological samples like bone, teeth, or kidney stones, which is particularly important considering the intrinsic structural heterogeneity of these materials.
IV. CONCLUSION
In this article, high-resolution 1H, 31P, and 17O solid state NMR experiments have been carried out on synthetic and biological calcium phosphates. In all cases, the importance of performing experiments at high magnetic fields and under fast MAS spinning conditions was shown. Indeed, this allows a significant gain in resolution to be reached, which is particularly important when it comes to trying to understand the NMR spectra of complex materials like mice teeth.
To help in the interpretation of the “basic” single-pulse 1D NMR spectra, a range of more complex 1D and 2D NMR experiments have been presented. For nuclei like oxygen-17, both MQ-MAS sequences and DOR techniques can be particularly useful, the advantage of the latter technique being that 1JO–P couplings can actually be evidenced. Given that 1JO–P couplings had not been reported yet for calcium phosphates, a particular effort was made to try to measure these using also other sequences {31P-17O} MAS-HMQC. In the case of spin−½ nuclei like 1H and 31P, it was shown that 2D experiments like 1H-1H FSLG and 1H-31P HETCOR can be used. In the former case, different isotropic contributions can be extracted, whereas in the latter case information on the local environment of the phosphates can be obtained.
One of the most important points is that by using fast MAS rotors, it is now possible not only to obtain high-resolution NMR spectra but also to analyze very small volumes of sample, a fact which turns out to be particularly important when dealing with isotopically enriched (and thus expensive) synthetic materials, or with biological samples. Technological advances such as the development of fast MAS probes are thus of real benefit for the application of NMR to disciplines in which only very small volumes of sample are available. In this context, it is noteworthy that recently developed techniques like Magic Angle Coil Spinning,Reference Sakellariou, Le Goff and Jacquinot79, Reference Wong, Aguiar and Sakellariou80 might also become more common for the characterization of such materials, as even smaller volumes of sample are needed in this case.
ACKNOWLEDGMENTS
Financial support from the TGIR RMN THC FR3050 for conducting the research is gratefully acknowledged, as well as from CNRS (http://www.tgir-rmn.org/). The Royal Society is acknowledged for a Montpellier-Warwick partnership grant (JP090313), and Engineering and Physical Sciences Research Council (EPSRC) and the University of Warwick are thanked for partial funding of NMR work at Warwick. DL thanks the 7th European Community Framework Program, which supported this research by a Marie Curie European Reintegration Grant. Calculations were performed on the Institut du Developpement et des Ressources en Informatique Scientifique (IDRIS) supercomputer centre of the CNRS (Project 091461).