I. INTRODUCTION
During the last few years, many efforts have been dedicated to solidification of eutectic alloys, both theoretically and experimentally, due to their excellent properties and potential for industrial applications.Reference Murphy, Browne, Mirihanage and Mathiesen1,Reference Lu, Liu, Yang and Zhou2 As a classical eutectic alloy, Ni–Ni3B acts as a fundamental material for studying the solidified mechanism of eutectic transformation, so that it has received considerable research interest. Shapiro and FordReference Shapiro and Ford3 studied the orientation and interfacial relations for Ni–Ni3B eutectic in the near-equilibrium solidification of hypoeutectic and hypereutectic Ni–Ni3B alloys (B < 5 wt%); and they found that the eutectic phase does not grow directly from the primary α-Ni phase, but from the Ni3B phase. Ajao et al.Reference Ajao, Hamar-Thibault and Thibault-Desseaux4,Reference Ajao and Hamar-Thibault5 studied the effect of additions on solidification behaviors of several Ni–Ni3B alloys (0 < B < 5 wt%) by using the differential thermal analysis experiment. They found that Fe-doped Ni–Ni3B alloys exhibit small undercooling for nucleation of Ni3B, and moreover, for the alloys doped or undoped, a third recalescence peak (the first peak is for primary solidification, and the second one is for eutectic solidification) was observed under the equilibrium eutectic temperature (1366 K). Since the third recalescence is not consistent with the equilibrium phase diagram of Ni–Ni3B alloy, it is supposed to come from decomposition of the metastable phase Ni5B2 [or Ni3B(Ni), supersaturated with nickel atom]Reference Ajao, Hamar-Thibault and Thibault-Desseaux4,Reference Ajao and Hamar-Thibault5 ; meanwhile the metastable phase was according to the metastable phase diagram reported as Ni2B.Reference Ajao and Hamar-Thibault5 After that, by applying thermal analysis and x-ray diffraction analysis to rapidly quenched Ni81.3B19.7 alloy, Baricco et al.Reference Baricco, Ferrari and Battezzati6,Reference Battezzati, Antonione and Baricco7 found that the metastable phase for Ni–Ni3B alloys should be Ni23B6, with the melting point as about 1261 K. More recently, Kamaeva and Lad’yanovReference Kamaeva and Lad’yanov8 studied the rapid solidification of Ni–Ni3B alloys by spinning, where the metastable phase can be formed, provided the maximum rates of 104–103 K/s.
Although these authors have studied the solidification of Ni–Ni3B alloys by different ways, the undercooled solidification behavior and the phase selection mechanism of this alloy system are rarely reported, which act as the experimental basis for the theoretical study of multistep solidification of eutectic alloys.
Undercooled solidification is characterized by high growth rates of the solid, which are several orders of magnitude greater than those in conventional solidification. High undercooling is achieved by methods such as glass slag techniqueReference Zhang, Liu, Xu and Yang9,Reference Koseki10 and levitation melting,Reference Funke, Phanikumar, Galenko, Chernova, Reutzel, Kolbe and Herlach11 where the nucleation of the solid is difficult due to the absence of nucleation catalysts, so that the liquid can be undercooled to temperatures far below the equilibrium liquidus, and once solidification starts in this highly undercooled melt, the growth of the solid is almost instantaneous due to a strong thermodynamic driving force for crystallization.Reference Koseki10 In our previous study, we have revealed rapid solidification behavior of undercooled hypoeutectic Ni–Ni3B alloys (Ni–3.3 wt% B), where the competitive nucleation between Ni23B6 and Ni3B leads to a critical undercooling (ΔT* = 140 ± 10 K) for the metastable/stable eutectic formation has been shown.Reference Xu, Liu and Dang12,Reference Xu, Liu and Zhang13 Whereas, the experiments for undercooled solidification of hypereutectic Ni–Ni3B alloys are still not performed, and the phase selection mechanism for hypereutectic alloys are not clear yet. In this study, Ni–4.5 wt% B alloy will be chosen to reveal the undercooled solidification and the phase selection of the hypereutectic Ni–Ni3B alloy (eutectic composition is Ni–3.7 wt% B).
II. EXPERIMENTAL
The master alloy of Ni–4.5 wt% B was prepared from 99.98 wt% pure Ni and 99.7 wt% pure B in an arc melting furnace on a water-cooled copper crucible under Ar atmosphere. To investigate undercooled solidification, samples of about 4 g mass, together with some pieces of B2O3 glass, were placed in a quartz glass crucible, which was placed in the middle position of the high-frequency induction coil located in a vacuum chamber. After the vacuum chamber was evacuated to 1 × 10⁻⁶ mbar and backfilled with high purity Ar gas, the samples were repeatedly molten in that atmosphere and cooled until the desired undercoolings were available. Thermal history of every sample was monitored by a one-color pyrometer with a relative accuracy of 10 K and response time of 2 ms. For revealing what actually occurred during the rapid solidification, a high-speed video (HSV) instrumentation system with the high resolution of 1280 × 1024 pixels, OLYMPUS I-Speed 3 MONO (State Key Laboratory of Solidification Processing, Northwestern Polytechnic University, Xi'an, People's Republic of China), was used to observe the recalescence process for each transformation. For microstructure observation by optical and scanning electron microscopy (SEM), a solution consisting of 5 g FeCl3, 10 mL HCl, and 50 mL H2O was used to etch the as-solidified specimens. Selected sample sections were subjected to ion beam thinning and investigated by transmission electron microscopy (TEM) using Tecnai G2F30 microscope (FE-TEM; FEI Co., Hillsboro, OR) operating at 300 kV.
III. RESULTS AND DISCUSSIONS
A. Cooling curves and microstructures
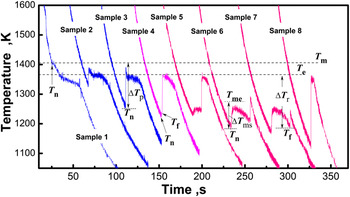
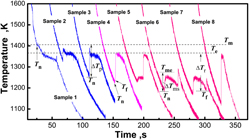
Using the melt-fluxing technique, two kinds of cooling curves were observed for undercooled solidification of Ni–4.5 wt% B alloy, where case I stands for the cooling curves of samples 1–3 (i.e., only one recalescence appears in the cooling curve) and case II stands for the cooling curves of samples 4–8 (i.e., two recalescences appear in the cooling curve).
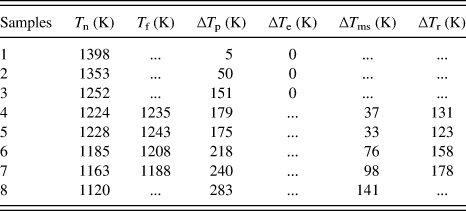
For case I, the undercooling for the primary solidification, ∆T p, equals to the difference between the melting point, T m (about 1403 K for Ni–4.5 wt% B) and the initial nucleation point, T n. The undercooling for the eutectic solidification is ∆T e ∼ 0 K, without the recalescence peak for the eutectic reaction appearing in the cooling curves (e.g., samples 1–3 of Fig. 1). For case II, the undercooling for the primary solidification can also be defined as ∆T p = T m − T n, but due to the occurrence of metastable eutectic transformation, the actual undercooling for this transformation is accordingly given as ∆T ms = T me − T n = ∆T p − 142 K, with T me (1261 K) as the melting point of the metastable eutecticReference Battezzati, Antonione and Baricco7; for the second (eutectic) transformation, as the maximal recalescence temperature (MRT) can reach the equilibrium eutectic point, T e (1366 K), a eutectic reaction from the residual liquid can be assumed, so that the undercooling for this reaction is defined as ∆T r =T e − T f, with T f as the start temperature of the second transformation (e.g., samples 4–7 of Fig. 1).
Cooling curves of hypereutectic Ni–4.5 wt% B alloy corresponding to different undercoolings: sample 1, ∆T p ∼ 5 K; sample 2, ∆T p ∼ 50 K; sample 3, ∆T p ∼ 151 K; sample 4, ∆T p ∼ 179 K and ∆T r ∼ 131 K; sample 5, ∆T p ∼ 175 K and ∆T r ∼ 123 K; sample 6, ∆T p ∼ 218 K and ∆T r ∼ 158 K; sample 7, ∆T p ∼ 240 K and ∆T r ∼ 158 K; sample 8, ∆T p ∼ 283 K.

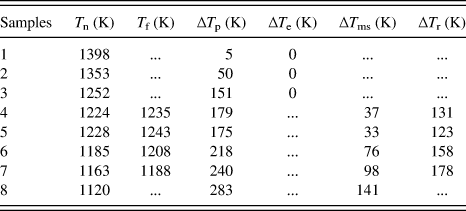
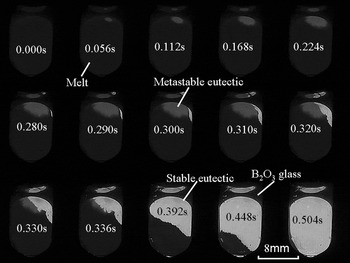
From the cooling curve of samples 1–8 (Fig. 1), the character temperatures and the undercoolings are measured, as listed in Table I. Since the glass slag technique is denucleating the sample surface heterogeneous nucleation by B2O3 glass to acquire the large undercooled melt, the change of the sample's composition can be neglected, i.e., all the compositions are Ni–4.5 wt% B. The cooling curves of 45 samples indicate that: when the initial nucleation temperature is higher than 1228 ± 10 K, i.e., ∆T p < 175 ± 10 K (20 cases), only one recalescence appears in the cooling curve; when the initial nucleation temperature is lower than 1228 ± 10 K, i.e., ∆T p ≥ 175 ± 10 K (25 cases), two recalescences appear in the cooling curve. Note that for sample 8 with ∆T p ∼ 283 K, although only one recalescence peak can be seen in the cooling curve, HSV recording as shown in Fig. 2 indicates that indeed two recalescences appear in the solidification (Fig. 2). From HSV images, we can also find that the growth velocity of the first transformation (metastable eutectic) is far smaller than that of the second one (stable eutectic).
The character temperatures for the transformations of samples 1–8.
HSV images of sample 8 with ∆T p ∼ 283 K.

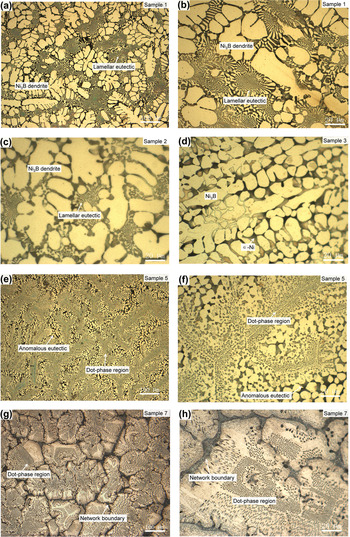
To study the as-solidified structures corresponding to the two types of cooling curves, optical microscope observations of samples 1, 2, 3, 5, and 7 were performed as shown in Fig. 3. The black phases are α-Ni, whereas the bright phases are Ni3B. For case I, e.g., samples 1–3 [Figs. 3(a)–3(d)], the structures consist of primary phase (Ni3B) and regular lamellar eutectic (Ni/Ni3B). Clearly, the lamellar eutectic grows directly from the dendrite phase (Ni3B), unlike in the hypoeutectic alloy,Reference Xu, Liu and Dang12 from the halo phase (Ni3B) around the dendrite phase (α-Ni). This indicates that the Ni3B phase is necessary for the occurrence of eutectic reaction (L → Ni/Ni3B). For case II, e.g., samples 5 and 7 [Figs. 3(e)–3(h)], the structure consists of the dot-phase region (dot phases + matrix) and the anomalous eutectic [Figs. 3(e) and 3(f)]/network boundary [the network boundary can be seen as a shrunk structure of the anomalous eutectic, the structure is shaped like grain boundary, Figs. 3(g) and 3(h)]. It is worth noting that the dot phases of sample 5 distributed as a bamboo pattern, and the angle is near 120°, which suggests that the metastable phase may be a faceted structure. Similarly, the distribution of the dot phases for sample 7 also shows the faceted characteristic.
Microstructures of different undercoolings: (a) and (b) sample 1; (c) sample 2; (d) sample 3; (e) and (f) sample 5; (g) and (h) sample 7.

For case I, the differences of the microstructures are mainly reflected by the size of the primary phase, d, and the fractions of the lamellar eutectic, f L. For example, for samples 1–3, the size of the primary Ni3B dendrite is d (∆T p ∼ 5 K, sample 1) > d (∆T p ∼ 50 K, sample 2) > d (∆T p ∼ 151 K, sample 3), and the fraction of the lamellar eutectic is f L(∆T p ∼ 5 K, sample 1) > f L(∆T p ∼ 50 K, sample 2) > f L(∆T p ∼ 151 K, sample 3). For case II, the differences are mainly reflected by the fractions of the dot-phase region, f D and the anomalous eutectic (or the network boundary), 1 − f D. For example, from Figs. 3(e)–3(h), the fraction of the dot-phase region increases with ∆T r, i.e., f D (∆T r ∼ 123 K, sample 5) < f D (∆T r ∼ 178 K, sample 7), whereas that of the anomalous eutectic is on the contrary. Therefore, the main change of the solidification behavior of Ni–4.5 wt% B alloy is that the dot-phase region appears and the lamellar eutectic disappears if ∆T p ≥ 175 ± 10 K.
B. SEM and TEM studies
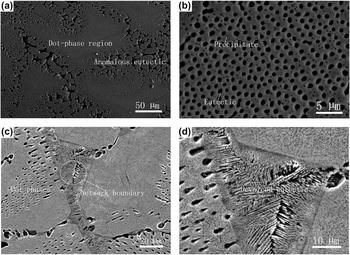
To study the dot-phase region and the network boundary, Figs. 4(a)–4(d) show the classical SEM images of samples 5 and 7, respectively. If ∆T p ∼ 175 K [sample 5, Figs. 4(a) and 4(b)], two kinds of dot phases can be observed: one of which with a large size (>500 nm) and regular distribution is like the rod eutectic, whereas the other with a small size (<100 nm) and irregular distribution is like the precipitated phase. If ∆T p ∼ 240 K [sample 7, Figs. 4(c) and 4(d)], two kinds of dot phases also can be observed in the dot-phase region. In addition, at the network boundary, many small Ni3B dendrites can be observed clearly. It suggests that the network boundary is a kind of divorced eutectic, which can also be found in many other eutectic alloys.Reference Verhoeven and Gibson14,Reference Olejnik and Fraś15 The possible reasons for forming this divorced eutectic are as follows: (i) the volume fraction of the residual liquid is small; (ii) the residual liquid is supersaturated with boron, so that the Ni3B dendrite grows rapidly as soon as it nucleates.
SEM images of the dot phases: (a) and (b) sample 5 (∆T p ∼ 175 K, ∆T r ∼ 123 K); (c) and (d) sample 7 (∆T p ∼ 240 K, ∆T r ∼ 158 K).

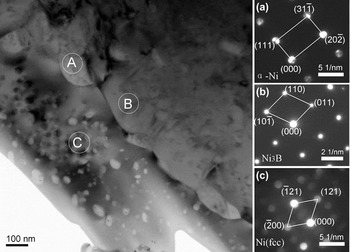
To determine the structures of the dot phases, sample 7 is chosen for TEM observation. Figure 5 shows the electron bright-field image and the interesting regions A to C. Clearly, the regular dot phases with large size (>200 nm) are like the rod eutectic due to the alternative distribution, whereas the irregular dot phases are like the precipitates due to the small size (from several nanometers up to 100 nm) and the disordered distribution. In the insets of Fig. 5, the selected area diffraction (SAD) pattern corresponding to the larger dot phase (region A of Fig. 5) is identified to be the Ni(FCC) structure with an orientation along the [1 $\bar 2$1]Ni direction; the SAD pattern of the matrix (region B) is identified to be the orthorhombic structure (Ni3B) with an orientation along the [1
 $\bar 1$1]Ni3B direction. As the small precipitated phase is so small, the micro-beam electron diffraction (MBED) technique is used. The result shows that the MBED pattern of the small precipitate at region C matches the Ni(FCC) structure along the [01
 $\bar 2$]Ni zone axis.
TEM examination for sample 7: bright-field image and SED pattern of region A (a large dot phase), region B (matrix), and MBED pattern of region C (a small dot phase).

As a result, regular dot phases (Ni) are from the metastable eutectic transformation (L → Ni23B6/Ni), whereas irregular dot phases (Ni) and matrix (Ni3B) are from the decomposition of Ni23B6 (Ni23B6 → Ni3B/Ni).
C. Solidification pathways
From the cooling curve and the microstructure evolutions, when a sample is cooled from the molten state and the primary solidification occurs at ∆T p ∼ 5 K (sample 1, Fig. 1), the Ni3B phase forms first at the recalescence stage according to the equilibrium phase diagram,Reference Franke, Neuschütz, Franke and Neuschütz16 and then, the temperature continues to decline until ∼1366 K, where the eutectic solidification is initiated and an isothermal stage appears in the cooling curve, which result in the Ni/Ni3B lamellar eutectic phase. Accordingly, the Ni3B dendrite and the Ni–Ni3B lamellar eutectic can be observed in the microstructure [Figs. 3(a) and 3(b)]. When ∆T p increases to 50 K (sample 2) or even 151 K (sample 3), according to the classical growth theories,Reference Boettinger, Coriell, Trivedi, Mehrabian and Parrish17 the dendrite (Ni3B) growth velocity increases with ∆T p, but the large recalescence leads to the dendrite remelting more seriously. Thus, the orientation of Ni3B dendrites increases, whereas the size of granular Ni3B reduces [Figs. 3(c) and 3(d)].
Whereas, if ∆T p ∼ 175 K (sample 5), two recalescences appear in the cooling curve. The MRT of the first transformation just reaches ∼1250 K, which is close to T me (1261 K), namely the melting temperature of the metastable phase Ni23B6,Reference Baricco, Ferrari and Battezzati6,Reference Battezzati, Antonione and Baricco7 and that of the second recalescence is near T e (1366 K), the melting temperature of the stable eutectic. So the first transformation corresponds to L → Ni/Ni23B6, whereas the second recalescence corresponds to Lr → Ni/Ni3B (Lr is the residual liquid). Accordingly, the microstructure consists of the dot-phase region (the trace of Ni/Ni23B6 eutectic phase) and the anomalous eutectic (Ni/Ni3B), as shown in Figs. 3(e) and 3(f).
If ∆T p ∼ 240 K (e.g., sample 7), the MRT of the second reaction is far below T e (1366 K). In the other words, much of the liquid has been consumed by the primary solidification (L → Ni/Ni23B6), and the fraction of the residual liquid is so small that the divorced eutectic (Lr → Ni/Ni3B) forms. Thus, the dot-phase region (the trace of Ni/Ni23B6 eutectic) and the network boundary (Ni/Ni3B eutectic) can be observed [Figs. 3(g) and 3(h)].
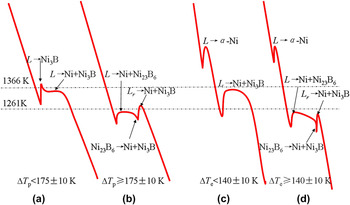
As a consequence, for Ni–4.5 wt% B alloy, if ∆T p < 175 ± 10 K, i.e., T n > 1228 ± 10 K (e.g., samples 1–3), as shown in Fig. 6(a), the first transformation is corresponding to L → Ni3B, whereas the second transformation is corresponding to L → Ni/Ni3B. If ∆T p ≥ 175 ± 10 K, i.e., T n ≤ 1228 ± 10 K (e.g., samples 4–8), as shown in Fig. 6(b), the first transformation is corresponding to L → Ni/Ni23B6, where the Ni23B6 phase is highly unstable, and it decomposes subsequently into Ni and Ni3B; Ni exists as dot-like precipitates (Figs. 4 and 5), and Ni3B activates the transformation of Lr → Ni/Ni3B (corresponding to the second recalescence), thus giving the anomalous eutectic or the devoiced eutectic (network boundary).
Schemes of cooling curves and solidification pathways for hypereutectic (a, b) and hypoeutectic (c, d) alloys.

Our previous study shows that for the hypoeutectic Ni–Ni3B alloy,Reference Xu, Liu and Dang12,Reference Xu, Liu and Zhang13 there are also two kinds of solidification modes which are controlled by ∆T e: if ∆T e < 140 ± 10 K, i.e., T n > 1226 ± 10 K, the solidification pathway is primary solidification (L → α-Ni)—eutectic solidification (L → Ni/Ni3B), as shown in Fig. 6(c); if ∆T e ≥ 140 ± 10 K, i.e., T n ≤ 1226 ± 10 K, as shown in Fig. 6(d), primary solidification (L → α-Ni)—metastable eutectic solidification (L → Ni/Ni23B6)—decomposition of metastable phase and residual liquid solidification (Ni23B6 → Ni/Ni3B and Lr → Ni/Ni3B). So the solidification behaviors of hypoeutectic and hypereutectic alloys at least have three common characters: (i) for both of the two alloys, there is a common critical nucleation temperature for metastable eutectic reaction (L → Ni/Ni23B6), i.e., T n ≤ 1227 ± 10 K; (ii) if the Ni3B phase nucleates first, the metastable eutectic reaction will not occur; (iii) if the metastable eutectic reaction occurs, the Ni/Ni3B eutectic will form around the dot-phase region, shaped as a network. In addition, there are two significant differences between the two alloys: (i) the primary solidification is L → Ni3B for hypereutectic alloys [Fig. 6(a)] and L → α-Ni for hypoeutectic alloys [Fig. 6(c)], but the present study suggests that for a hypoeutectic alloy, after primary solidification, the composition of the residual liquid approaches to a hypereutectic alloy; (ii) the dendrite-like divorced eutectic can be found in the network boundary of the hypereutectic but not in the hypoeutectic alloy, which is probably ascribed to the high content of boron for the former.
The solidifications of Ni–3.3 wt% BReference Xu, Liu and Dang12,Reference Xu, Liu and Zhang13 and Ni–4.5 wt% B alloys suggest that: (i) for an eutectic alloy, the phase fractions and solidification pathways must be controlled by a single phase (e.g., Ni3B) who plays the key role for eutectic reaction; (ii) for the hypereutectic or hypoeutectic alloy, after primary solidification, the composition of the residual liquid changes with the eutectic reaction undercooling, so the kinetics of eutectic transformation cannot be interpreted by the classical theories, such as JH, TMK, and LZ modelsReference Jackson and Hunt18–Reference Li and Zhou20 due to the assumption of constant composition, and a new model needs to be developed.
In addition, from the theoretical predictions of Trivedi and Kurz,Reference Trivedi, Kurz, Szefanescu, Abbaschian and Bayuzick21 Galenko et al.,Reference Galenko and Herlach22,Reference Galenko23 for solidification of the eutectic alloy with high undercooling, the eutectic reaction could be suppressed, and homogeneous supersaturated regions then appear. However, for Ni–Ni3B alloys, the homogeneous supersaturated regions have not been observed at high undercooling. There are three possible reasons: first, the achieved undercooling of the present study is not large enough; second, the theory model is based on the metallic eutectic such as Ag–Cu, Al–Mg eutectic alloys,Reference Galenko and Herlach22 but for Ni–Ni3B alloys, Ni3B is an intermetallic phase, and at high undercooling, the Ni23B6 phase forms instead of Ni3B, which leads to difficulties in formation of a homogeneous supersaturated region; third, suppression of eutectic reaction and eutectic decomposition may only be exhibited at a very high cooling rate, and the cooling rate of the present experiment is too slow. Therefore, Ni–Ni3B alloys can act as a classical material for studying the theory of eutectic solidification including the intermetallic compound.
IV. CONCLUSIONS
For the Ni–4.5 wt% B alloy, if ∆T p < 175 ± 10 K, the solidification pathway is primary solidification (L → Ni3B)—eutectic solidification (L → Ni/Ni3B), and the microstructure consists of Ni3B dendrite + lamellar eutectic, where the phase sizes and fractions depend on ∆T p; if ∆T p ≥ 175 ± 10 K, the solidification pathway is metastable eutectic solidification (L → Ni/Ni23B6)—decomposition of the metastable phase and residual liquid solidification (Ni23B6 → Ni/Ni3B and Lr → Ni/Ni3B), and the microstructure consists of dot-phase region + anomalous eutectic/network boundary, where the phase fractions depend on ∆T r. The dot phases are determined as rod eutectic and dot precipitates, whereas the network boundary is determined as the divorced eutectic. Solidification pathways show that, for both hypoeutectic and hypereutectic Ni–Ni3B alloys, the solidification behaviors depend on the nucleation of the Ni3B phase, and there is a common critical nucleation temperature, 1227 ± 10 K, for occurrence of the metastable eutectic reaction.
ACKNOWLEDGMENTS
The authors are grateful for the financial support of the China National Funds for Distinguished Young Scientists (Grant No. 51125002), the National Basic Research Program of China (973 Program, Grant No. 2011CB610403), the Natural Science Foundation of China (Grant Nos. 50901059, 51071127, 51171136, and 51301125), the President fund of Xi'an Technological University (XAGDXJJ1307), and the 111 project (project no. B08040). J.F. Xu expresses thanks to C.Y. Hu, J.W. Xu, Z. Jian, M. Zhu, and Y.Y. Zhang for their help in this work.