Introduction
Excavations in 2015 near the city of Kortrijk in north-western Belgium revealed an oven structure of Middle Neolithic (Michelsberg Culture) date. Its large size, tripartite structure and indications of a domed superstructure make it an unusual find for Neolithic Western Europe. This article presents the results of a multi-disciplinary study of this structure and discusses its typology and possible function through comparison to similar features found across Europe. We argue that it is probably an oven used for drying cereals and/or baking bread—activities possibly organised on a communal level.
In contrast with Western Europe, oven features are quite common on Neolithic sites in Central and South-east Europe. An overview of the typology and possible functions of these features (Petrasch Reference Petrasch1986) groups single-chamber structures into pit ovens (Grubenöfen), set into the ground, and domed ovens (Kuppelöfen), which have at least part of the structure constructed above the ground surface. Both types are present from the Early Neolithic onwards, and are often found inside or close to houses; a domestic function (i.e. heating, drying or baking) is assumed for most of these ovens. In Western Europe, Neolithic ovens are far less frequently encountered. Pit ovens are known—albeit in small numbers—on Early Neolithic sites of the Linearbandkeramik (LBK) Culture. This Central European culture rapidly colonised the loess area of Western Europe in the second half of the sixth millennium cal BC. Examples of pit ovens on LBK sites are known from western Germany, north-eastern France, the southern Netherlands and, possibly, central Belgium (Waterbolk Reference Waterbolk1959; Farruggia et al. Reference Farruggia, Kuper, Luning and Stehli1973; Kuper et al. Reference Kuper, Lohr, Luning, Schwellnus, Stehli and Zimmerman1975; Lodewijckx Reference Lodewijckx, Cahen and Otte1990; Marchal Reference Marchal1998; Jeunesse & Lefranc Reference Jeunesse and Lefranc1999; Collin & Marchal Reference Collin and Marchal2000; Lüning Reference Lüning and Hänsel2004).
In contrast to pit ovens, domed ovens in Western Europe are not well known or much documented; currently none are known from LBK sites, and they feature only rarely at post-LBK sites. A few possible domed ovens have been reported for this region, mainly located in northern France and dating to the end of the Early and Middle Neolithic periods (c. 4800–4000 cal BC) (Marcigny & Ghesquière Reference Marcigny and Ghesquière1998; Ghesquière et al. Reference Ghesquière, Marcigny and Lepaumier1999; Dron et al. Reference Dron, Seignac and Thomas2002, Reference Dron, Ghesquière, Marcigny and Frère-Sautot2003; Hauzeur Reference Hauzeur2008; Samzun & Warmé Reference Samzun and Warmé2008; Coulon & Dupont Reference Coulon and Dupont2011; Naze Reference Naze2011). Most of these examples, however, are poorly preserved, and their precise structural form and function remain difficult to interpret.
Archaeological background
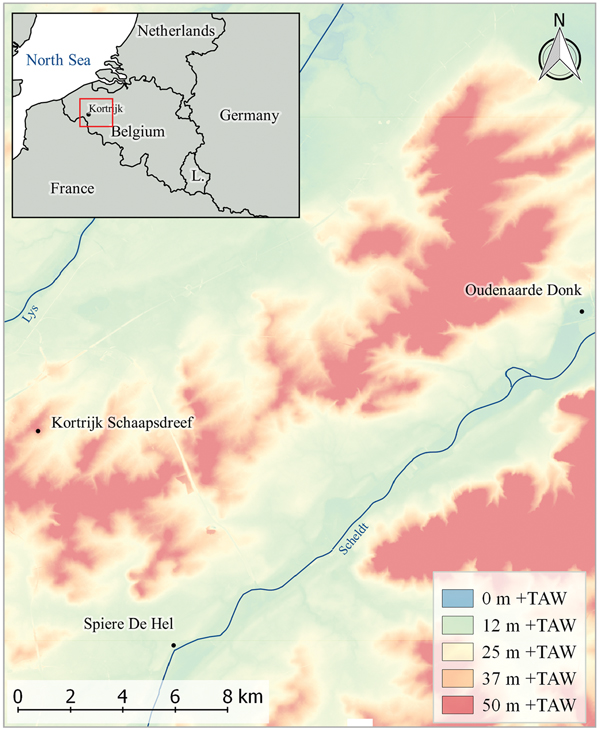
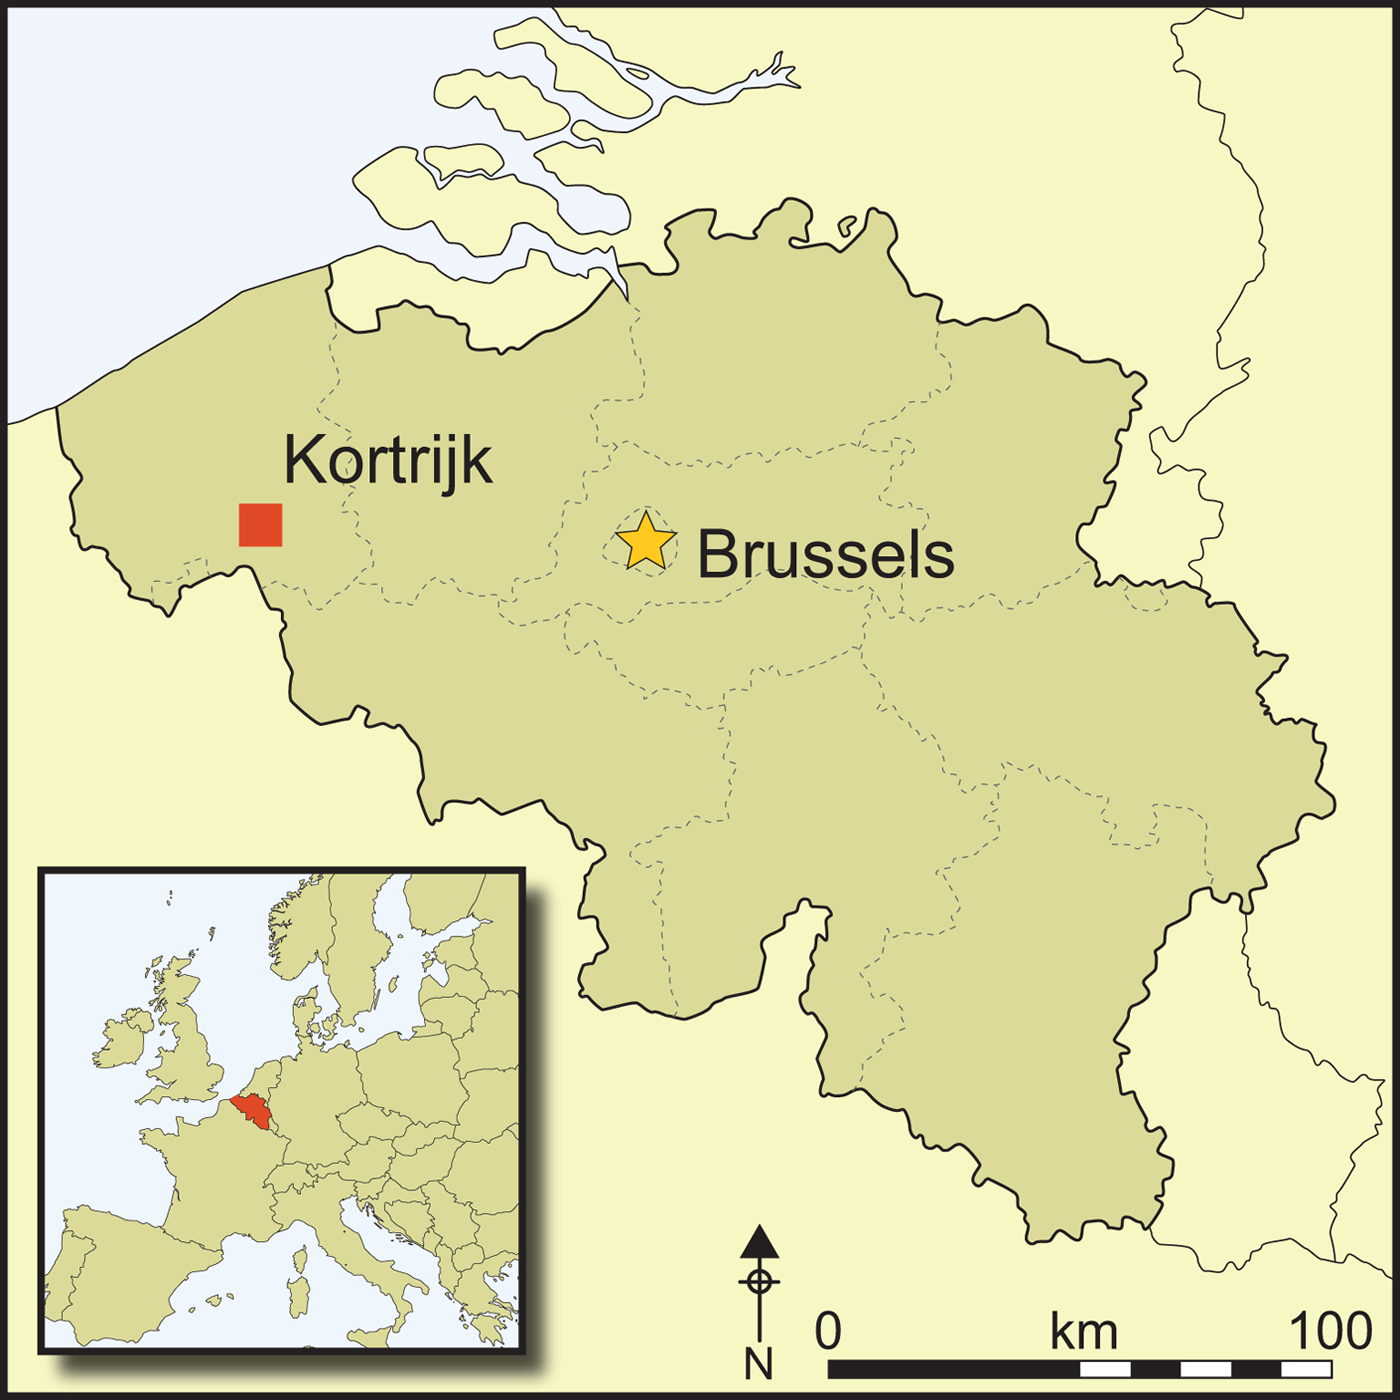
The site of Kortrijk ‘Schaapsdreef’ is situated in north-western Belgium (province of West-Flanders), between two rivers: the Lys, 4km to the north, and the Scheldt, 10km to the south (Figure 1). The area between these rivers is characterised by a series of Tertiary hills, consisting mainly of clayey sediments (Kortrijk Formation) covered by Late Pleistocene sandy loam. The site is located on one of these hills, facing the Lys Valley. Many Middle Neolithic sites are known in this area, some of which can be attributed to the Michelsberg Culture (Crombé & Vanmontfort Reference Crombé and Vanmontfort2007; Vanmontfort Reference Vanmontfort2007). These include the enclosed site of Spiere ‘De Hel’ and the wetland site of Oudenaarde ‘Donk’ (Parent et al. Reference Parent, Van der Plaetsen and Vanmoerkerke1986–1987, Reference Parent, Van der Plaetsen and Vanmoerkerke1989; Vanmontfort Reference Vanmontfort2004). As such, these sites are situated at the north-western limit of the Michelsberg Culture territory, which extended from the Rhine basin in the east to the Atlantic coast in the west. It is assumed that these groups played a significant role in the expansion of the Neolithic tradition towards the British Isles (Whittle et al. Reference Whittle, Healy and Bayliss2011).
Digital elevation model of the upper Scheldt basin with the location of the Middle Neolithic sites mentioned in the text: Kortrijk ‘Schaapsdreef’, Spiere ‘De Hel’ and Oudenaarde ‘Donk’ (figure by N. Baeyens).

In 2015, an area of approximately 2.7ha was excavated along the Schaapsdreef in Kortrijk, revealing artefacts and settlement traces from the Bronze Age to the Early to High Middle Ages (Baeyens Reference Baeyens2017). The oven was discovered near the north-eastern limit of the excavation area. Other Middle Neolithic features were limited to a few shallow pits or postholes containing Michelsberg Culture pottery.
Structure
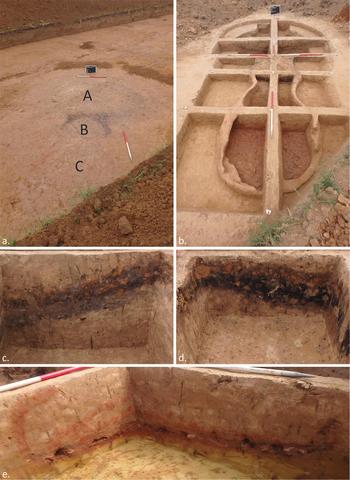
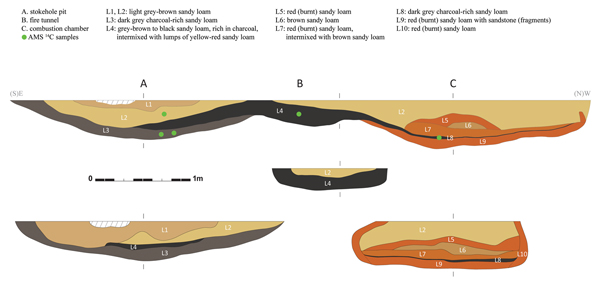
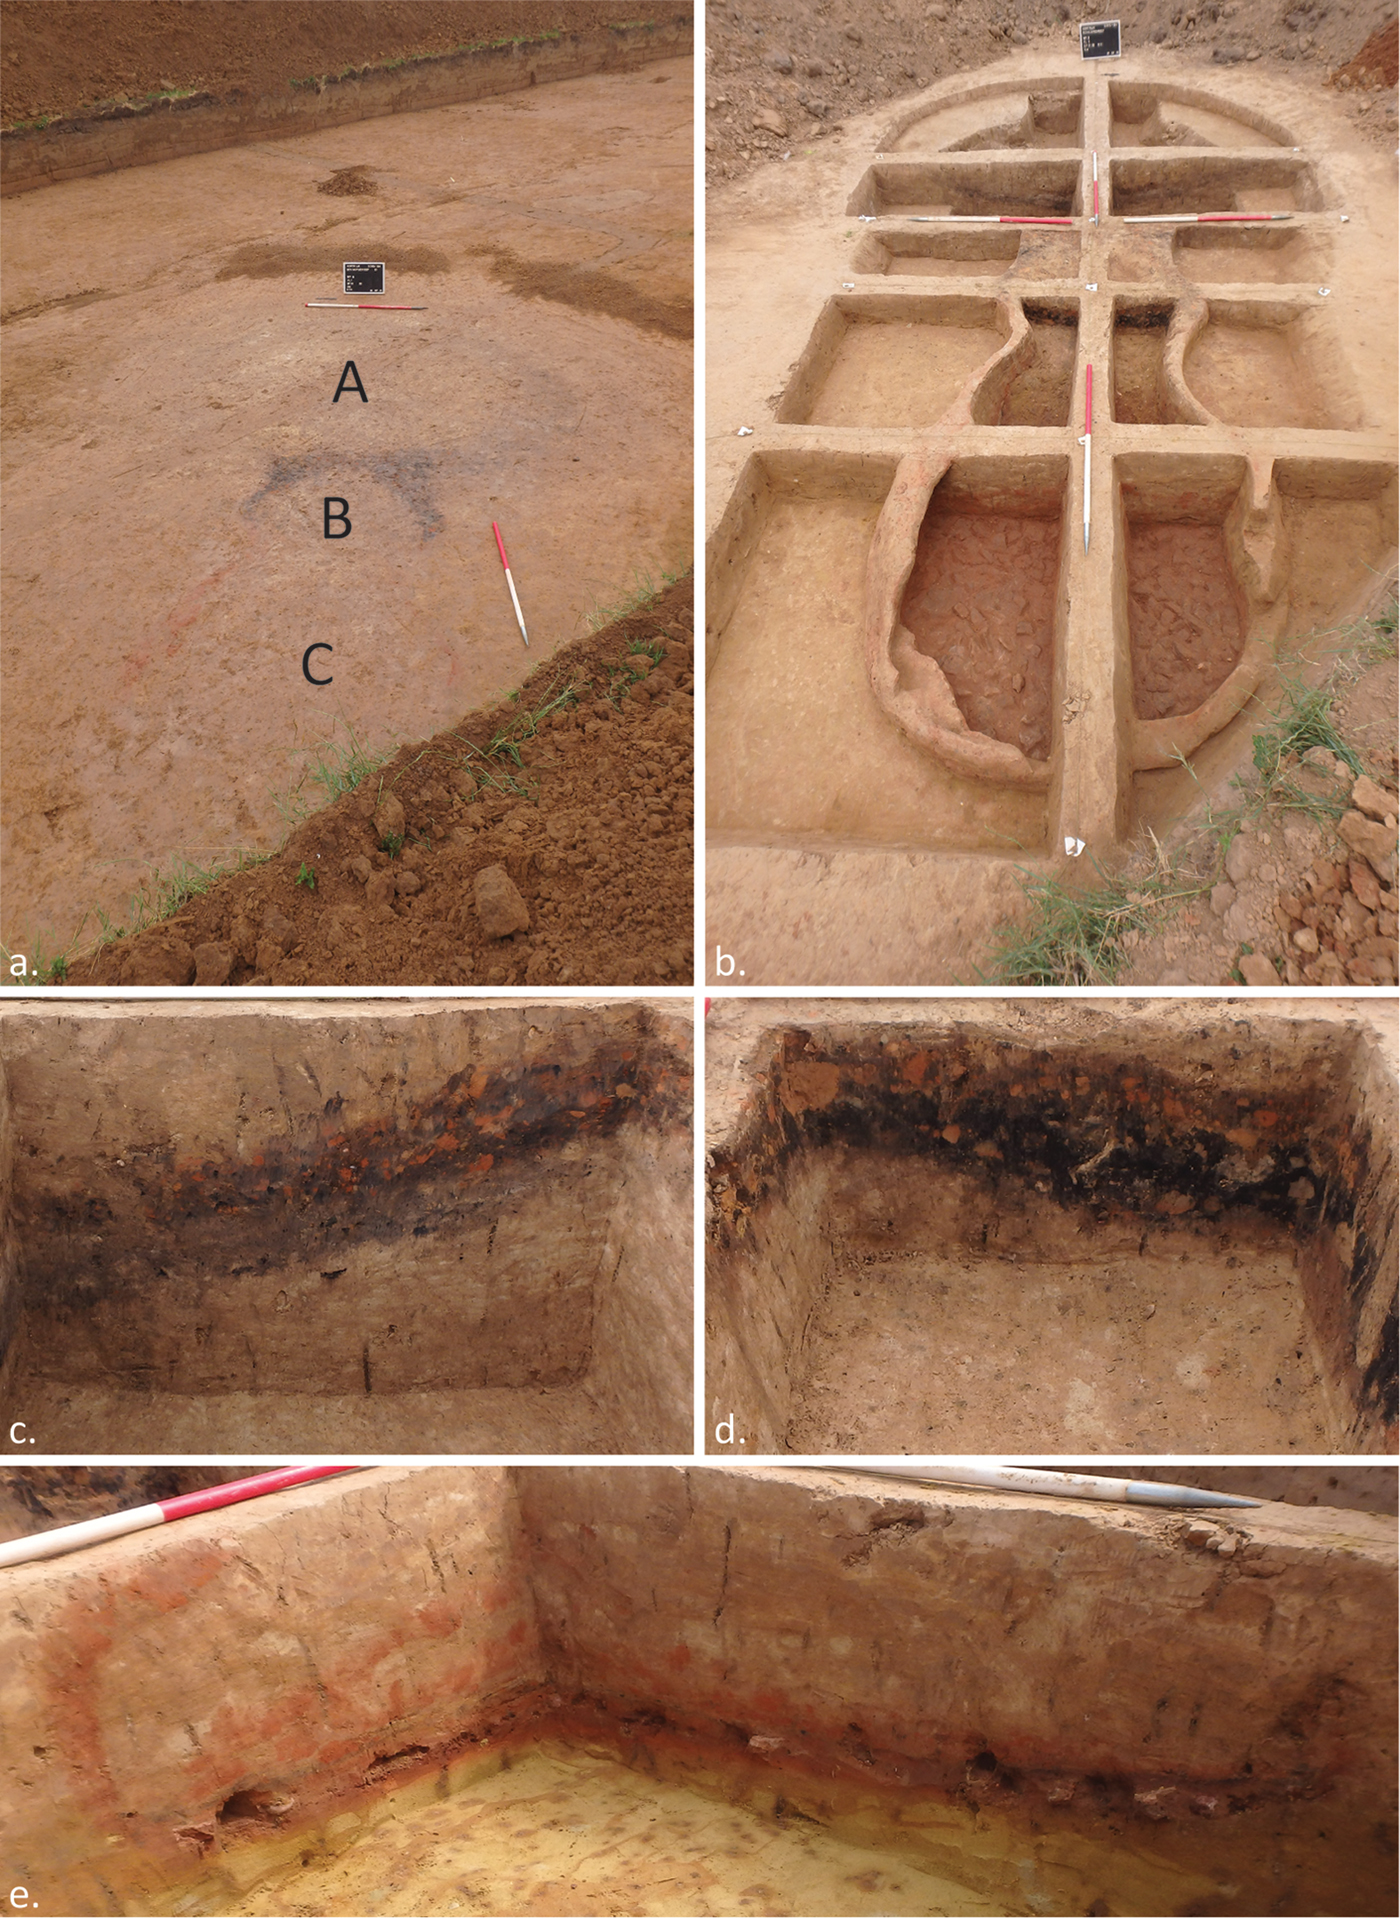
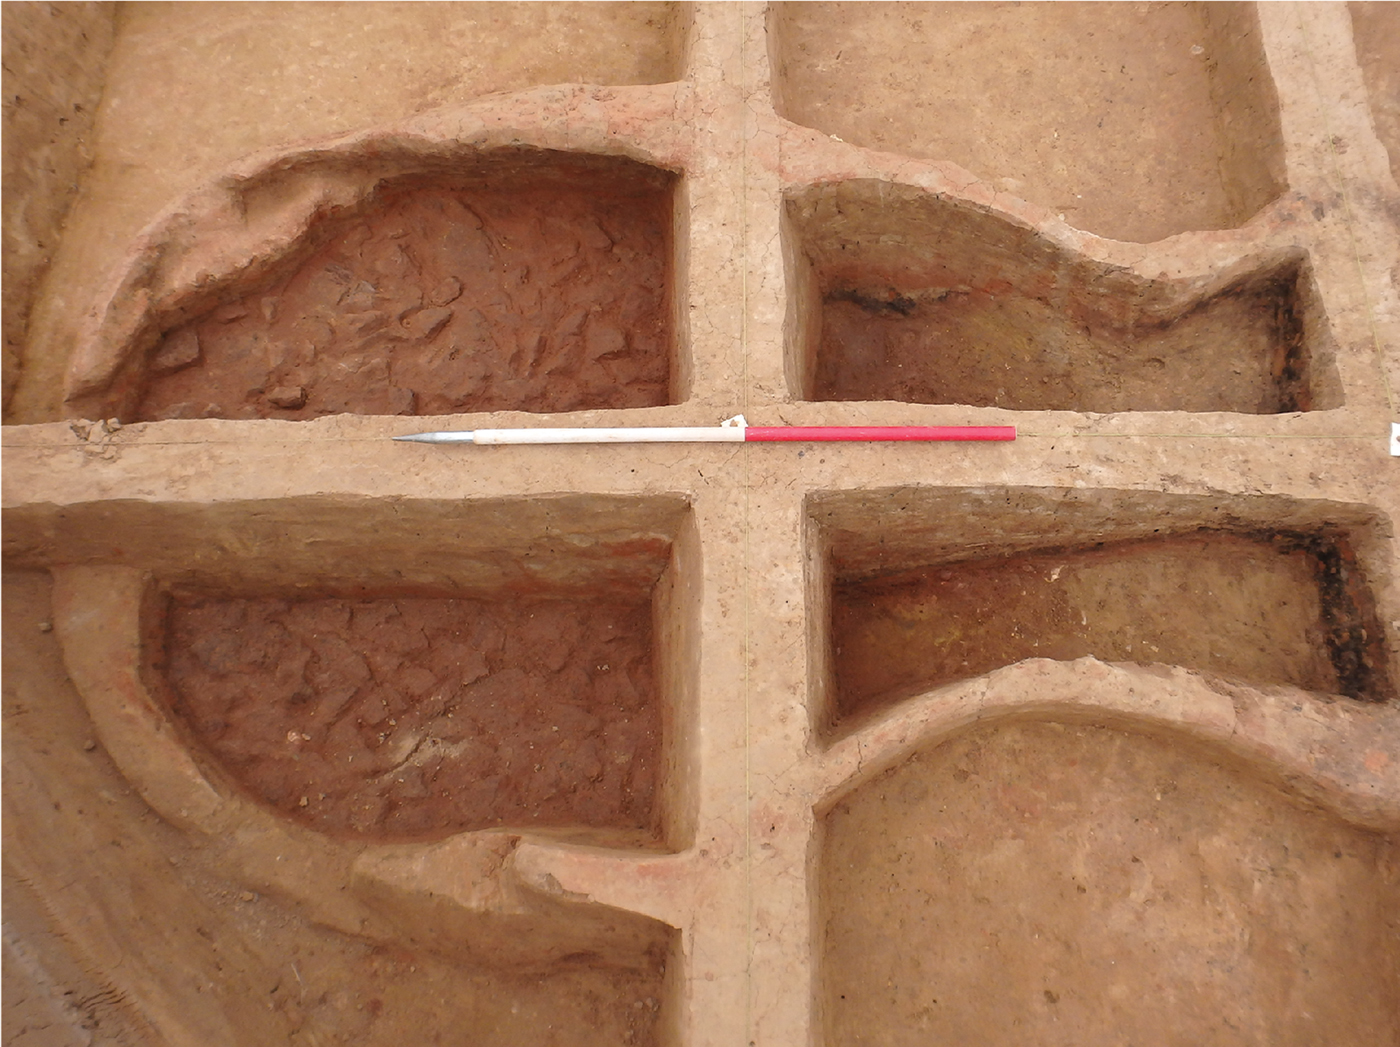
The oven structure (9111/112) has a keyhole-shaped plan comprised of three parts: a stokehole pit, a fire tunnel or flue and a combustion chamber (Figures 2–3). Oriented east to west, the structure's total length (stokehole pit included) is approximately 6m. The stokehole pit is sub-circular (2.55m long, 2.9m wide and 0.41m deep) with a concave bottom. Its fill consisted of a charcoal-rich deposit, beneath two distinct grey-brown sandy loam layers. On the western side of the stokehole pit, the charcoal-rich layer is covered by sediment from the fire tunnel (Figure 2c). The fire tunnel (0.9m long, 1.22m wide and 0.28m deep) connects the stokehole pit and the combustion chamber. The tunnel was filled with a charcoal-rich sandy loam deposit intermixed with lumps of yellowish-red (burnt) sediment (Figure 2d). This is interpreted as a mix of ash and charcoal fragments from wood fuel, and debris from the vaulted roof that originally covered the tunnel. The fire tunnel slopes down to the floor level of the combustion chamber approximately 0.2m below. The combustion chamber (2.60m long, 1.86m wide and 0.51m deep) is an oval-shaped structure with a more or less flat base incorporating broken stones. Apart from its large size, the most striking feature of the combustion chamber is the extant lower wall of the domed superstructure.
Oven 9111/112 at Kortrijk ‘Schaapsdreef' before and after excavation (a–b), with the stoke hole (A), firetunnel (B) and combustion chamber (C); c) detail of the stoke hole; d) fire tunnel; e) the combustion chamber after removal of the stone floor level (figure by D. Teetaert).
Cross-sections of the oven structure with indication of the sediment layers sampled for AMS radiocarbon dating (green circles). The stoke hole is cut by a recent shallow ditch (hatched area) (figure by D. Teetaert).

Dome
The combustion chamber is defined by a wall of reddish burnt sediment (160mm thick at its maximum). The wall survives to a height of 0.5m and slopes inwards at the top (Figure 2e), indicating that the chamber was probably originally domed. On top of the chamber floor (Figure 3: L9), covered by a very thin layer of charcoal-rich sediment (Figure 3: L8), the fill of this chamber is characterised by two horizontal layers of burnt sediment (Figure 3: L7 & L5) that probably relate to the domed roof that collapsed during, or after, the final use of the oven. A similar stratigraphy has been recorded for a Cerny Culture (c. 4600–4250/4000 cal BC) oven at Hébécrevon (Normandy, France), within which several fragments of an oven dome were discovered collapsed onto the combustion chamber floor (Ghesquière et al. Reference Ghesquière, Marcigny and Lepaumier1999: 532). It is impossible to reconstruct definitively the form of the Kortrijk oven's superstructure, as the wall survives to only a limited height and the dome has collapsed. A number of possible forms are mentioned in the literature, from rounded domes to cubiform domes with flat roofs (Petrasch Reference Petrasch1986; Đuričić Reference Đuričić, Vitezović and Antonović2014). Based on experiments to reconstruct domed ovens of the Vinča Culture (Belo Brdo site, Serbia), Đuričić (Reference Đuričić, Vitezović and Antonović2014: 270) argues that clay is the best material to use for the construction of a dome; in contrast, Petrasch (Reference Petrasch1986: 40) suggests the use of loam mixed with plant material, such as straw. In either case, a wooden frame coated on either side with clay or loam can be used for building the dome. Other possible construction techniques, such as coil or slab building, are also mentioned in the literature (e.g. Germaine-Valléé et al. Reference Germaine-Valléé, Prevost-Dermarkar and Lespez2011). For the Kortrijk oven, there are no indications of the use of a wooden frame to construct the dome. The burnt sediment of the dome wall consists of pure sandy loam—identical to the sediment of the surrounding soil—with no plant material incorporated. The dome wall that is preserved in situ points to a single construction phase.
Combustion chamber floor
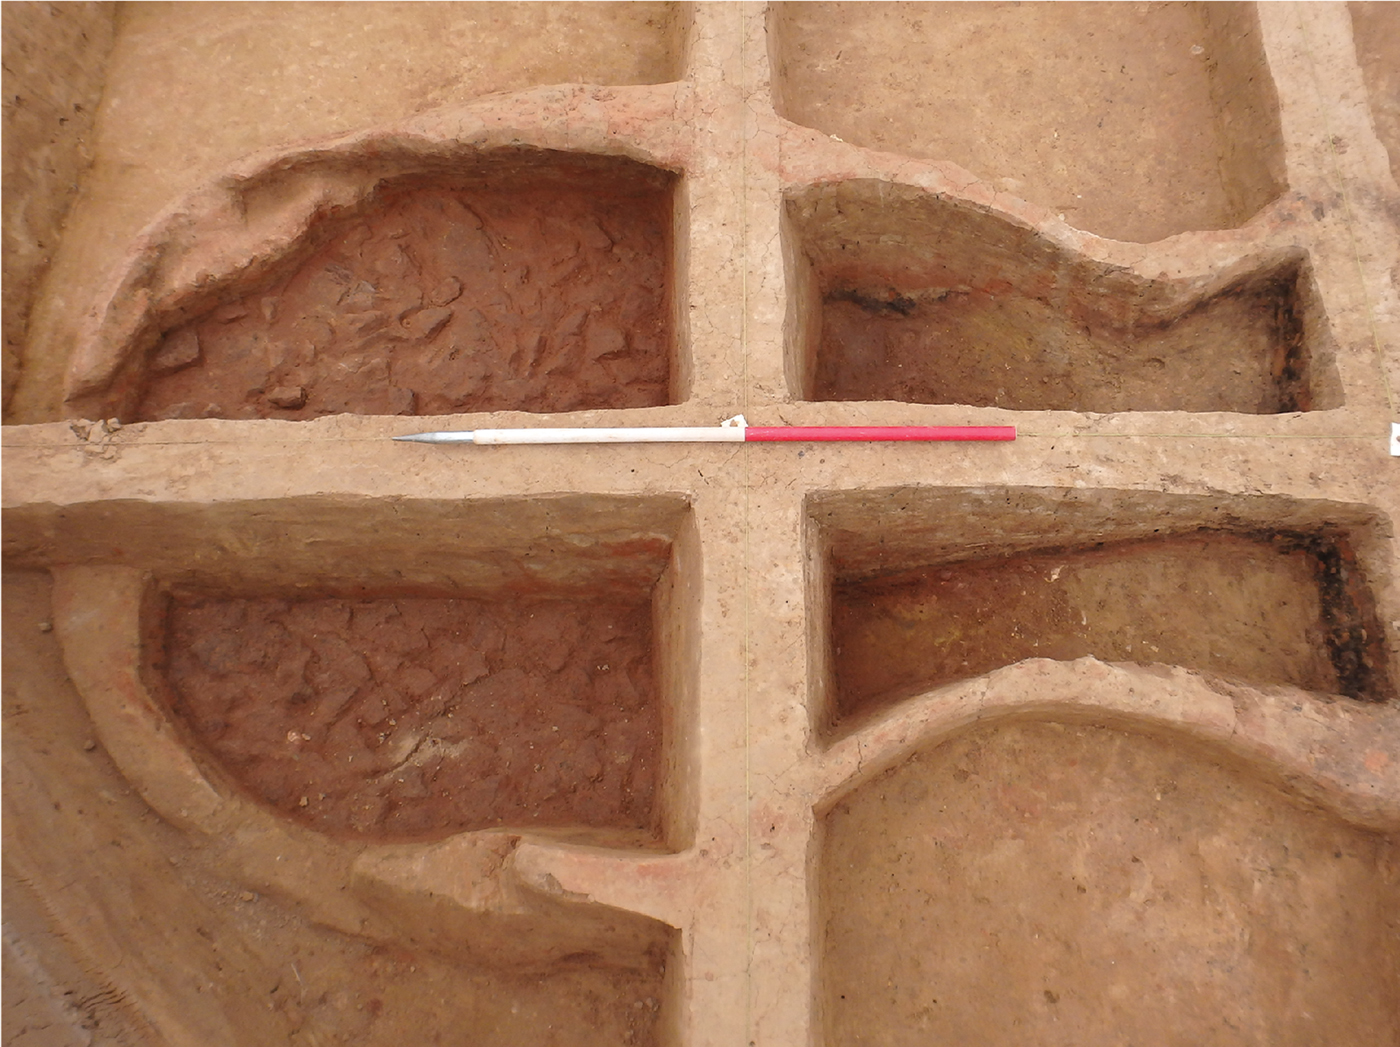
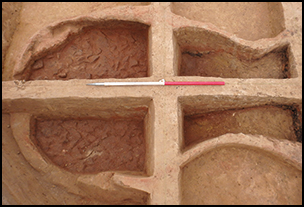
The base of the combustion chamber is composed of dozens of pieces of stone, which create a floor covering the entire chamber (Figure 3: L9 & Figure 4). These stone pieces are greenish glauconiferous sandstones or ‘fieldstones’ typical of Eocene sediments (Ypresian layer) (Gullentops & Wouters Reference Gullentops and Wouters1996: 90). The nearest outcrop of such fieldstones is situated approximately 11km to the east of the site.
Plan view of the combustion chamber paved with a sandstone floor level (figure by N. Baeyens).
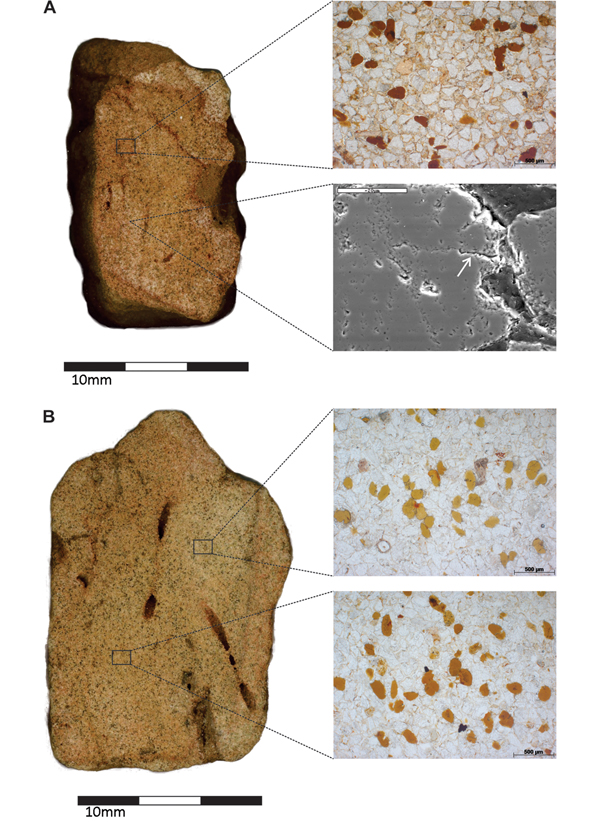
The sandstones demonstrate a reddish discolouration. Two stone samples (Figure 5) were analysed using optical petrography, X-ray diffraction (XRD), scanning electron microscopy (SEM) and dithionite-citrate bicarbonate (DCB) extraction. Macroscopically, both samples display a subtle discolouration along the rim (the outer zone of the sandstones), which is more pronounced in sample A. Colour changes in sandstones are related to mineral transformations—the oxidation of iron-bearing minerals to haematite during heating is accompanied by an intense colour change (Hajpal & Török Reference Hajpal and Török2004). The X-ray diffraction patterns of both rim and core samples of the two pieces of sandstone show the presence of mainly quartz, glauconite and a small quantity of feldspar, but no iron-oxide minerals. DCB analysis revealing ‘free iron’ oxides of less than 0.4wt per cent explains why these minerals were not detected by XRD. According to Winkler (Reference Winkler1994), however, often only a small fraction of a per cent is necessary to elicit change to a reddish colour. XRD results concur with the optical petrography performed on thin sections (30μm-thick), which demonstrates that the samples consist predominantly of quartz and rounded glauconite grains embedded in an opal matrix.
Photographs of sections of the glauconiferous sandstone samples A and B, obtained by optical microscopy (plane polarised light, 50× magnification) and scanning electron microscopy (750× magnification). Sandstone sample A shows heavier alteration. Note the micro-cracks (arrow) in a quartz grain on the SEM image (figure by G. Fiers).

The glauconite grains in sample A are brownish (RGB 126, 70, 53), while the grains in sample B appear green-yellowish (RGB 179, 147, 77) in the centre and orange-brownish (RGB 162, 104, 34) at the rim (Figure 5) (as a colour standard, we used an X-rite ColorChecker chart). This observed change (in thin section) in glauconite grain colour is associated with the macroscopically visible discolouration, which can alter due to soil weathering or as a result of exposure to heat (e.g. McRae Reference McRae1972; Loveland Reference Loveland1981; Hajpal & Török Reference Hajpal and Török2004; De Kock et al. Reference De Kock, Dumon, Lanzon, Verbrugge, Van Ranst, Crombé and Cnudde2015; Haaland et al. Reference Haaland, Friesem, Miller and Henshilwood2017). During soil weathering, glauconite grains are observed to change from dark green with smooth boundaries, to brown with less distinct boundaries and internal cracking (Loveland Reference Loveland1981). The glauconite grains observed in our thin sections show brown colours with intact grain boundaries, with internal cracking limited to grades typically observed in fresh outcrop samples. These observations conform closely to those of Haaland et al. (Reference Haaland, Friesem, Miller and Henshilwood2017), who demonstrate a gradual colour change of glauconite grains from green to red-brown during experimental heating (at 700–800°C), wherein the boundary of the grain remains intact. Our observations therefore suggest that the alteration in colour in the two sandstone samples is probably due to heating.
Mineral structure can also change upon heating. SEM analysis shows some evidence of micro-cracking at the boundaries of quartz grains (Figure 5). These develop at temperatures above 600°C and are probably associated with the transformation of α-quartz to β-quartz at approximately 573°C (Hajpal & Török Reference Hajpal and Török2004). The macroscopically observed reddish discolouration of the sandstones, the brown discolouration of the glauconite grains and the presence of micro-cracks in the quartz grains suggest that the sandstones were heated. These observations confirm the use of this oven as a combustion structure. The function of the stone floor in the combustion chamber could have been similar to that of the dome (i.e. to retain heat from the fire), but the stone pieces could also have been put into the chamber as cooking stones.
Artefacts
The combustion chamber and fire tunnel yielded no archaeological objects; all of the artefacts were collected from the three sediment layers (Figure 3: L1–3) within the stokehole pit. The assemblage comprises 333 pottery fragments and 18 flint artefacts, evenly divided over the three layers. Four additional pottery fragments were recovered from the top sediment layer (Figure 3: L2) above the collapsed dome of the combustion chamber. The presence of food crusts on some pottery fragments and a small quantity of burnt animal bone from the stokehole pit suggest that these finds represent domestic settlement waste.
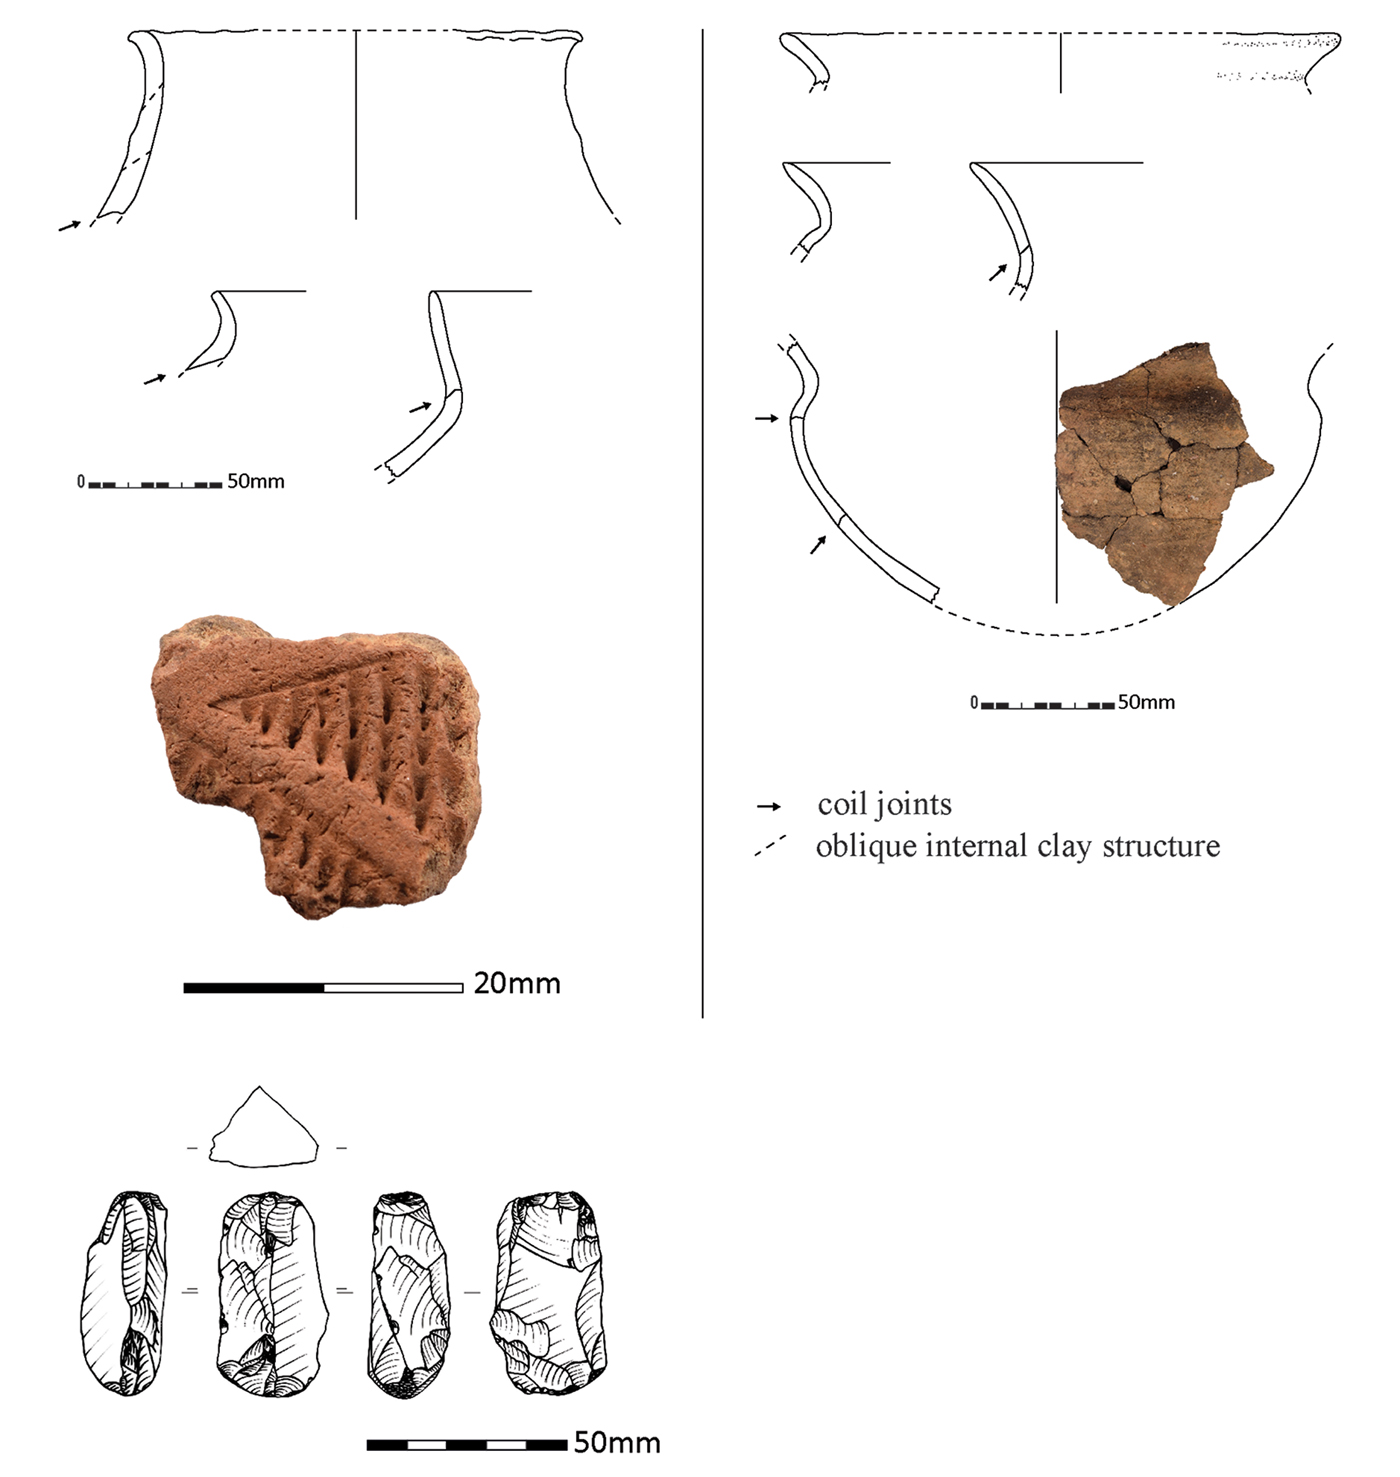
The pottery is relatively homogeneous; over 90 per cent of the sherds are tempered with a combination of burnt flint fragments and moss. A small pit located elsewhere at the site (1028) yielded similar flint- and plant-tempered pottery. The average thickness of the sherds is 6–8mm. The vessels were built using the coiling technique—as indicated by quadrangular fractures, defective joints (mainly N- and Z-joints) and an oblique internal clay structure. Some fragments display macrotraces indicating shaping of the vessels by scraping. The vessel walls (internal and external) were burnished. The 15 rim fragments belonging to this fabric group are from different vessels (Figure 6). At least one reconstructed profile belongs to a small beaker (Figure 6). No other profiles can be reconstructed. Based on technological—and to a lesser extent morphological—characteristics, this pottery corresponds with the Michelsberg Culture of the (upper) Scheldt basin (‘group of Spiere’) (Vanmontfort Reference Vanmontfort2001; Bostyn et al. Reference Bostyn, Monchablon, Praud and Vanmontfort2011). A small wall fragment from the bottom layer of the stokehole pit may represent a different pottery tradition, as it is tempered with plant material and possibly sand. It is decorated with parallel lines of pointed spatula impressions using the pointillé-sillonné technique, arranged in repeated triangular motifs (Figure 6). This decoration technique and pattern are characteristic of the Epi-Rössen/Bischheim tradition (Dammers Reference Dammers, Le Brun-Ricalens, Valotteau and Hauzeur2007).
Pottery and flint artefacts (strike-a-light) from the oven 9111/112 (left) and from pit 1028 (right) elsewhere on the site (technical drawings by J. Angenon & Y. Perdaen; figure by D. Teetaert).

The flint artefact assemblage comprises 14 flakes, a flake core, a core edge-trimming flake, a chunk and a strike-a-light. Only two of these artefacts—the chunk and one of the flakes—are obviously burnt; a third artefact shows ambiguous traces of thermal action in the form of some small cracks and the beginning of a reddish discolouration. None of the flint finds are clearly datable; raw materials and the techno-morphological features suggest that they are of Neolithic to Bronze Age. They do, however, exhibit techno-morphological homogeneity suggestive of the use of a (soft?) stone hammer, including bulbs of percussion, Siret-fractures, multiple impact cones and platform splinters. The raw material is a dark grey to black, fine- to medium-grained flint. Some pieces are imported from the flint mines of Spiennes (province of Hainaut, Belgium). These observations conform to the other 700+ lithic finds recovered from the wider site, either during field-walking in the 1960s, or during the excavation of the features in 2015. Among the typical Middle Neolithic artefacts are some flake axes and large end scrapers. Arrowheads and pointed blades are absent.
Archaeobotany
In total, 36 bulk samples (10 litres each) from eight different layers (L2–6 & L8–10) were wet-sieved with 0.5mm and 2mm meshes. The combustion chamber and fire tunnel yielded only charcoal fragments, although the bottom layer of the stokehole pit (L3) contained a large quantity of archaeobotanical macro-remains. Three bulk samples from this layer were analysed in detail (Table 1).
List of charred botanical macro-remains from three bulk samples (10 litres each) of the bottom layer (L3) of the stokehole pit (table by L. Allemeersch).

All of the archaeobotanical macro-remains are charred. Crop plants are represented only by cereals. Fifty-two grains or grain fragments were counted. Six can be identified as wheat (Triticum sp.), seven are probably hulled emmer wheat (Triticum dicoccum) and four naked wheat (Triticum durum/turgidum or aestivum/compactum) and, finally, two grains of barley (Hordeum sp.). The remaining grains are highly fragmented and can only be identified as Cerealia.
The presence of charred cereal grains in the stokehole pit suggests that cereal crops were cultivated in the vicinity of the oven structure. Several studies (e.g. Bakels Reference Bakels2009; Kreutz et al. Reference Kreutz, Markle, Marinova, Rosch, Schafer, Schamuhn and Zerl2014) point out that the Michelsberg farmers of North-western Europe grew four types of cereals: the hulled wheats, emmer and einkorn, a tetraploid form of naked wheat (referred to as Triticum durum/turgidum) and naked barley. As only kernels and no rachis (i.e. the main axis or stem of the spike of cereals) fragments were found in the oven, it is not possible to identify the species of naked wheat and barley. Further evidence for crop cultivation near the site is the presence of goosefoot (Chenopodium album) and field-brome or rye-brome (Bromus arvensis/secalinus) among the charred wild plant seeds. Both of these plants are common field weeds (modern and in the Neolithic period) (Kreutz et al. Reference Kreutz, Markle, Marinova, Rosch, Schafer, Schamuhn and Zerl2014: 92). It is possible that the charred remains of cereals and field weeds were deposited inside the stokehole pit as settlement waste, along with the pottery and lithic artefacts. It is more probable, however, that they relate to the use of the oven (see below) and represent waste material coming from the combustion chamber or fire tunnel. Five charred alder (Alnus glutinosa) seeds could have derived from the branches used as fuel in the oven.
Radiocarbon dates
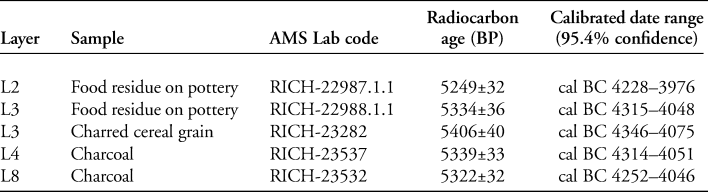
Five samples from different sediment layers and different types of organic material were selected for AMS radiocarbon dating (Figure 3 & Table 2). The dates all cluster between c. 4300 and 4000 cal BC, in accordance with the oldest-known Michelsberg Culture sites in the Scheldt Valley (Crombé & Vanmontfort Reference Crombé and Vanmontfort2007; Vanmontfort Reference Vanmontfort2007).
AMS 14C-determinations of samples from oven 9111/112, modelled in OxCal v.4.3.2, using the IntCal13 atmospheric calibration curve (Bronk Ramsey Reference Bronk Ramsey2009; Reimer et al. Reference Reimer2013) (table by D. Teetaert).

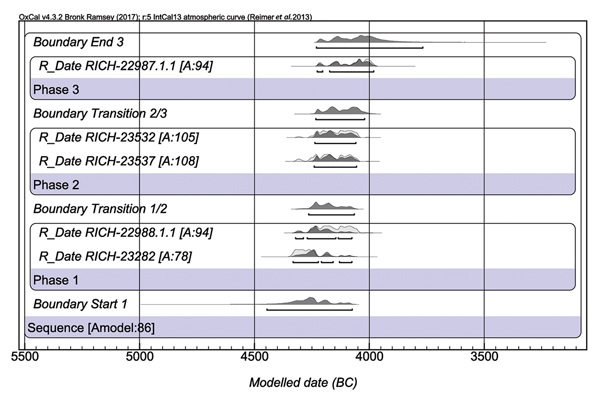
Figure 7 presents a Bayesian model of the radiocarbon data. Three distinct phases are suggested, which correspond with the stratigraphy of the dated sediment layers. The youngest phase (phase 3) is represented by the middle layer (L2) of the stokehole pit, which is interpreted as a sediment deposition (probably anthropogenic) post-dating the use of the oven. Two pottery fragments from L1 and L2 were cross-fitted, suggestive of infilling of the stokehole pit over a short time period. The middle phase (2) is represented by a charcoal-rich layer on top of the combustion floor (L8) and by the fill of the fire tunnel (L4). This phase could be related to the final use-period of the oven structure. The charcoal-rich bottom layer of the stokehole pit (L3) represents the oldest phase (1) and is probably related to the oven's main use-period. The charcoal inside this sediment layer may derive from the fire tunnel. We can also assume that the fire tunnel was cleaned out before or after each use. Furthermore, Petrasch (Reference Petrasch1986) refers to ethnographic contexts, in which glowing embers are removed from the fire tunnel when the combustion chamber reaches the desired temperature. In both situations, remains of the wood fuel could end up in the stoke pit. The charcoal-rich layer at the bottom of the stokehole pit is therefore interpreted as a mix of settlement waste (including pottery with food crusts, flint artefacts) and waste material from the fire tunnel (charred black alder seeds, charcoal and possibly the strike-a-light).
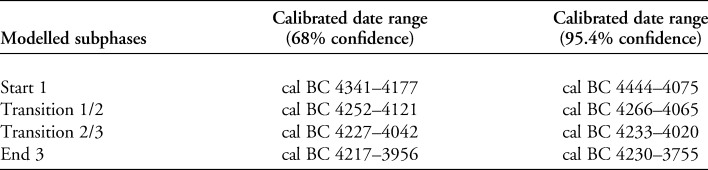
The charred cereal grains from the bottom layer of the stokehole pit (L3) are particularly significant. As with the pottery and lithic artefacts, they may have been deposited as settlement waste. They could, however, also represent waste material related to the operation of the oven. If, for example, the charred (overheated?) cereal grains were deposited together with the charcoal from inside the fire tunnel and combustion chamber, it may point towards the use of the oven to dry or roast cereal grains. Based on the Bayesian model (Figure 7 & Table 3), the duration of the oven's use can be estimated between a maximum of 425 and a minimum of 54 years (from the start of phase 1 to the transition between phases 2 and 3).
Bayesian model of the radiocarbon data, modelled in OxCal v.4.3.2, using the IntCal13 atmospheric calibration curve (Bronk Ramsey Reference Bronk Ramsey2009; Reimer et al. Reference Reimer2013) (figure by P. Crombé).

Calibrated date ranges (at 68 and 95.4 per cent confidence) for the subphases in Figure 7, modelled in OxCal v.4.3.2 using the IntCal13 atmospheric calibration curve (Bronk Ramsey Reference Bronk Ramsey2009; Reimer et al. Reference Reimer2013) (table by P. Crombé).

Discussion and conclusion
The discovery of a well-preserved single-chamber domed oven at Kortrijk represents a rare find from the Neolithic period in Western Europe, with only a few parallels known in northern France (Lepaumier & Morzadec Reference Lepaumier and Morzadec1998; Marcigny & Ghesquière Reference Marcigny and Ghesquière1998; Ghesquière et al. Reference Ghesquière, Marcigny and Lepaumier1999; Dron et al. Reference Dron, Seignac and Thomas2002; Hérard Reference Hérard2007; Hauzeur Reference Hauzeur2008; Samzun & Warmé Reference Samzun and Warmé2008; Hinguant Reference Hinguant2010; Coulon & Dupont Reference Coulon and Dupont2011; Naze Reference Naze2011). According to the terminology of Dron et al. (Reference Dron, Ghesquière, Marcigny and Frère-Sautot2003) and Gascó (Reference Gascó and Frère-Sautot2003), they are classified as ‘fours à fosse d'accès’. As with the oven at Kortrijk, these examples from northern France are characterised by a stokehole pit connected to a combustion chamber, although only a few are associated with a distinct fire tunnel (Dron et al. Reference Dron, Seignac and Thomas2002; Naze Reference Naze2011). Furthermore, most of these ovens are only preserved to a limited height; burnt loam walls are the only indication for the presence of a dome constructed over the combustion chamber. The best-preserved example, at Hébécrevon in Normandy, not only has curved (i.e. leaning inward) burnt loam walls, but also fragments of a collapsed dome (Ghesquière et al. Reference Ghesquière, Marcigny and Lepaumier1999: 532). Stone floors seem to be absent in the ovens from northern France; only the example at Crécy-sur-Serre, close to the Belgian border, has a floor of limestone and sandstone pieces inside the combustion chamber (Naze Reference Naze2011: 397). Its 1.2m-long fire tunnel is also very similar to that at Kortrijk. It is striking that this oven, which was constructed in the inner wall of an enclosure ditch, from which it was accessed, is also attributed to the Michelsberg Culture. The combustion chamber of a possibly domed oven of the Middle Neolithic Groupe de Chambon, at Ouzouer-le-Marché, has a floor consisting of more than 450 ceramic fragments (Hauzeur Reference Hauzeur2008: 48). These parallel features from sites in northern France all date to the end of the Early, or the Middle, Neolithic period, and are attributed to the VSG/Cerny (Samzun & Warmé Reference Samzun and Warmé2008), Groupe de Chambon (Hauzeur Reference Hauzeur2008), Cerny or Michelsberg Cultures, based on pottery finds or other associated artefacts.
Little is known about the precise function of these ovens. According to Petrasch (Reference Petrasch1986), domestic ovens may have been used for heating, drying and/or baking. Heating seems only plausible for ovens located inside houses. None of the domed ovens previously mentioned, however, are clearly associated with a house or group of houses; moreover, given their size, it is unlikely that their use was limited to a household level. Many authors have suggested that Neolithic ovens were used for drying cereal grains or baking bread (e.g. Petrasch Reference Petrasch1986; Dron et al. Reference Dron, Ghesquière, Marcigny and Frère-Sautot2003; Pavlů & Zápatocká Reference Pavlů and Zápatocká2013). Drying grains could improve storage life, while slightly roasting them could stop germination. Ten litres of sediment from the oven at Hébécrevon yielded 423 (fragments of) charred seeds, the majority of which were cereal grains (Ghesquière et al. Reference Ghesquière, Marcigny and Lepaumier1999: 540). At Kortrijk, the bottom layer of the stokehole pit also yielded cereal grains, but their connection with the oven's function is less clear. Although a function as a drying oven is probable, the stone floor of the Kortrijk and Crécy-sur-Serre ovens could indicate their use for the baking of bread or other types of food. It may be significant to note here that the presence of the so-called pottery discs or ‘plats à pain’—often interpreted as baking plates for bread (Lüning Reference Lüning1967: 63)—is associated with the same cultural groups that built these domed ovens (i.e. Cerny, Groupe de Chambon, Michelsberg, but also Chasséen). Such pottery discs were recovered from the oven at Hébécrevon and the enclosure ditch at Crécy-sur-Serre.
Finally, it is also possible that the Kortrijk oven was used as a pottery kiln. Tertiary clays (Kortrijk Formation) are easily accessible at the site, and the firing of pottery could explain the large dimensions of the combustion chamber. It is generally assumed that Neolithic pottery was fired in bonfires, but early examples of pottery kilns are known; for instance, from Thessaly in Greece (Krahtopoulou et al. Reference Krahtopoulou, Dimoula, Livarda and Saridaki2018). It is unlikely, however, that the oven from Kortrijk functioned as a pottery kiln, as a single construction phase is observed for the dome—multiple phases would be expected, due to removal of the dome after each firing in order to access the ceramics. Furthermore, there is a complete absence of ceramic production waste.
It is currently understood that domed ovens only appeared in North-western Europe after the LBK and are only known with certainty from fifth millennium cal BC contexts related to the Cerny (or Groupe de Chambon) and Michelsberg Cultures. It is unclear why domed ovens are not found at LBK sites in this region. This may be due to taphonomic factors: if LBK ovens were largely constructed above ground, they probably would not survive to the present day (Jeunesse & Lefranc Reference Jeunesse and Lefranc1999: 17). Conversely, the appearance of domed ovens could be explained by an adaptation to new environmental conditions by agro-pastoral communities as they expanded farther north-west during post-LBK times. The Michelsberg Culture in particular is known to have expanded onto less fertile sandy soils along the Atlantic coast—an area characterised by a marine climate with more continuous precipitation. This may have increased the need to dry cereal grains in order to ensure better storage, a tradition that persisted until at least the Early Middle Ages in the damp climate of North-western Europe (e.g. in Ireland (Kelly Reference Kelly2000; Long Reference Long, Stanley, Danaher and Eogan2009) using comparable tripartite kilns).
Finally, characteristics of these domed ovens, such as their larger dimensions compared to the LBK ovens and the fact that they have no obvious association with individual houses, might suggest a change in the socioeconomic organisation of the Neolithic societies from the level of individual households to a communal basis. Their appearance coincides with the development of bigger settlement and enclosure sites, indicating larger permanent or temporary aggregations of people, which may have demanded and facilitated new agrarian technologies and practices.
Acknowledgements
This research is a collaboration between Ghent University (Departments of Archaeology and Geology), BAAC Vlaanderen bvba, GATE bvba and the Royal Institute for Cultural Heritage. Part of this research was funded by The Research Foundation—Flanders (FWO)—and by the Special Research Fund (BOF) of Ghent University. We thank Sidonie Preiss of the Royal Institute of Natural Sciences in Brussels for helping with the identification of the cereal grains. We also thank Alasdair Whittle and an anonymous reviewer for reading the manuscript and suggesting improvements.