


Introduction
Under windless conditions, mass per unit horizontal area, vertical height and density of new snow accumulated on slopes are usually considered to be equal to those on a horizontal surface. It was found first by Reference Takahashi and Nogami.Takahashi and Nogami (1952) and confirmed by Reference Shidei.Shidei (1952) that the vertical height of new snow on a slope increases with slope angle and density decreases with slope angle, though the mass per unit horizontal area is nearly the same whether on a slope or on a horizontal surface. However, this result did not receive much attention and was forgotten. The dependence of height and density on slope angle is not only essential as basic knowledge but may also play an important part in avalanche formation. Hence, we re-investigated this dependence in a field experiment. Here, the results are shown and the causes arc explained.
Method of Field Experiment
In order to measure mass, vertical height and density of new snow on various slopes, we constructed six wooden slopes 90 cm long and 60 cm wide inclined at 0°, 15°, 30°, 45°, 60° and 75° on flat ground at the Tohkamachi Experiment Station. They were surrounded by a sheet 3 m high to reduce irregular accumulation of new snow due to strong winds or sunshine. Measurements of mass HNW per unit horizontal area and vertical height HN of new snow accumulating on the slopes during intervals of 3 to 24 hours were made using snow samplers and measuring rulers, cut so they were parallel to the slope when inserted vertically into the snow. Mean densities ρ of new snow were calculated by ρ = HNW/HN. This experiment was carried out during the winters of 1990–91,1991–92 and 1992–93 in Tohkamachi.
Results of Field Experiment
All masses HNW measured during the three winters were plotted against slope angle θ in Figure 1, where open circles connected by a solid line represent HNW of new snow accumulated on each slope during a measuring interval. Variations of HNW are small on slopes below 45° but decrease on slopes above 60°, because of sliding and rolling of snow particles.
Relation between mass HNW of new snow per unit horizontal area and slope angle θ.

If snow falls vertically under windless conditions and accumulates on a slope without slipping down, HNW should be independent of slope angle. In order Io study the dependence of height and density on slope angle, we needed to investigate new snow which had accumulated uniformly on a slope without the influence of wind, sunshine or sliding. We therefore selected cases where the ratio of HNW on a slope to that on a horizontal surface was within 100 ± 5%, and plotted densities ρ of new snow against slope angle θ. Figure 2 shows that the density ρ of new snow on a slope decreases as the slope increases. Consequently, the vertical height HN, being inversely proportional to density p for similar masses HNW, increases as the slope increases.
Relation between density ρ of new snow and slope angle θ.

Dependence of Height and Density on Slope
In Figures 3 and 4, vertical heights HNθ and densities ρθ of new snow on a slope of angle θ are plotted respectively against heights HN0 and densities ρ0 on a horizontal surface θ=0. These figures show that HNθ and ρθ respectively are well approximated by the following straight lines

Relation between vertical height HNθ of new snow on on a slope and height HN0 on a horizontal surface.

Relation between density ρθ of new snow on a slope and density ρ0 on a horizontal surface.

Here, the mean values of B obtained from the straight lines in Figures 3 and 4 are 0.975 for θ = 15°, 0.917 for θ = 30°, 0.804 for θ = 45° and 0.687 for θ = 60°. Then, plotting the obtained values of log B against log(cos θ), we obtained the following relation

with α= 0.57 for new snow accumulated during measuring intervals of 3–24 hours. The solid curve in Figure 5 is the plot of Equation (1), while open circles are the plots of B against θ. As shown in Figure 5, the values of B are well approximated by Equation (1).
Relation between the ratio ρθ/ρ0 and slope angle θ. Open circles are the values B obtained from straight lines in Figures 3 and 4; crosses mark the ratios ρθ/ρ0 for the 3–7 hour intervals; solid circles those for the 17–24 hour intervals. The solid curve is the plot of Equation (1); the broken curve a′ the plot of ρθ/ρ0 computed for α0= 0 over an interval of 7 hours; and broken curves a, b and c the plots of ρθ/ρ0 for α0 = 0, 0.3 and 0.5 over a 24 hour interval.

To investigate the influence of the length of the measuring interval, we plotted the ratios ρθ/ρ 0 obtained for each measuring interval against θ in Figure 5, where crosses are for the intervals of 3–7 hours; and solid circles are for those of 17–24 hours. Although the data for the intervals of 3–7 hours are few, most are distributed above the plot of Equation (1). That is, the value α for the short intervals of 3–7 hours, ranging from α = 0.2 to 0.5, is smaller than the value for those of 17–24 hours. Such an increase of α with the length of measuring interval suggests that the dependence of density on slope is caused partly by differences in snow densification on slopes.
Densification of Snow on Slopes
Studies based on viscous compression models to estimate the density profile of a snow cover have been conducted successfully by Reference Kojima. and Ōura.Kojima (1967), Reference EndoEndo (1992) and others. We computed densities of new snow on various slopes to compare with measured values, using the following empirical relation between compressive viscosity  and density ρ found for snow with a density range of between 40–300 kgm −3 by Reference Endo, Ohzeki and NiwanaEndo and others (1990):
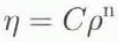
where  and
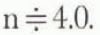 .
Now we consider a thin snow layer called i layer which is accumulated at time ti
, as shown in Figure 6. Let hi
(t) and ρi
(t) be vertical thickness and density of i layer at time t, and Wi
(t) be weight per unit horizontal area of snow lying on i layer at time t. Then, normal stress and shear stress exerted on i layer are respectively  and
 . The i layer is compressed in the normal direction by σ, and sheared parallel to the slope by τ which does not affect a thickness of i layer. If i layer is compressed by σ to have a thickness
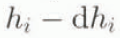 and a density
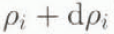 in a short time interval dt, a compressive strain rate
 in the direction normal to i layer is given by
 . As snow is a viscous compressive material, we assume that the relation between σ and
 is given by
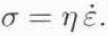 . Then, we have

Substituting Equation (2) into Equation (3) and integrating both sides after separating the variables, we have as an equation giving the time variation of snow density

where  is the snow density of i layer on a slope θ at time t,
 the initial density on a slope θ, and
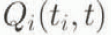 the time-integration of weight per unit horizontal area of snow lying on i layer from ti
to t:

where Wi (t) is a weight per unit horizontal area of snow lying on i layer at time t, dWs = q(ts )gdt s a weight of s layer accumulated from time ts to ts + dts , q(ts ) an accumulation rale at lime ts , and g is gravitational acceleration. Consequently, if hourly precipitation from time ti up to t is known, we can compute numerically the density ρi,θ of i layer on a slope θ at time t from Equations (4) and (5).
Model of a snow rover on a slope.

Since the vertical thickness hi,θ (t) layer on a slope θ at time t is given by q(ti )dti /ρi,θ (t), the vertical height HNθ of new snow accumulated on a slope θ from time ti to t is given by

and the mean density ρθ of the new snow on a slope θ becomes

Now consider a case that Qi (ti, t) satisfies the following condition:

Then, Equation (4) becomes

where ρi,0 (t) is a density of i layer on a horizontal surface θ = 0 at time t. If most new snow layers accumulated from time ti to t satisfy Equation (8), the ratio ρθ/ρ0 for the mean density of the snow is given by

This result indicates that the value of ρθ/ρ0 approaches Equation (9) unrelated to the initial snow density, as the measuring interval is long. Since the value n is about 4 according to Reference Endo, Ohzeki and NiwanaEndo and others (1990), Equation (9) is nearly equal to Equation (1) obtained for the measuring intervals of 3–24 hours. However, it is not certain whether our measurements satisfy Equation (8).
In order to study that relationship, we computed mean densities ρθ of new snow accumulated under constant rates on various slopes. In the computations, we assumed that the initial density ρinit,θ was related to the initial density ρinit,0 on a horizontal surface by

where α0 is α for the initial density, using the following values: qt(s ) = 10 kgm −2 h −1 (=1.0 mm water h−1), ρinit,0 = 50kg m−3, α0= 0, 0.3 and 0.5, time interval equals 7 and 24 hours. The computed ratios ρθ/ρ0 are shown by broken curves in Figure 5, where the curve a′ represents the relation for α0 = 0 over a 7 hour interval and the curves a, b and c represent relations for α0 = 0, 0.3, and 0.5 over an interval of 24 hours.
As shown in Figure 5, the observed data are best represented by the broken curves b and c for α0 = 0.3 and 0.5, and hence we can say that the observed difference of snow density due to slopes can be explained by the process of snow densification in cases where α0 ranges from 0.3 to 0.5. but not in cases where α0 = 0. When α0 = 0, the initial snow density just after accumulation docs not vary with slope angle.
Difference of Initial Snow Density Due to Slope
In order to investigate differences of initial snow density on various slopes, we measured densities of the surface snow lying up to 3 cm below the surface directly with a snow sampler, 3 cm high, 6 cm wide and 5.5 cm long. The results are shown by open circles in Figure 7, where the numeral in parentheses by the open circle shows the time which passed from accumulation of snow to its measurement. Figure 7 indicates that densities of new snow accumulated before 1 or 5 hours depend on slope angle; and the values of α range from 0.2 to 0.5. Such a dependence just after snow accumulation must be caused by the process of accumulation of snow crystals or snowflakes on the slopes.
Relation between the ratio ρθ/ρ0 and slope angle θ for the surface snow just after accumulation.

From these results, we can say that the dependence of snow density on slope angle originates in the process of both accumulation and densification of snow on the slopes; the value of α ranging from 0.2 to 0.5 for the initial snow densities just after accumulation, comes to about 0.56 for the mean densities of new snow accumulated during about 1 day. Theoretically, the value α is considered to approach  with n equal about 4, as the lapse of time is long enough to satisfy Equation (8).
Process of Snow Accumulation on Slopes
Here we discuss the dependence of initial snow density on slope angle. The shape of new snow can be classified into plate-like crystals such as plates and stellar crystals, needle-like crystals such as needles and columns and sphere-like crystals such as spatial dendrites and graupel. Accumulation of plate-like and needle-like crystals on slopes is considered to be different from that of sphere-like crystals. As shown in Figure 8, plate-like crystals tend to accumulate parallel to a slope under windless condition. Then, if we assume that all plate-like crystals (including needles) accumulate parallel to slopes, the relation between vertical height HNθ
and HN0
of new snow composed of plate-like crystals is given by  . On the other hand, sphere-like crystals are considered to accumulate on slopes at random unrelated to slope angle, HNθ
for sphere-like crystals is equal to HN0. Hence, dividing the height of new snow on a horizontal surface into two parts of plate-like and sphere-like crystals, and denoting a ratio of plate-like crystals to total height α′, we have the following equations as those giving the difference of height and density just after snow accumulation

Reference Takahashi and Nogami.Takahashi and Nogami (1951) observed snow crystals of about 10 pieces falling at 1000 h and 1600 h every day during the winter of 1950–51 in Tohkamachi. and showed that 38% of the crystals were plate-like including needle-like crystals. Though the ratio of plate-like crystals is high in number, the ratio α′ of those to the total height of new snow may be less than 0.1 because the thickness of plate-like crystals is much smaller than the diameter of sphere-like crystals.
Plate-like crystals accumulated parallel to a slope. Photo by Eizi Akitaya.

In Tohkamachi, snow falls as snow-flakes more than as individual snow crystals. Often large snowflakes fall horizontally through the air. Though snowflakes often break when landing on a slope, they and their fragments are considered to lie parallel to the slope by their rotation and shear deformation, as shown in Figure 9. When all snowflakcs lie on slopes by their rotation, the relation between HNθ
and HN0
is given by  . In the process of shear deformation, HNθ
is equal to HN0. Then, if the probability α′ of rotation on a slope is given, the dependence of height and density just after the accumulation is given by Equation (11). However, it is unknown whether rotation and shear deformation take place on a slope or not.
Supposed accumulation process of snowflakes by rotation and shear deformation.

The dependence of initial snow density on slope angle is considered to be caused by the accumulation processes of new snow as mentioned above.
Conclusions
We have confirmed that the vertical height of new snow on a slope increases with increasing slope angle and density decreases with slope angle. The weight of new snow per unit horizontal area does not vary much with slope. In addition, we have shown that the ratio of snow density on a slope to that on a horizontal surface can be expressed as a power function of the cosine of the slope angle and that such a dependence of snow density on slope angle is caused by the processes of both accumulation and densification of snow on the slope.



