Advances in modern scientific knowledge and understanding have resulted in enormous improvements in the quality of life for a growing proportion of the Earth's human populations. But this vision of continuous progress now faces radical challenges, because the very achievements of industrialisation are themselves threatening further advances, and are instrumental in causing new risks associated with unmitigated climate change. The central question for 21st-Century societies is whether we can turn our considerable scientific, cultural and technological knowledge and resources to the prevention of climate-related disasters, and to adaptation to the uncertainties of a complex and changing climate system.
Scotland's ambition to move to a low-carbon society has to be understood in a wider global context. The wellbeing of global populations is closely linked to the mitigation of climate change, demonstrating that climate change can no longer be regarded as a discrete ‘environmental problem’, but is fundamental to the way society works. Human security and prosperity depend on the inextricable connections between environment, economy and society. There is evidence that climate change can be mitigated by major reductions in carbon emissions from fossil fuels. This requires radical measures for energy saving, energy efficiency and moving rapidly towards renewable energy. All of these actions can drive a new global industrial revolution. Scotland is fortunate to be rich in renewable resources and the skills to develop them. This issue of EESTRSE is concerned with the actions needed for Scotland to participate in and benefit from this global revolution.
1. The impact of climate change
The risks posed by climate change are so large as to challenge the way humankind lives and exploits the planet's resources. Implementing the massive changes involved requires restructuring society and economy to prioritise low-carbon energy, zero waste consumption and industrial production based on recognition of finite natural resources. Thus it is critical to examine the dimensions of the challenge. In so doing we address the current failure of affluent societies to establish a consensual understanding of the seriousness of our situation and the urgency of change. In the world's richest country, the USA for example, 43% of the population believe that scientists are ‘evenly divided’ about evidence of climate change (World Bank Reference Werritty and Sugden2010). In the UK, lack of public conviction about the seriousness of the evidence meant that in January 2010, an Ipsos Mori poll showed that climate change was included in their top three concerns by only 17% of voters. Such beliefs feed in to a common perception that there is so much uncertainty about the science that actions to change our way of life can simply be delayed until the evidence is more certain. This level of public doubt about the credibility of the science is a major barrier to change.
The Climate Change 2007 report of the Intergovernmental Panel on Climate Change (IPCC) showed how global mean temperatures have been rising since the middle of the 20th Century (IPCC 2007a). There are strong theoretical and observational grounds for predicting that this trend brings regional changes in climate, with a greater likelihood of heat waves, heavy precipitation events and floods, an increase in the frequency and extent of drought, acidification of the oceans, melting of glaciers and an overall rise in global sea level (IPCC 2007c). Such changes have implications for water supply, ecosystems, food, health and coastal flooding, from which social, political and economic problems will rapidly escalate. Indeed, these are the basis of the UK's Chief Scientific Advisor's warning that we could face the ‘perfect storm’ when a series of climatically-induced events conspire to produce a global crisis in either energy, food or water or all three together, leading to regional starvation, migration and political instability (Beddington Reference Beddington2009).
Climate change is linked to depletion of the world's ecological resources, population increase and to economic growth based on fossil fuels and exploitation of forests, land and oceans. In 2000–2010, 13 million hectares of forest globally were converted to agriculture or other uses every year (FAO 2010). Biodiversity is declining at an unprecedented rate and the deadline set in 2002 by the UN to reduce the rate of loss of species by 2010 has been missed (Convention on Biological Diversity 2010). In addition, 10–20% of dry lands, mainly in the sub-Sahara and central Asia, have been degraded and millions of people are at risk from climate change (Millennium Ecosystem Assessment 2005). The fate of the oceans is a concern. Climate change, coastal development and over-fishing threaten marine biodiversity, as well as fisheries critical to food security and livelihoods. Warming and the increased acidification of the oceans threaten coral reefs and marine biodiversity. A move towards economic sustainability would help to mitigate the effects of climate change and place value on the global ecosystem that is fundamental to our human life-support system.
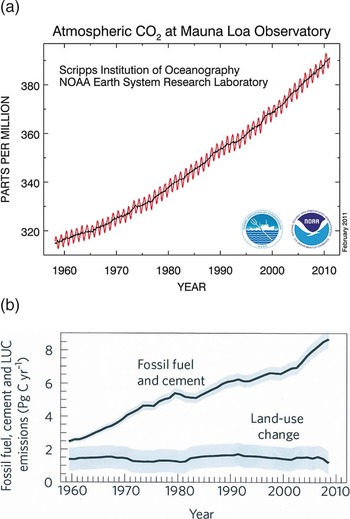
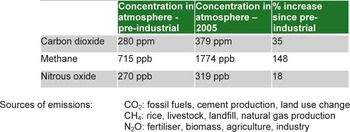
The rise in global mean temperatures since the middle of last century coincides with a rise in greenhouse gases in the atmosphere. The trend is clearly demonstrated by the rise in CO2 in the atmosphere as measured in Hawaii since the 1960s (Fig. 1a). The increase correlates with a rise in the production of CO2 from industry, the burning of fossil fuels and deforestation (Fig 1b). The main gases involved are shown in Figure 2, where they are compared to pre-industrial levels. For convenience, the various gases are referred to in terms of carbon dioxide equivalent (CO2e). In 2005, the average greenhouse gas pollution per person per year was 5.5 tCO2e, ranging from four times the average in high-income countries in North America and Australia, to twice the average in high-income Europe. Middle-income countries Brazil and Russia were between twice and three times the average, while China was around the average and India half the average (World Bank Reference Werritty and Sugden2010). The trend of the graphs in Figure 1 and the apparent increase in recent decades is a reflection of our exploitation of fossil fuels to power development around the world. But the trends in climate change and increasing pressure on ecological resources point to the risks of carrying on as usual.
The rise in atmospheric CO2 (parts per million) compared to the rise in CO2 produced by human activities: (a) The rise in CO2 as measured in Hawaii 1960–2010. Such an island location in the midst of the Pacific Ocean and distant from industrial activity is representative of global trends. The annual fluctuations, superimposed on the overall rise, reflect the seasonal fluctuations caused by vegetation growth in the land-dominated northern hemisphere; (b) The rise in emissions resulting from human activities 1960–2010, calculated from statistics of production and deforestation. PgCyr –1=One petagram=one Gigatonne (Gt). LUC=land use change.

The concentration of the main greenhouse gases in the atmosphere compared to pre-industrial times (ppm=parts per million; ppb=parts per billion). Greenhouse gases are conventionally expressed as equivalent amounts of CO2, where equivalent means having the same warming affect over 100 years. One ton of carbon-dioxide equivalent is abbreviated as 1tCO2e and one thousand million tons as 1GtCO2e.

There are two ways in which societies can respond to the challenge of climate change. One is to focus on adaptation. This recognises that the concentrations of CO2 already in the atmosphere are leading to changes in climate and that resources will need to be focused on making society resilient to such changes. Many of the immediate impacts are bearing on poorer countries, especially those in the arid subtropics, which are predicted to experience more droughts, and the low-lying, densely populated deltaic areas of south-east Asia, which are vulnerable to sea-level rise. There are impacts for Scotland (see Werritty & Sugden 2012, this volume) but these direct impacts are likely to be minor in comparison. There is a global inequality in that the richest countries, mostly lying in temperate mid latitudes, will be less affected in the short term by the need for adaptation than many poorer countries. But it is worth pointing out that even in affluent countries, climate change will cause disruption to ‘business as usual’ and carries social and economic costs, because of increasing risks from flooding, severe weather and damage to infrastructure, which in turn disrupts agriculture, transport and travel, production of goods and services and business operation. There are also ‘secondary’ impacts of climate change elsewhere, such as mass migration of climate refugees, political and social strife, breakdown of global trade on which rich countries rely for food and other commodities, as well as those high-carbon manufactured goods. Therefore adaptation will be needed by all.
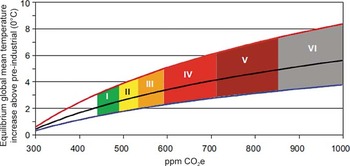
The second response is to focus on mitigation. Such an approach recognises the link between CO2 and rising global temperatures and aims to reduce the amount of CO2 added to the atmosphere as rapidly as possible. The pre-industrial level of CO2 concentrations in the atmosphere was 280 parts per million (ppm), while in 2010 it had risen to 389 ppm (NOAA 2010) with recent annual rises of ∼2 ppm (Fig. 1). At what level are we likely to be able to stabilise emissions? The nature of the risk is illustrated in Figure 3. A level of 550 ppm is likely to cause a best-estimate warming of nearly 3°C, but with an uncertainty that ranges from 2.4°C to 5.5°C. A level of 750 ppm is estimated to increase global temperatures by 4.3°C, with a range of uncertainty of 2.8–6.4°C. Such changes in global temperature would dramatically change the physical geography of the world. For perspective, these changes are approaching the magnitude of change that, in the opposite direction, brought us the last Ice Age and sea-level lowering of 120 m.
Predictions of the rate (black line) and uncertainty (red and blue lines) of global warming forced by rising concentrations of CO2e in the atmosphere. The categories I–VI represent forcing by scenarios of increased levels of greenhouse gases. The implication is that the average climate is likely to stabilise at a warmer level, but of course this does not take into account regional variations.

A long-term aim of stabilising levels around 400 ppm would be the safest option, since it brings levels close to both those of the present and the climatic envelope in which humans evolved. In Climate Change 2007, the IPCC recommended a 50–85% cut in global carbon emissions in order to maintain a level of 450 ppm in 2050 (IPCC 2007a). Bearing in mind the consistently rising trajectory of change, stabilising levels at 500 ppm is already a challenging prospect.
The distinction between adaptation and mitigation is attractive for policy makers concerned with short-term political priorities. However, there is a danger of using the distinction to delay actions to mitigate CO2 emissions, the fundamental requirement. Moreover, it overlooks the symmetry of actions needed for both. During the course of the Inquiry, it became clear that effective adaptation was achieved by building in resilience and this, in turn, was achieved by boosting local and regional actions to complement centralised national policies. Fortuitously, the moves towards renewable energy, using wind, waves and tides, and the need to reduce waste heat from buildings in order to reduce emissions, and changes to land use, are also best achieved at a local and regional scale. In other words, many actions needed to bring in resilience at a local scale also cut CO2 emissions and vice versa. The implication is that everything we do in our daily lives and planning for the future should prioritise the need to cut CO2 emissions.
2. Climate change and society
Climate change is intimately related to the issue of human wellbeing (or economic and social prosperity) as recognised over 20 years ago by Margaret Thatcher, then UK Prime Minister. In a speech to the United Nations on 8th November 1989, she argued:
“What we are now doing to the world, by degrading the land surfaces, by polluting the waters and by adding greenhouse gases to the atmosphere at an unprecedented rate – all this is new in the experience of the Earth. It is Mankind and his activities that are changing the environment of our planet in damaging and dangerous ways…. The evidence is there. The damage is being done. Every country will be affected and no one can opt out. Those countries who are industrialised must contribute more to help those who are not.”
The poorest nations are doubly disadvantaged since they were neither the cause of the problem nor do they have sufficient resources and economic resilience to deal with its impacts. As Archbishop Desmond Tutu suggested in a speech to the United Nations Development Programme in 2007:
“Of course, rich countries can use their vast financial and technological resources to protect themselves against climate change, at least in the short term – that is one of the privileges of wealth. But as climate change destroys livelihoods, displaces people and undermines entire social and economic systems, no country – however rich or powerful – will be immune to the consequences. In the long run, the problems of the poor will arrive at the doorstep of the wealthy, as the climate crisis gives way to despair, anger and collective security threats.”
The joint problems of social injustice and climate change need to be tackled together. Attempts to combat climate change without addressing problems of wellbeing will prevent the global collaboration and effort that will be necessary to lower CO2 concentrations. Alternatively, tackling global wellbeing without dealing with climate change will risk even more serious disruption and starker inequality as climate change bites.
The strength of the link between climate change and socio-economic wellbeing is important to emphasise. There has been a tendency among scientists, government, technical experts, politicians and business to regard climate change as an environmental problem, and this has left environmental organisations to take the lead in making the case for action. However, it is clear that the scale of the problem is such that it requires a change in the organisation of society, particularly in the way we use resources. After all, the effects of climate change depend on the response of society to the changes. And the responses of society will in turn shape the trajectories of climate change. The implication is that there is a broad cross-section of society, including faith, social and voluntary groups, that needs to be represented. This is encapsulated by Tony Kendle who wrote: “There are people who are vitally important for finding good solutions who currently are not engaged – George Marshall coined the term MINGO to represent the missing NGOs in the debate.” (Marshall Reference Mackay2007; Kendle Reference Jackson2010). A solution requires political leadership, including leading by example, and systematic, broadly-based public engagement, using and building on existing institutions of states, markets and civil society, from government bodies, through business and industrial associations to voluntary groups.
The Stern Review and A Blueprint for a safer planet mark a major step forwards in integrating the problem of climate change and global wellbeing (Stern 2007, Reference Stern2010). In common with the IPCC (IPCC 2007d), Stern makes the case for global action to move to a low-carbon society:
“It should now be clear that we understand enough of the science to see the magnitude of the risks and the scale of the action necessary to reduce them. We can recognise the technologies that can take us both to a more energy-efficient economy and to energy sources which are low-carbon, and we are constantly developing more. We can see how we can stop deforestation. Thus we understand the practicalities of what to do and how to do it; and, given how that understanding has deepened so quickly over the last few years, we can be confident we will learn much more, and reduce costs, along the way. We also understand the economic policies that can deliver the necessary action in an effective, efficient and equitable way. The costs of the necessary actions are acceptable and manageable in relation to the reduction in risks they bring.” (Stern Reference Stern2010, pp. 207–8)
The crux is to recognise that the rich countries have prospered because they have undervalued the cost of burning fossil fuels since the Industrial Revolution. It follows that one way forward is to restrict the use, and/or raise the cost, of fossil fuels whilst investing strongly in energy efficiency and renewable energy. The use of economic mechanisms such as carbon quotas and trading is one way of encouraging the flow of funds from rich to poorer countries. The cost of carbon must include not only direct emissions but also those embedded in imported goods, again facilitating a trans-national flow of funds.
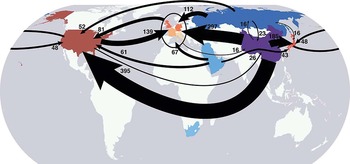
This latter point is of crucial importance, since the magnitude and direction of flows of embedded carbon into rich countries are striking and some account of these is essential to a long-standing solution (Peters et al. 2011; Fig. 4). In the case of Scotland in the years 1995–2004, territorial emissions reduced by 13%, while consumer emissions grew by 11% over the same period (Barrett Reference Barrett2009). An effective strategy for moving from fossil to renewable fuels, including additional investment in adaptation in poorer countries, might involve investment by rich countries of ∼2% of GDP. Stern (Reference Stern2010) notes that this investment in climate security is far less than that in defence security for most rich countries. The UK Committee on Climate Change (Reference Stern2008) suggested that reducing all greenhouse gases (including aviation) by up to 42% by 2020 would cost less than 1% of national GDP.
The flow of embedded carbon (Mt CO2/yr) incorporated in imported goods. The scale of the flow to the USA and Europe is striking and a measure of how much the richest countries have exported their CO2 emissions to other countries.

2.1. A new industrial revolution
The investment in energy saving, energy efficiency and energy with no emissions is nothing short of a new industrial revolution, with significant advantages for both the developed and developing world. In 2010, the low-carbon market worldwide was already worth £3 trillion and forecast to grow at around 4% per year. Energy efficiency brings immediate and short-term gains in reducing carbon, reducing waste, saving costs and providing employment. Renewable energy can substitute for fossil fuels over decades and has widespread potential in most countries, with the particular advantage that it can provide localised power in countries with and without centralised electricity grids. As an example, the opportunities and scale of development of wind turbines is remarkable. As Connie Hedegaard, European Commissioner for Climate Action reflected:
“I come from a country (Denmark) where it took 30 years to build a world brand in wind; ten years ago China did not have one wind manufacturer; today they have three in the global top 10, They say themselves that they will have two in the global top 5 within 5 years. In less than ten years they came from zero to 50% of the global market.”.
(EU Atomium Culture 2010)Investment provides the economic growth with which poorer countries have the potential to raise their standard of living. Countries can play to their advantages and, as has happened with the way mobile phones have substituted for land lines in parts of the world, it should be possible for countries to leapfrog fossil fuels and yet grow effectively. Reliance on energy saving, energy efficiency and renewables will result in a cleaner, healthier, biologically more diverse environment. Moreover, the activities tend to be labour-intensive and thus, in those countries experiencing recession, are a cost-effective way of introducing stimulus spending.
In the next few decades, fossil fuels will remain the dominant source of energy worldwide, accounting for 77% of the overall increase in energy demand in 2007–2030 (oil 24%; coal 53%; gas 42%) (International Energy Agency Reference Hansen2009). This points to the importance of developing and employing carbon capture and storage (CCS) which is thought to have the potential to reduce these fossil fuel emissions by 10–14%.
2.2. Sustainability
How sustainable is the emphasis on economic growth in a planet with finite limits on resources? Assuming a global population stabilises at nine billion, with a standard of living equivalent to that in the OECD nations, the world's economy would need to grow by 15 times by 2050 and by 40 times by the end of the century (Jackson 2009). This is an issue much debated in professional circles and there is recognition that the ‘business as usual’ model of economic growth is part of the problem (Porrit Reference Porritt2007, Reference Porritt2009). The issue was also of concern among the public we met during the course of the Inquiry. Many of the latter were concerned about the viability of our current rich-country lifestyle and the overwhelming emphasis on growth, especially prominent as a means of kick starting the economy since the financial crisis of 2008. In Prosperity without Growth?, Jackson (2009) suggested that, above a certain threshold, there is little correlation between income and ‘happiness’ and that we should also include as a measure of prosperity such factors as health, family, relationships and trust in the community.
“For at the end of the day, prosperity goes beyond fleeting material pleasures…. It resides in the quality of our lives and in the health and happiness of our families. It is present in the strength of our relationships and our trust in the community. It is evidenced by our satisfaction at work and our sense of shared meaning and purpose. It hangs on our potential to participate fully in the life of society. Prosperity consists in our ability to flourish as human beings – within the ecological limits of a finite planet.”
(Jackson 2009, p. 102)An implication is that the richer world could consume less whilst still improving prosperity in this wider sense.
Such an outcome would require radical changes in outlook, governance and our respect for ecological limits. In this vein, in 2010 it was encouraging to hear from Professor Jacqueline McGlade, Executive Director of the European Environment Agency, about ways in which the progress of states towards sustainable economies will be measured and monitored (J. McGlade pers. comm. 2011). It is significant that future environmental legislation will require states to report on five indicators of environmental quality and societal well being: in addition to GDP, there will be analyses of resource efficiency (including water, natural capital, forests, agriculture and biodiversity, and environmental clean technologies), greenhouse gas emissions, poverty, and employment. This agenda closely matches the vision of a low-carbon Scotland in that it integrates environmental, social and economic affairs.
The debates outlined above confront fundamental problems about the economic organisation of modern societies and the functioning and regulation of markets, but they have in common one optimistic view. It is that there is a way forward that can cut carbon emissions whilst at the same time improving the wellbeing of peoples around the world. The implication is that all countries will need to play a role. Moreover, the sooner we make substantive changes the easier the task and the less the cost, since every delay means that we start with a higher concentration of CO2 in the atmosphere and the task becomes ever more challenging.
3. The human response and the Scottish context
During the course of the Inquiry, the Committee often heard the much-debated argument that, given the uncertainty, we can afford to wait before taking action. But the converse argument is stronger. It is because of the uncertainty, and because of the magnitude of the risk affecting the future of the planet, that it is more important than ever to act quickly. This precautionary principle is one well known to the insurance industry. Mackay (Reference Le Quéré, Raupach, Canadell, Marland, Bopp, Ciais, Conway, Doney, Feely, Foster, Friedlingstein, Gurney, Houghton, House, Huntingford, Levy, Lomas, Majkut, Metzl, Ometto, Peters, Prentice, Randerson, Running, Sarmiento, Schuster, Sitch, Takahashi, Viovy, van der Werf and Woodward2009), Chief Scientific Advisor, DECC, compares it to riding a fast motorbike in the fog near a cliff edge without a map. He writes “would the lack of a map justify not slowing down?” (Mackay Reference Le Quéré, Raupach, Canadell, Marland, Bopp, Ciais, Conway, Doney, Feely, Foster, Friedlingstein, Gurney, Houghton, House, Huntingford, Levy, Lomas, Majkut, Metzl, Ometto, Peters, Prentice, Randerson, Running, Sarmiento, Schuster, Sitch, Takahashi, Viovy, van der Werf and Woodward2009, p. 11).
During the 18-month course of the Inquiry, there was a remarkable shift in the debate. We began in an atmosphere of optimism in October 2009, before the UN meeting in Copenhagen in December 2009. There was the public disappointment at the limited progress at the meeting, scepticism about the science of climate change, subsequent restoration of its importance in the summer of 2010, and now we are aspiring to create a new industrial revolution. Commitments at the UN Canćun meeting of 2010 suggest that many countries (and states within the US) are beginning to implement the low-carbon agenda, even while there is no binding international treaty. In retrospect, Copenhagen may have marked the moment when the countries of the world bought into the seriousness of the problem. Perhaps a step change has occurred. As Connie Hedegaard, European Commissioner for Climate Action wrote: “But many leaders realise that only the regions that would become the most energy efficient and most resource efficient will be best suited to take markets, to create jobs, to have sound economics in the future. I think that is one thing that has changed quite a bit.” (EU Atomium Culture 2010)
4. Why Scotland should act
A common question during the course of the Inquiry was: How can a small country like Scotland make a difference to such a big global problem? In a sense, the question has been overtaken by events, in that it should be reworded in terms of: How can Scotland use the opportunity? Nevertheless, it is useful to respond to the original question and there are three responses to such questions: ethical, practical and visionary.
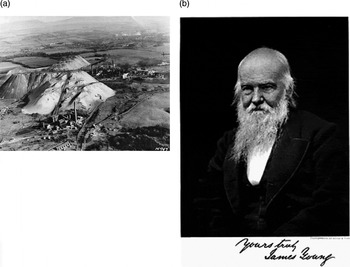
The ethical point is that everyone on Earth shares the same atmosphere and we in Scotland and the UK have helped cause the rise in CO2. Indeed, the UK has been estimated to have produced more CO2 emissions per person in the years 1751–2008 than any other country (Hansen 2009). The UK's contribution of over 300 tonnes of carbon per person is marginally above, or similar to, that of the USA. Scotland can lay claim to a further contribution in that James “Paraffin” Young (1811–1883) created the oil-shale petroleum industry, marked today only by the remain of conical hills (bings) of waste material in the central lowlands of Scotland (Fig. 5).
(a) The Pumpherston shale-oil works in 1941. The shales in the central lowlands of Scotland were mined and processed to produce diesel oil/paraffin, the beginnings of the global petroleum industry. (b) James (Paraffin) Young, chemist, entrepreneur and Fellow of the Royal Society of Edinburgh.

The practical point is that no country will be immune to the natural, social and economic problems caused or aggravated by climate change. Rises in sea level, droughts, floods and storms will affect food and energy supply and prices, increase migration and add to political tensions. The eruption of Eyjafjällajøkull in Iceland in April 2010, although not climatic in origin, was a dramatic illustration of how a relatively minor local event had an immediate and widespread effect on global activity. If much larger events associated with climate change such as, for example, the Indus floods of 2010 or the Queensland floods of 2010/11, increase in frequency, we can look forward to a century of increased disturbance and cost.
The visionary point is that a new industrial revolution could power a richer, more equal and sustainable world. Scotland is blessed with abundant renewables and located close to the populated heartlands of Europe. It has 25% of Europe's wind and tidal resource and 10% of Europe's potential for wave power (Scottish Government Reference Porritt2010). Given this optimal location and the high concentration of research institutions, surely we could be among the early movers in the new renewables industrial revolution? We are late in the terrestrial wind market, but the offshore wind, wave and tidal energy markets beckon. In addition, carbon capture and its storage in former oil and gas fields offers potential not only as a repository for carbon extracted from coal-fired power stations in Europe, but also as a possible long-term technology with global reach. Altogether, Scotland's low-carbon market was worth £8.5 billion in 2007–08 and is forecast to rise to around £12 billion by 2015–16 (Scottish Government Reference Porritt2010).
Scotland can also learn from northern Europe the lessons of more efficient ways of heating and cooling buildings, combining heat networks with flexible sources of heat and high standards of buildings insulation, to increase local, sustainable employment and affordable heating.
5. Current UK/Scottish policy framework
The UK Government has set a 2050 target of reducing emissions of all Kyoto greenhouse gases by 80% compared to 1990 levels. The Committee on Climate Change was set up as an independent statutory body under the Climate Change Act (2008) to advise UK and devolved administration governments on setting and meeting carbon budgets and preparing for climate change. The Committee is required to report annually to Parliament on progress in meeting targets. The Fourth Carbon Budget, dealing with emissions budgets in the 2020s, was published in December 2010. (UK Committee on Climate Change 2010a). The Committee's advice is that it is necessary to accelerate the pace of change – and introduce new policies – if the UK is to meet its carbon budget in the 2020s and hit its 2050 target.
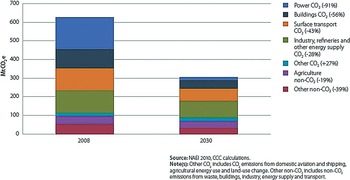
The gist of the Committee's advice is that it is necessary to largely decarbonise electricity production by 2030, whilst at the same time meeting increased demand for electricity in the transport and heating sectors, in order to put the UK on a low-carbon trajectory. Drawing on what is technically and economically feasible, the Committee outlines scenarios in which different sectors deliver different emission reductions by 2030 (Fig. 6). The largest emission reductions are required in the power generation sector (over 90%), with over 50% emission reductions from buildings, over 40% from surface transport and nearly 30% from industry. Energy generation, the sector with the most challenging targets, is a reserved UK responsibility. The Inquiry was advised by officials at DECC that the virtual decarbonisation of electricity generation by 2030 required the UK to invest on a massive scale in three technologies, namely renewables, nuclear power and carbon capture and storage (CCS). A message permeating the last Committee report is that the sooner we make serious cuts in the power generation sector, the easier it will be to meet the emission targets in 2050.
Possible cuts in emissions by sector to be achieved in 2030 en route to the 2050 reduction targets. The different levels of reduction in different sectors reflects what is most feasible.

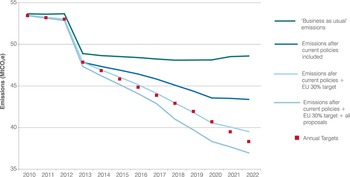
Scotland has legislation with clear targets for cutting greenhouse gas emissions by 42% by 2020 (Fig 7). The latest emissions inventory for Scotland provides data for the production of greenhouse gases from Scottish territory over the period 1990–2009. These data suggest total net greenhouse gas emissions (including aviation and shipping) of 51.0 MtCO2e in 2009, a 7% reduction on 2008 figures and a 28.9% reduction from 1990 levels (Scottish Government 2011a). This reduction in net emissions from 1990 reflects the overall outcome of different actions over 20 years, namely the reduction in carbon dioxide emissions from the closure of industry and steelworks such as Ravenscraig, from the increased sequestration from forests planted in previous decades, and from emission reductions from more energy efficient households. Reductions have been partially offset by rising emissions from road transport and power generation activities. The recession of 2008/09 is also expected to have had a tangible effect on emissions.
The CO2e emissions targets to 2022 arising from the Climate Change (Scotland) Act 2009.

Several reservations emerge about these Scottish intentions. The first is that in the absence of the EU moving to a policy of reducing emissions by 30% relative to 1990 levels, the current policies specified in the statutory report on how Scotland will deliver its targets (Scottish Government Reference Porritt2011b) only just achieve the necessary reduction in emissions of 42% by 2020. This leaves little room for manoeuvre unless new – and potentially unpopular – policies are introduced. A second reservation is that evidence from previous emission projections suggests that governments are typically over-optimistic about the abatement potential and underplay the likelihood of baseline emissions rising by more than expected (Kerr et al. Reference Kendle2003). The third is that slow progress has been made on potential emission reductions that lie within the powers of the Scottish Government, for example in transport and residential heating. Indeed, it has been difficult to achieve change even when, as in the case of heating, household energy efficiency could save consumers a cumulative £8.5 billion on their fuel bills (Scottish Government Reference Porritt2011b).
The conclusion that meeting the targets is possible, but will be hugely challenging to achieve, is confirmed by a report of the UK Committee on Climate Change (2010b) in response to advice sought by the Scottish Government. The report notes that Scottish targets are higher than those for the UK as a whole and, unlike the UK, have the added burden of including emissions from international aviation and shipping, not being conditional to the EU agreeing to higher targets as part of an international agreement, and setting annual targets which reduces flexibility. The overall conclusion of the Committee on Climate Change is that there is scope for tighter controls on emissions from the non-traded sector, within the control of the Scottish Government. The report recommends “strengthening of existing policies to drive the required step change in reducing emissions from buildings, transport, electricity, agriculture and waste. Given a new policy framework, the opportunities are there for the Scottish people and businesses to drive down emissions and build a low-carbon economy.”
It is important to realise that this focus on production emissions ignores the embodied carbon (‘consumption emissions’) imported to Scotland, for example in services or goods manufactured or supplied from outside the country (Fig. 4). There are ongoing efforts to measure emissions from ‘consumption’ in the UK and Scotland, but it remains a complex task. Nonetheless the take-home message is that emissions from the consumption of goods and services in Scotland and the UK has risen since 1990, despite the encouraging fall in emissions from activities within the country (Scottish Government Reference Porritt2010).
6. Conclusion
The purpose of this paper is to place the Scottish scene in a wider context. Globally, and especially in Europe, there is a growing realisation that for reasons of climatic change, and on social, economic and security grounds, it makes sense to develop renewable energy and use resources more efficiently. Scotland is well endowed with renewable energy and also storage sites for waste CO2. The opportunities to invest in local energy generation, the need to improve the quality and heating of the housing stock, and the potential to change land use, present an economic and social opportunity for communities throughout Scotland. There is a prospect of a more prosperous, fulfilling and socially equitable society moving in the direction of the long-term goal of greater sustainability. The rest of this Special Issue surveys the climatic, economic, social and land-use factors underpinning such a change for society and identifies some of the practical and behavioural barriers that make change difficult to achieve.