Introduction
The regular sour orange (Citrus aurantium L.) is the progeny of hybridization between mandarin (C. reticulata Blanco) and pummelo (C. Citrus maxima (Burm.) Merr) (Wu et al., Reference Wu, Prochnik, Jenkins, Salse, Hellsten, Murat, Perrier, Ruiz, Scalabrin, Terol, Takita, Labadie, Poulain, Couloux, Jabbari, Cattonaro, Fabbro, Pinosio, Zuccolo, Chapman, Grimwood, Tadeo, Estornell, Muñoz-Sanz, Ibanez, Herrero-Ortega, Aleza, Pérez-Pérez, Ramón, Brunel, Luro, Chen, Farmerie, Desany, Kodira, Mohiuddin, Harkins, Fredrikson, Burns, Lomsadze, Borodovsky, Reforgiato, Freitas-Astúa, Quetier, Navarro, Roose, Wincker, Schmutz, Morgante, Machado, Talon, Jaillon, Ollitrault, Gmitter and Rokhsar2014).
The Citrus aurantium tree has a height of 6 to 9 m. This tree has long thorns that are not very sharp. The leaves have a medium size of 5 to 15 cm in length and 3 to 7 cm in width and are observed in oval-rectangular shapes. The leaves may be seen in a blunt or short pointed shape, or in a sinusoidal or congressional shape (Mozaffarian, Reference Mozaffarian2003). The petioles are relatively wide, which are winged and egg-shaped in the upper part. The flowers (with the term orange spring) are white and very fragrant and have tuberous fleshy petals. The flowers are single or multiple (cluster) axial, which are medium in size. Flags are 20 or more. The ovary is spherical-shaped and its fruit is usually 7 to 8 cm in diameter, its shape is almost spherical and slightly flat at both ends, the inner parts of the fruit are 10 to 12 houses and hollow in the middle axis. is, the skin of the fruit has an uneven and thick surface. The ripe fruit has a red-orange color, which has many seeds, and its taste is sour and bitter. The flowering period of orange is in March and April and its fruits ripen in October and November (Joharchi 1387).
There is extensive taxonomical debate on classifications of sour orange, ranging from phenotypic Tanaka's classification (Reference Tanaka1977) which distinguished several sour orange species, to Swingle et al. (Reference Swingle, Reece, Reuther, Webber and Batchelor1967) who considered only one group of C. aurantium, and recently, proposed classification based on phylogenetic data which considers the regular sour orange as C. × aurantium var. aurantium (Ollitrault et al., Reference Ollitrault, Curk, Krueger, Talon, Caruso and Gmitter2020; Ferrer et al., Reference Ferrer, Costantin, Paoli, Paymal, Quinton, Ollitrault, Tomi and Luro2021).
In general, the phenotypic diversity within sour oranges is mainly due to fruit, leaf morphology, leaf proteins and also by the pulp sweetness and acidity (see for example, Gogorcena and Ortiz, Reference Gogorcena and Ortiz1989, Reference Gogorcena and Ortiz1993; Luro et al., Reference Luro, Gatto, Costantino and Pailly2011). Similarly, several genetic diversity studies have been performed in sour orange cultivars by utilizing different molecular markers, which mostly concluded that the inter-varietal polymorphism ranged from null to very low with few instances of high genetic polymorphism (see for example, Luro et al., Reference Luro, Rist and Ollitrault2001; Siragusa et al., Reference Siragusa, De Pasquale, Abbate and Tusa2006; Polat et al., Reference Polat, Kaçar, Yesiloglu, Uzun, Tuzcu, Gulsen, Incesu, Kafa, Turgutoglu and Anil2012)
Sour orange is cultivated in three provinces of Gilan, Mazandaran and Fars in Iran. In spite of extensive cultivation of this edible and medicinally valued plant species in the country, we did not find any report on population genetics investigation merely on this species. However, there are few reports on genetic variability of Citrus species including sample of sour orange among them (see for example, Jannati et al., Reference Jannati, Fotouhi, Pourjan Abad and Salehi2009). Therefore, the present study was performed with the following objectives: 1- To investigate genetic variability within Citrus aurantium populations of the country by using SCoT molecular markers, 2- To produce data on genetic structure of these populations, and 3- evaluate the potential adaptive value of SCoT loci with geographical variables. In addition to the existing diversity in the classification of plants, the calculations related to the study of phylogenetic diversity provide an important point of view in. It provides a link to biodiversity and should be considered in order to determine conservation priorities. In other words, to document molecular and species richness, phylogenetic diversity is needed. In addition, the use of a standard molecular marker as a DNA barcode is useful for species identification and taxonomic revision (Nitta et al., Reference Nitta, Ebihara and Smith2020). Therefore, one of the goals and questions of the present research is to investigate the biodiversity of the mentioned species in Iran by means of appropriate molecular markers in order to provide a clear picture of the molecular richness of a species that has been less studied in Iran.
Material and methods
Plant materials
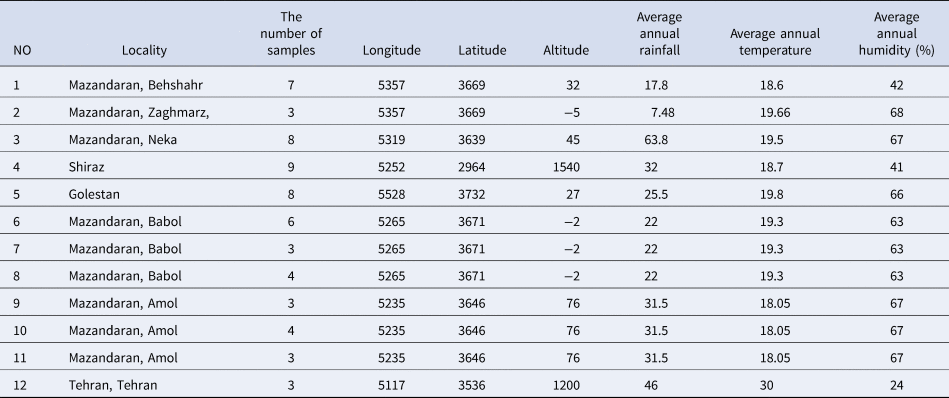
Extensive field investigations and collections were under taken during 2020–2021. 61 specimens of 12 populations, were collected from different geographic and identified (Table 1) (Mozaffarian, Reference Mozaffarian2003). All the samples were the result of seedling growth (seed growth).
Populations studied, their locality and ecological features

Scot assay
Fresh leaves were put to dry in silica gel powder. Cetyltrimethyl-ammonium bromide -activated charcoal protocol (CTAB) was applied to extract the genomic DNA. The extraction was done by activating charcoal and poly vinyl polypyrrolidone (PVPP) for binding of polyphenolics during extraction; for mild extraction and precipitation conditions, the high-molecular weight DNA isolation was boosted without the interference of impurities. The extracted DNA was examined in terms of quality and quantity by running on 0.8% agarose (Križman et al., Reference Križman, Jakše, Baričevič, Javornik and Prošek2006).
Three primers (SCOT1, SCOT2, SCOT36, and SCOT41) based on Collard and Mackill (Reference Collard and Mackill2009) were selected (Collard and Mackill, Reference Collard and Mackill2009). These primer sequences are: SCoT1: CAACAATGGCTACCACCA, SCoT2: CAACAATGGCTACCACCC, and SCoT41: CAATGGCTACCACTGACA.
PCR reaction mixture with total volume of 25 μl contained 10 mM Tris-HCl buffer (pH = 8), 50 mM KCl, 1.5 mM MgCl2, 0.2 mM of dNTP (Bioron, Germany), 0.2 μM of primer, 20 ng genomic DNA and 1U of Taq DNA polymerase (Bioron, Germany).
The amplification reactions were performed in Techne thermocycler (Germany) with the following program: 4 min at 94°C, 40 cycles of 1 min at 94°C, 1 min at 47–52°C (SCOT1 47°C, SCOT2 49°C, SCOT41 52°C) and 1 min at 72°C and a final cycle of 7 min at 72°C. The amplification products were visualized by running on 2% agarose gel, stained with sybr green (Powerload, Kosar Co. Iran). The fragment size was estimated by using a 100 bp molecular size ladder (Fermentas, Germany).
Data analysis
SCoT loci evaluation
The SCoT bands obtained were coded as binary characters (1 = present, 0 = absent, Podani, Reference Podani2000) and used for further analyses. DCA (Dentrented correspondence analysis) was used to evaluate suitability of SCoT bands obtained for genetic analysis. Discriminant power of SCoT bands was determined by Neis' Gst value as implemented in POPGENE ver. 3., and DAPC (Discriminant analysis of principal components) method which is appropriate for binary data (Jombart et al., Reference Jombart, Devillard and Balloux2010), as performed in R package 4.1.
Genetic diversity analyses
Genetic diversity parameters were estimated by GeneAlex 4.2 (Peakall and Smouse, Reference Peakall and Smouse2006). These are the number of effective alleles (Ne), Shannon index (I), Nei's genetic diversity (He), unbiased He (UHe), and percentage of polymorphism (P%), were determined for the studied sour orange populations.
Populations' genetic differentiation
Genetic differentiation of the studied populations was studied by two different approaches. First, we used UPGMA (Unweighted Paired Group using average) cluster analysis to show if the replicates of each population is separated from the others. Second, we performed AMOVA (Analysis of molecular variance), as implemented in GeneAlex 4.2 software. The Neis' genetic distance was also being determined among these genotypes.
Grouping of the populations
Grouping of the studied sour orange was performed by DAPC and MDS (Multidimensional scaling) methods based on Jaccard similarity index. These analyses were carried out in R 4.1., and PAST ver. 4 (Hammer et al., Reference Hammer, Harper and Ryan2012). We also identified discriminating SCoT loci which differentiate populations studied by DAPC analysis and performed assignment test to illustrate gene flow among the studied sour orange populations.
Potential adaptive SCoT loci
To study association of Scot loci and geographical variables we used three different computational approaches as they are based on different assumptions and may produce somewhat different results. We used CCA (Canonical correspondence analysis), RDA (Redundency analysis), and LFMM (Latenet factor mixed model). For all these analysis significant tests were applied too.
CCA is based on regression of the SNPs and ecological features. It uses an approach similar to principal components analysis (PCA), but it is utilized for discrete characteristics like SNPs (Podani, Reference Podani2000). This method differs from PCA in the way that, PCA tries to maximize the variance of data in a reduced space, while CCA tries to maximize the association of data (SNPS), to geographical and ecological features studied. CCA was performed in PAST ver. 4 program.
Redundancy analysis (RDA), is a constrained ordination method and is based on multivariate regression, and models linear combinations of the environmental predictors that explain linear combinations of the SNPs (Legendre and Legendre, Reference Legendre and Legendre2012). RDA was performed in PAST ver. 4, program.
LFMM is a method for testing associations between loci and environmental gradients using latent factor mixed models. LFMM implements MCMC algorithm for regression analysis in which the confounding variables are modeled with unobserved (latent) factors. The program estimates correlations between environmental variables and allelic frequencies, and simultaneously infers the background levels of population structure (Frichot et al., Reference Frichot, Schoville, Bouchard and Francßois2013; Frichot and Francois, Reference Frichot and Francois2015). LFMM was performed by LFMM package in R. 4.2.
Results
In total 33 SCoT bands were obtained in 61 sour orange plants studied (online Supplementary Fig. S1). The number of bands varied from 18 in populations 2 and 12, to 25 in population 1. One to two private (distinct) band were observed in populations 1 and 5 (online Supplementary Table S1).
DCA plot of SCoT band showed a well-scattered pattern of bands throughout the plot. This shows that SCoT bands are not linked and represent different parts of the genome and therefore are a suitable molecular marker for population genetic analyses in sour orange.
Discriminating power of ScoT loci
In the first attempt we estimated Neis' Gst vs number of migration (Nm) parameter as a measure of SCoT loci discriminating power. Some of SCoT loci had Gst value > 0.70, and may be considered as distinguishing loci among the studied sour orange populations.
In the next analysis, discriminating power of SCoT bands was investigated by LDA (Fig. 1). Almost the same loci with higher Gst value were identified as distinguishing SCoT loci among sour orange populations. Moreover, this plot shows that SCoT loci 2, 9, 25, 26, and 31, differentiate populations 2, 4, and 9, from the others. Similarly, SCoT loci 20 and 23, with Gst > 0.80, differentiate population 5 from the other studied populations. These results indicate the efficiency of SCoT bands for genetic fingerprinting of sour oranges germplasm.
LDA plot showing SCoT loci which differentiate sour orange populations from each other (populations 1–12 are according to Table 1).

Genetic diversity analyses
The genetic diversity parameters determined in sour orange populations. The within population genetic variability ranged from about 3 to 39%, which indicates a low to moderate genetic diversity of sour orange plants in the country. A low value for gene diversity (He) and Shannon information index (I), also are in agreement with polymorphism percentage.
Genetic distinctness of sour orange populations
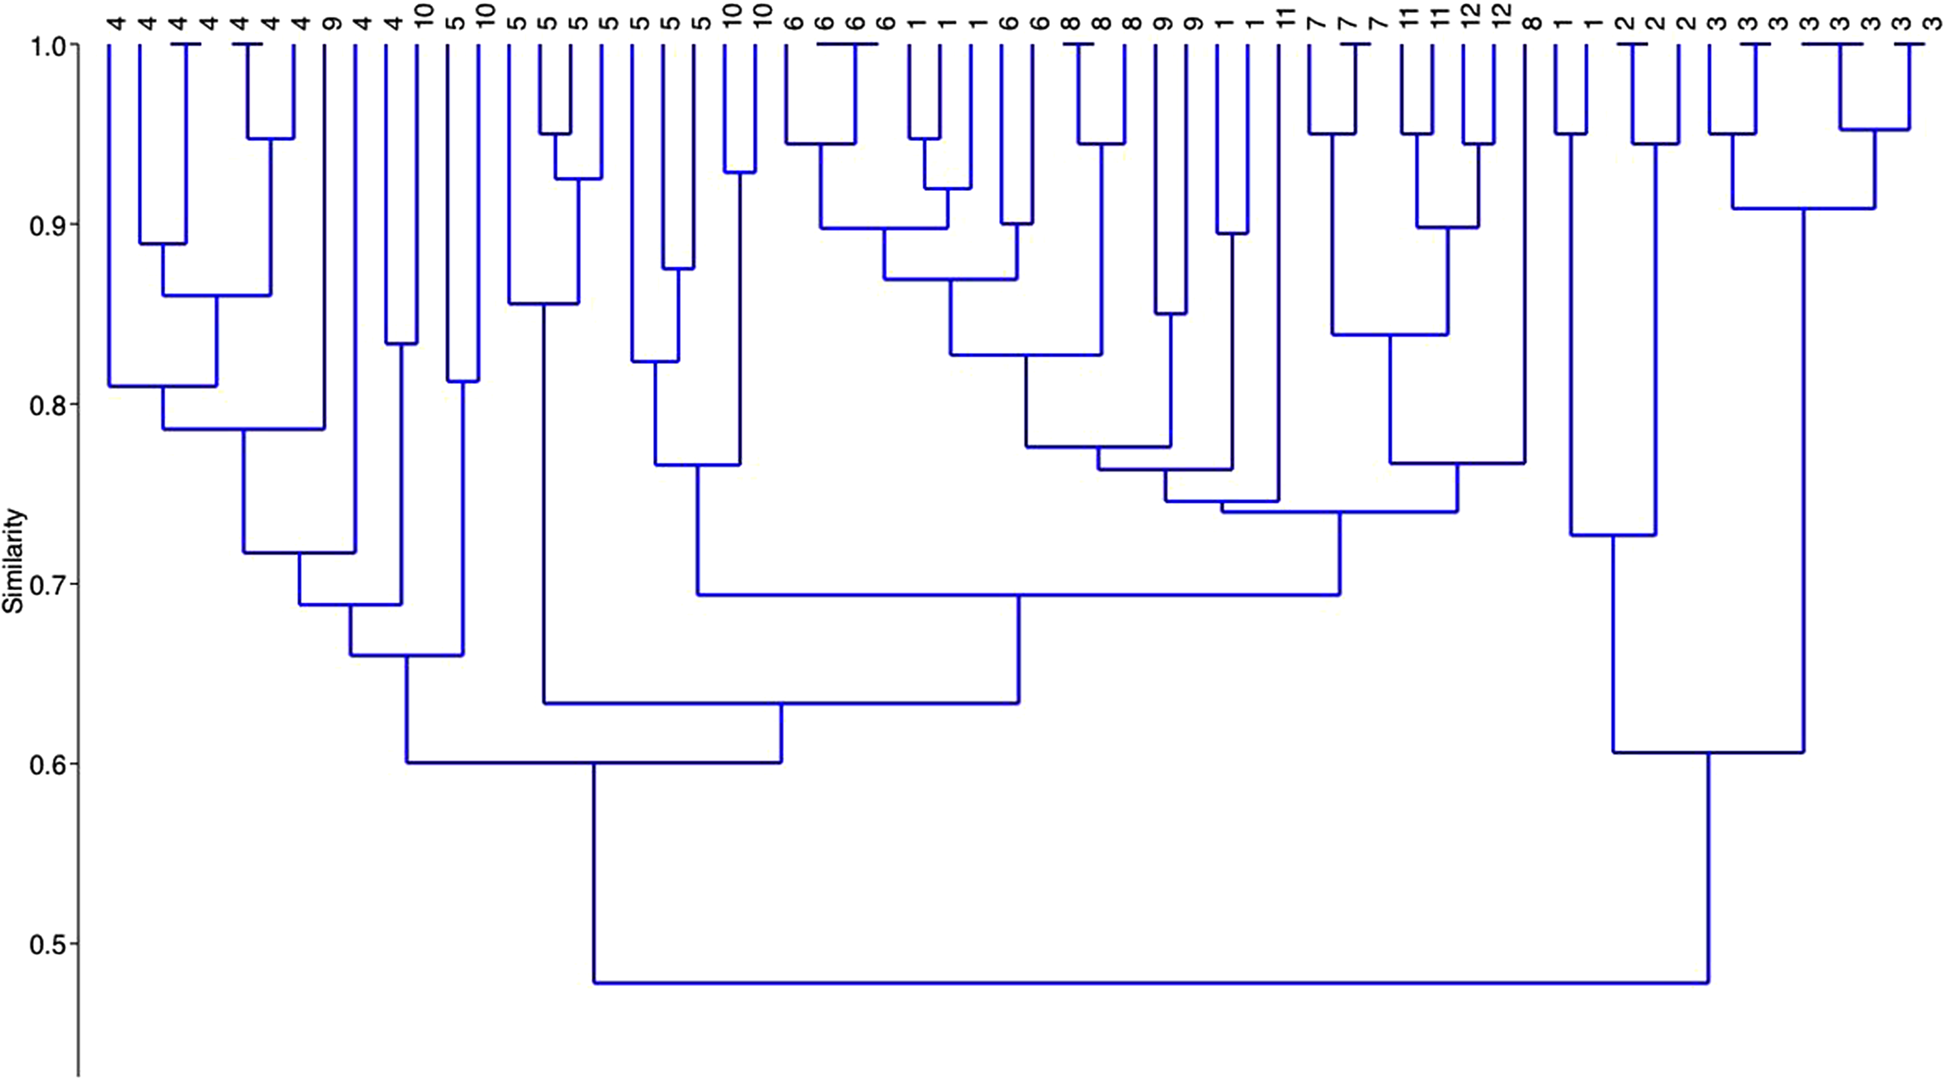
The Neis' genetic distance of the studied populations varied from 0.05 to 0.61 in these populations. UPGMA. dendrogram of the sour oranges and their replicates is presented in Fig. 2. Most of the studied populations and their replicates are placed in a separate sub-cluster, indicating that they differ from the other populations based on their SCoT data. In some cases, some degree of admixture is presented.
UPGMA dendrogram of sour orange populations and their replicates based on SCoT bands showing that the replicates in most of the populations form a. separate sub-cluster (Populations 1–12 are according to Table 1).

In general, it seems that SCoT bands can differentiate sour orange and may be used in germplasm genetic fingerprinting. This is further supported by significant among populations' Fst value obtained by AMOVA (PhiPT = 0.68, P = 0.001). AMOVA revealed that 68% of total genetic difference is due to among population difference, while only 32% of genetic variability is due to within population variability. Therefore, an adequate genetic difference exists among sour orange plants of the country as revealed by SCoT bands.
Genetic grouping of sour orange plants
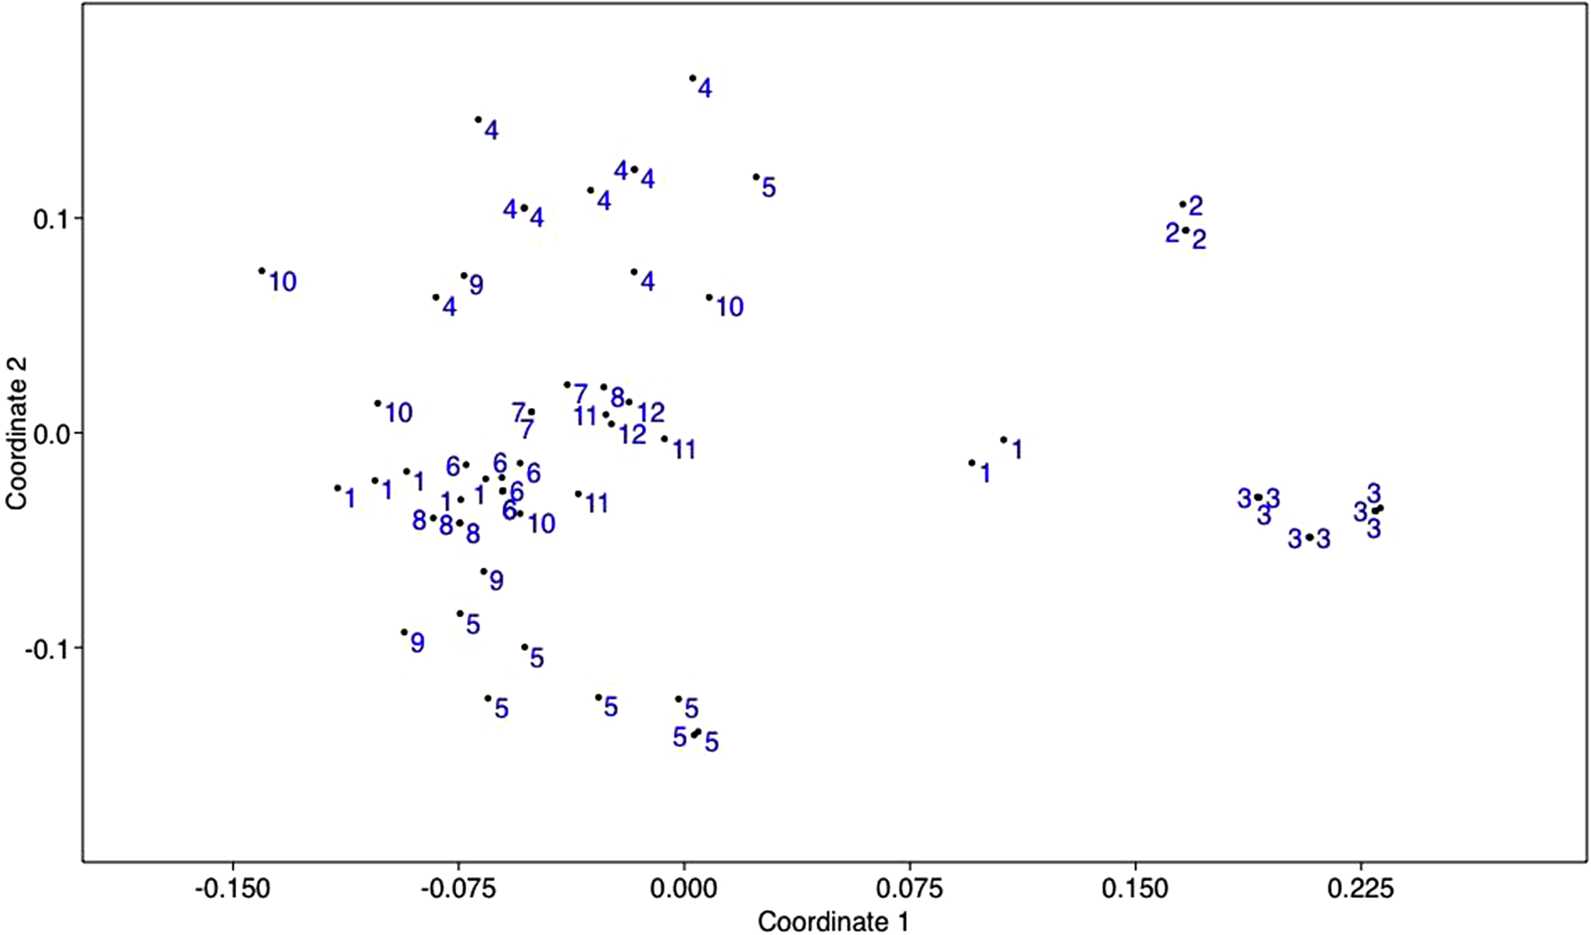
The genetic grouping by MDS plot (Fig. 3), separated two populations 2 and 3, from the other populations. Therefore, these populations differ genetically from the other studied populations with a greater distance. The other populations show a higher degree of genetic similarity and are placed closer to each other.
MDS plot of sour orange plants based on SCoT bands.

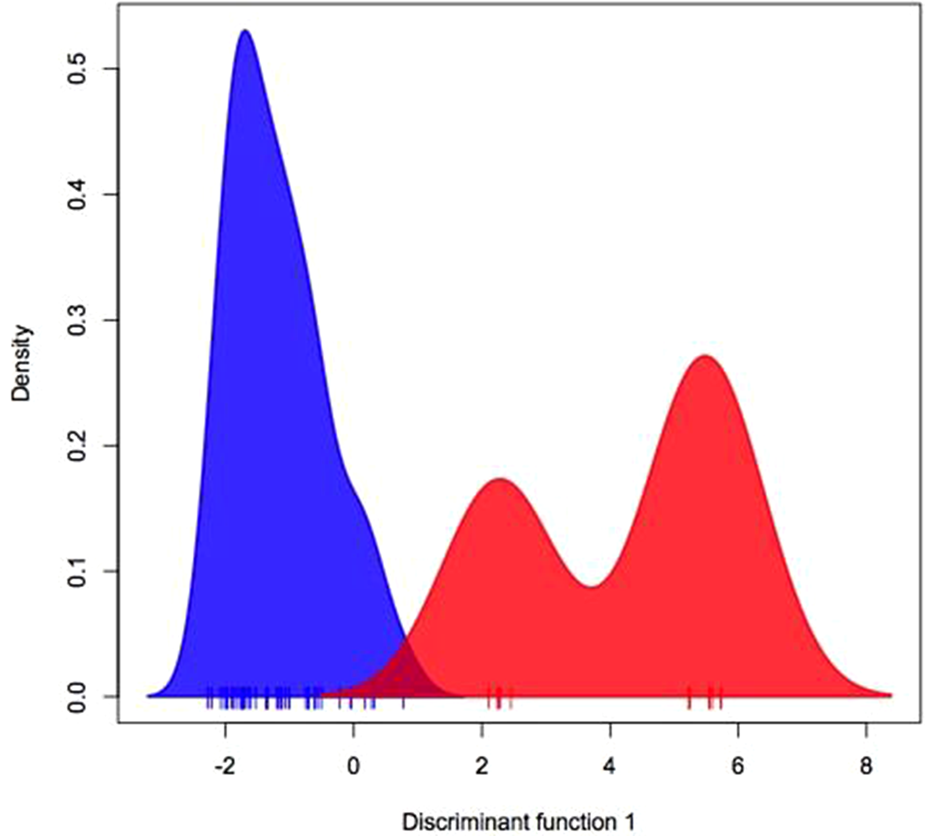
DAPC analysis of SCoT data also placed sour orange plants studied in two major genetic groups (Fig. 4). The first group (blue colored peack), is formed by members of populations 2 and 3, while the second major group is formed by the rest of studied populations. This group (red colored peak), shows two sub-groups (smaller peaks), due to a lower level of genetic difference of the populations.
Discriminant genetic grouping of sour orange populations.

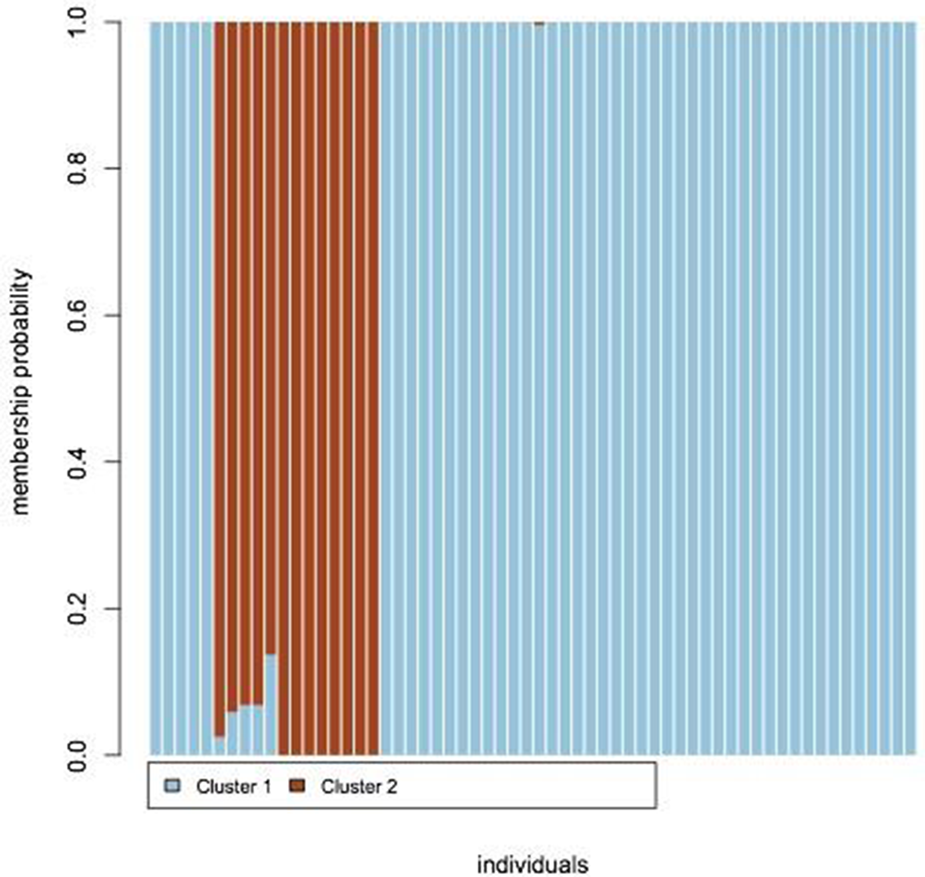
The result of assignment test as a measure of genetic admixture as performed in DAPC analysis is presented in Fig. 5. Based on SCoT markers sour orange plants were placed in two genetic group and showed very low degree of genetic admixture. These results are in agreement with Gst / Nm results. The mean migration rate (Nm), was obtained was about 0.20, which shows a very low amount of gene flow among the studied populations.
DAPC genetic grouping of sour orange populations.

Adaptive SCoT loci
CCA (online Supplementary Fig. S2) and RDA analyses produced almost a similar results and identified the same SCoT loci with potential adaptive value. All these loci had significant correlation (P < 0.01), with geographical variables after 1000 permutations.
Manhattan plot of LFMM analysis shows many SCoT loci. have >1 -log (P value) and the P values obtained for these loci were significant (P < 0.01). Therefore, changes in SCoT loci are to some degree associated with geographical distribution of sour orange plants.
Discussion
Citrus species as a whole are among the most important plants to mankind and comprise an eminent source for fruits and fruit juice as well as some medicinal values. For these reasons, Citrus species have been deeply studied from points of evolution, species relatedness, genetic diversity, breeding, etc. The genus Citrus, though comprise some of the most widely cultivated fruit crops worldwide, has a complex taxonomy and uncertain number of species, due to hybridization, artificial selection (Wu et al., Reference Wu, Prochnik, Jenkins, Salse, Hellsten, Murat, Perrier, Ruiz, Scalabrin, Terol, Takita, Labadie, Poulain, Couloux, Jabbari, Cattonaro, Fabbro, Pinosio, Zuccolo, Chapman, Grimwood, Tadeo, Estornell, Muñoz-Sanz, Ibanez, Herrero-Ortega, Aleza, Pérez-Pérez, Ramón, Brunel, Luro, Chen, Farmerie, Desany, Kodira, Mohiuddin, Harkins, Fredrikson, Burns, Lomsadze, Borodovsky, Reforgiato, Freitas-Astúa, Quetier, Navarro, Roose, Wincker, Schmutz, Morgante, Machado, Talon, Jaillon, Ollitrault, Gmitter and Rokhsar2014). The present study considers a preliminary step in population genetics study of Citrus species in the country and focuses on sour orange populations.
SCoT molecular bands which are efficient bands for genetic diversity analysis in different plant species were used in this investigation (Saboori et al., Reference Saboori, Noormohammadi, Sheidai and Marashi S2021). The results obtained by DCA and DAPC analyses revealed that these bands can be used for genetic fingerprinting in sour orange germ plasm.
We obtained a low to moderate genetic variability in sour orange plants studied, which is in accord to similar reports from the other parts of the world, even by using different molecular markers. This low genetic variability may be in part due to apomixes prevailing in Citrus species and vegetative propagation practiced in these taxa. For example, in France, Ferrer et al. (Reference Ferrer, Costantin, Paoli, Paymal, Quinton, Ollitrault, Tomi and Luro2021) performed a detailed diversity analysis of morphological, genetically and aromatic features of 45 sour orange accessions grafted on the same rootstock (Carrizo citrange, [C. sinensis × Poncirus trifoliata]) and grown under identical conditions. They also used three ancestral species of C. maxima, C. reticulata and C. medica, as the positive control in their study. They obtained a main genetic group composed of thirty-nine cultivars with no genetic variability based SSR markers data. However, a few other genetic groups were identified which contained small number of sour orange cultivars. Similarly, Siragusa et al. (Reference Siragusa, De Pasquale, Abbate and Tusa2006), used ISSR, RAPD markers for genetic variability investigation in sour orange accessions of Italy and some imported accessions. They found a higher magnitude of genetic variability between foreign accessions and indigenous Italian plants, while within Italy, a lower genetic diversity was encountered.
A moderate level of genetic diversity (0.39–0.47) was also reported in sour orange accessions of Turkey, based on SSR and SRAP molecular markers (Polat et al., Reference Polat, Kaçar, Yesiloglu, Uzun, Tuzcu, Gulsen, Incesu, Kafa, Turgutoglu and Anil2012). The genetic grouping of sour orange plants we obtained revealed the presence of two major genetic groups. A major group contained a bigger number of plants and populations, but a few were genetically differentiated. Moreover, plant populations within either of these two groups differed significantly in their genetic content as revealed by AMOVA. These results indicate genetic difference in sour orange plants of our country. A similar study by Polat et al. (Reference Polat, Kaçar, Yesiloglu, Uzun, Tuzcu, Gulsen, Incesu, Kafa, Turgutoglu and Anil2012), in Turkey and Siragusa et al. (Reference Siragusa, De Pasquale, Abbate and Tusa2006), in Italy also ended in a similar result, and separated a few accessions from the other studied materials.
One of the new findings in our study is the result showing association between some of the SCoT loci and geographical variables studied. This indicates that genomic changes in sour orange may have been shaped in response to prevailing geographical and ecological conditions. These genetic changes might have occurred in the genetic regions responsible for local adaptation or the regions close to these genes depicted in SCoT loci. To reach a conclusive result on both genetic variability and local genetic adaptation of Citrus plants in the country, we should continue our study with more molecular markers and genomic data in future. Nevertheless, as shown in Fig. 2, populations that were geographically close to each other, such as the two populations of Behshahr and Neka (Mazandaran), were placed in the same cluster, and this confirms the effect of geographic distance on genetic distance.
Finally, to summarise, there is a good level of genetic variability in sour orange plants of Iran which may be used in future breeding programs of Citrus plants in the country, and SCoT markers can be used along with the other molecular markers to perform genetic fingerprinting of these taxa.
Supplementary material
The supplementary material for this article can be found at https://doi.org/10.1017/S1479262124000431
Author contributions
Masood Sheidai: conceptualization of the project and writhe paper; Fahimeh Koohdar: conceptualization of the project, writhe paper and lab work; Rabeeh Ghahremani: data collection and lab work.
Funding statement
None.
Competing interests
All authors have no conflict of interest.
Availability of data and material
All data are available from the corresponding author on reasonable request.
Code availability
None.
Data archiving statement
In Shahid beheshti university.