Adipose tissue is a metabolically active endocrine organ that plays a central role in energy homeostasis and metabolic regulation(Reference Cho, Lee and Lee1). Among its major depots, subcutaneous adipose tissue (SAT) and visceral adipose tissue (VAT) exhibit distinct metabolic characteristics. VAT, in particular, has been strongly associated with insulin resistance, dyslipidaemia, chronic low-grade inflammation and increased cardiometabolic risk. Given its endocrine activity, adipose tissue contributes to the secretion of numerous adipokines involved in the regulation of appetite, energy balance and metabolic function(Reference Ibrahim2–Reference Ziegler and Scheele4).
Leptin is an adipocyte-derived hormone that plays a central role in energy balance, appetite regulation and metabolic homeostasis(Reference Izquierdo, Crujeiras and Casanueva5). Circulating leptin concentrations are strongly associated with adiposity and are typically elevated in individuals with obesity, reflecting the development of leptin resistance(Reference Friedman6,Reference Pico, Palou and Pomar7) . In addition to its role in body weight regulation, leptin has been associated with alterations in lipid metabolism and cardiometabolic risk factors, including triglycerides (TG), cholesterol (Chol) and low-density lipoprotein (LDL) concentrations(Reference Pico, Palou and Pomar7). Additionally, leptin plays an immunomodulatory role by activating resident and infiltrating immune cells, including macrophages, within adipose tissue chronic hyperleptinemia, frequently observed in individuals with obesity, promotes macrophage infiltration and inflammatory pathway activation, exacerbating metabolic dysfunction(Reference Monteiro, Pereira and Palhinha8). Consequently, changes in leptin may provide insight into metabolic adaptations accompanying dietary and exercise interventions.
A growing body of evidence suggests that an increase in adipose tissue mass directly contributes to elevated circulating leptin levels. As a result, the most prevalent forms of obesity are characterised by both hyperleptinemia and leptin resistance, rendering pharmacological leptin administration ineffective for appetite suppression and weight reduction(Reference Genchi, D’Oria and Palma9). Moreover, leptin is overexpressed at the genetic level in adipose tissue of obese individuals, with strong positive correlations observed between plasma leptin concentrations and body fat percen TGe(Reference Obradovic, Sudar-Milovanovic and Soskic10). Studies indicate that during early weight loss, plasma leptin levels decline(Reference Vilarino-Garcia, Polonio-Gonzalez and Perez-Perez11). Furthermore, serum leptin levels have been associated with Chol, TG and LDL levels, though no significant correlation has been observed with high-density lipoprotein (HDL)(Reference Hijjawi, Al-Radaideh and Al-Fayomi12,Reference Kappelle, Dullaart and van Beek13) .
Time-restricted eating (TRE), a form of intermittent fasting (IF), confines daily food intake to a limited window of 4–12 h, thereby inducing a fasting period of 12–20 h(Reference Adafer, Messaadi and Meddahi14). TRE has emerged as a promising dietary strategy for obesity and metabolic disorders, demonstrating high adherence and minimal adverse effects. When practised with ad libitum eating, TRE has been associated with moderate weight loss (2–4 % over 3 months), likely due to reduced caloric intake. Preliminary evidence suggests that TRE may also improve glucose and lipid metabolism, as well as blood pressure, particularly in metabolically unhealthy obese individuals, even in the absence of significant weight loss(Reference Zhu, Surampudi and Rosharavan15). Beyond its effects on body weight, TRE may influence leptin regulation through alterations in energy balance, meal timing and adipose tissue metabolism. Previous studies have reported reductions in circulating leptin concentrations following fasting-based interventions(Reference Mattson, Longo and Harvie16), although findings remain inconsistent and appear to depend on the duration of fasting, degree of energy restriction and changes in body fat mass (FM).
Protein supplementation has been shown to significantly enhance muscle hypertrophy and strength gains during prolonged resistance training (RT). Notably, protein supplementation is particularly effective in promoting lean mass accumulation in young, physically active individuals engaging in RT. A daily protein intake of approximately 1·6 g/kg body weight is considered sufficient for optimising training adaptations in most healthy adults(Reference Morton, Murphy and McKellar17). Combining caloric restriction with high-protein intake has been identified as an effective strategy for reducing VAT while preserving lean body mass(Reference Bel Lassen, Belda and Prifti18). Furthermore, high-protein diets may represent a more effective and sustainable intervention for managing cardiometabolic risk factors. Notably, metabolic improvements associated with high-protein diets appear to occur even in the absence of significant weight loss(Reference Evangelista, Jose and Sallam19). Similarly, higher protein intake may influence leptin responses indirectly through its effects on satiety, energy expenditure, body composition and FM preservation during weight loss. However, the extent to which protein intake modifies the relationship between leptin and changes in body composition or lipid metabolism remains unclear(Reference Evangelista, Jose and Sallam19,Reference Leidy, Clifton and Astrup20) .
Leptin is not only a marker of adiposity but also a pro-inflammatory cytokine involved in metabolic regulation(Reference La Cava and Matarese21). Therefore, a decrease in leptin levels may help to suppress inflammation, thereby facilitating improved fat oxidation and lipid metabolism. This physiological link may partly explain the beneficial effects of combined exercise and dietary interventions on body composition and lipid profile; therefore, this study aims to investigate the relationship between changes in leptin levels and alterations in VAT, SAT, FM and lipid profiles following an 8-week RT programme, combined with a calorie-restricted, TRE with either high- or normal-protein intake. We hypothesised that reductions in circulating leptin concentrations would be associated with decreases in FM, VAT and SAT, as well as favourable changes in lipid profile variables, particularly in participants following TRE and higher-protein dietary interventions.
Methods
Study design and participant allocation
This study was designed, executed and reported in alignment with the CONSORT 2025 standards for randomised controlled trials(Reference Hopewell, Chan and Collins22). This single-blind, randomised controlled trial is registered with the Sport Sciences Research Institute of Iran (SSRI.REC-2305-2243). Participants were blinded to group allocation regarding protein intake and TRE conditions where feasible; however, due to the nature of the intervention, full participant blinding was not possible. Outcome assessors and data analysts were blinded to group allocation to minimise bias. The study was conducted at the Faculty of Sports Sciences, Kharazmi University, adhering to ethical guidelines, with written informed consent obtained from all participants. Sedentary overweight women (BMI 25–30 kg/m2, aged 18–30 years) were recruited via advertisements, posters and word-of-mouth referrals. Inclusion criteria required no RT for at least 6 months and the absence of medical conditions such as cardiovascular disease, diabetes, pregnancy, food allergies (e.g. dairy intolerance) or smoking habits. Participants were randomly assigned to one of four groups using computer-generated randomisation (www.random.org): TRE with high-protein intake (THP), TRE with regular-protein intake (TRP), high protein without TRE (HP) and regular protein without TRE (RP). To maintain blinding, participants were unaware of their group allocation regarding protein intake and TRE status, and supervisors refrained from discussing dietary assignments. The descriptive baseline characteristics of the participants can be found in our previous published study(Reference Bagherpour, Arazi and Rajabi23).
Dietary intervention protocol
Participants were not provided with meals or prepared foods. Instead, individualised meal plans were developed using the Persian Master Diet software (https://selakteb.com/product/), based on each participant’s estimated energy requirements and the prescribed 25 % energy deficit. The meal plans specified recommended food items, portion sizes, meal timing and daily macronutrient targets. Participants received dietary counselling from a qualified nutrition professional and were instructed on how to select and prepare foods in accordance with their assigned dietary protocol. Regular follow-up contacts were conducted throughout the intervention to monitor compliance and address dietary questions. In the TRE groups (THP and TRP), food intake was restricted to a 10-h feeding window, followed by 14 h of fasting. A 10-h feeding window was selected to provide a practical and sustainable TRE protocol while maintaining a daily fasting period sufficient to induce the metabolic adaptations associated with TRE. Compared with more restrictive eating windows, a 10-h schedule has been shown to promote adherence in free-living individuals and facilitates meal timing and protein distribution around RT sessions. Protein intake was set at 1·6 g/kg/d for the THP and HP groups, with 70 % sourced from whole foods and 30 % from whey protein supplementation, provided 30 min post-exercise on training days and at the same time on non-training days. In contrast, the RP and TRP groups obtained all their protein from food, consuming 0·8 g/kg/d. The THP and HP groups adhered to a macronutrient ratio of 30 % protein, 30 % fat and 40 % carbohydrates, whereas the RP and TRP groups followed a diet consisting of 20 % protein, 30 % fat and 50 % carbohydrates. To preserve blinding, supervisors responsible for dietary monitoring were unaware of the protein intake allocation. Furthermore, in the high-protein groups, the energy content of whey protein was accounted for by adjusting total daily caloric intake to ensure consistency across individualised meal plans. Data were presented in our previous published study(Reference Bagherpour, Arazi and Rajabi23).
Resistance training protocol
A structured 8-week RT programme, supervised by certified coaches from the Federation of Bodybuilding, was implemented for all groups. Coaches were present throughout each session to provide instruction, monitor exercise technique, ensure adherence to the prescribed training protocol, adjust loads when necessary and maintain participant safety. Training sessions were held three times per week (Saturday, Monday and Wednesday) at the Kharazmi University gymnasium, with participants instructed to abstain from any additional RT outside the study protocol. Each session began with a 10-min warm-up, consisting of 7 min of moderate-intensity running followed by 3 min of dynamic stretching. The core programme incorporated eight resistance exercises targeting major muscle groups: three upper-body movements (chest press, lat pulldown, bicep curls), three lower-body exercises (leg press, leg extension and leg flexion) and two core exercises (plank and back extensions). Participants performed three sets of 8–10 repetitions per exercise, with training intensity progressively increasing from 65 % to 80 % of one-repetition maximum (1RM) over the intervention period. Participants training at 65 % of 1RM during weeks 1–2, 70 % during weeks 3–4, 75 % during weeks 5–6 and 80 % during weeks 7–8. One-repetition maximum was assessed before and after the intervention but was not re-evaluated during the training to minimise participant burden and disruption to the training programme.
For individuals in the TRE groups, training sessions were scheduled within their designated eating window (1–3 PM) to align with their nutritional intake strategy.
Adherence
Compliance with pre-testing requirements (e.g. health status, abstention from exercise and alcohol) was verified using the ACSM Health Status and History Questionnaire, completed by participants prior to testing. This ensured eligibility and protocol readiness. Dietary intake was monitored through daily communication, including phone check-ins and in-person meetings, during which participants reported their consumption and any protocol deviations were promptly managed; however, adherence was primarily based on self-reported intake, which represents a limitation of the study and may be subject to reporting bias. Non-adherence to the dietary protocol was defined as failure to comply with the prescribed dietary regimen for ≥2 consecutive days, accompanied by insufficient engagement with monitoring procedures or repeated deviation from prescribed intake targets during the intervention period. RT adherence was tracked through detailed attendance logs, with session-by-session records maintained.
Laboratory assessments
Participants completed two laboratory testing sessions before and after the intervention. Written informed consent was obtained following a detailed explanation of the study procedures. Prior to testing, participants were familiarised with all assessment protocols and instructed to fast for at least 12 h overnight, consuming only water, while also avoiding strenuous physical activity to ensure accurate measurements. The first session (Day 1) focused on VAT and regional SAT assessments using MRI. The second session (Day 2, morning) involved blood sample collection and body composition analysis, both conducted in a fasted state. Potential side effects were evaluated using a self-designed questionnaire, which assessed gastrointestinal issues such as pain, bloating, nausea, vomiting, reflux and any allergic reactions. Additionally, face-to-face and daily check-ins allowed for real-time reporting of any discomfort or adverse effects. A university medical doctor was available to address any health concerns that arose during the study.
Body composition assessment
A Siemens 1.5T MRI scanner (Germany) was utilised to obtain images of VAT and abdominal SAT in the L4–L5 region. Imaging procedures were conducted under the supervision of trained personnel, with participants positioned supine within the scanner. The acquired data, stored in DICOM format, was processed using 3D Slicer 5.7.0 software to quantify VAT and regional SAT volume. Additionally, whole-body FM and body weight were measured using a bioelectrical impedance analysis device (Meditate). Previous studies have similarly combined MRI-based regional adipose tissue assessment with simpler whole-body composition techniques, including bioelectrical impedance analysis, in obesity and metabolic research(Reference Browning, Mugridge and Dixon24,Reference Froelich, Fugmann and Daldrup25) ; however, differences in measurement modalities should be considered when interpreting absolute values.
Metabolic and physiological assessments and biochemical analyses
Blood samples were collected from the antecubital vein by a trained phlebotomist and analysed using standardised laboratory protocols.
Lipid profile: Total Chol, TG and HDL-cholesterol (enzymatic colorimetric methods); LDL-cholesterol (photometric method). Hormonal assessment: Serum leptin concentrations were measured using an ELISA kit (Human Leptin ELISA kit, Zellbio). Intra-assay CV were <10 %, and inter-assay CV were <12 % for leptin and <10 % and <15 % for ghrelin, respectively.
Side effects evaluation
Potential side effects were evaluated using a self-designed questionnaire, which assessed gastrointestinal issues such as pain, bloating, nausea, vomiting, reflux and any allergic reactions. Additionally, face-to-face check-ins allowed for real-time reporting of any discomfort or adverse effects. A university medical doctor was available to address any health concerns that arose during the study.
Statistical analysis
All statistical analyses were performed using SPSS (version 29.0, IBM). Data were first assessed for normality using the Shapiro–Wilk tests. Baseline group comparisons, descriptive statistics (mean ± sd) and previously reported time and group effects obtained from two-way repeated-measures ANOVA are referenced from our earlier publication(Reference Bagherpour, Arazi and Rajabi23) for contextual completeness. The current manuscript specifically focuses on newly conducted correlation and regression analyses examining associations between changes in leptin and body composition and lipid profile variables.
To examine the relationship between leptin changes and VAT, SAT, FM, Chol, TG, LDL and HDL changes, correlation analysis was first performed. If both variables were normally distributed, Pearson’s correlation coefficient was used; otherwise, Spearman’s correlation coefficient was applied.
Following correlation analysis, linear regression analysis was conducted separately for each intervention group to determine whether leptin changes predicted other variables. The assumption of normality of residuals was evaluated through the Shapiro–Wilk test on unstandardised residuals. If residuals were not normally distributed, logarithmic transformation was applied to the dependent variable, and regression was rerun. Homoscedasticity was assessed using residual scatterplots. A significance level of P < 0·05 was considered statistically significant.
An a priori power analysis was performed using G*Power 3.1.9.7 to determine the required sample size for a repeated-measures within-subjects ANOVA. The effect size for VAT, a primary outcome measure, was derived from mean differences and standard deviations reported by Haganes et al.(Reference Haganes, Silva and Eyjolfsdottir26), resulting in a Cohen’s d of 1·15, indicative of a large effect. This calculation was corroborated using an online effect size calculator (https://lbecker.uccs.edu/). The power analysis was conducted with a significance level (α) of 0·05 and a desired statistical power of 0·80, yielding a minimum required total sample size of twelve participants. However, because effect sizes derived from previous studies may overestimate intervention effects under ideal conditions, including lower inter-individual variability and higher protocol adherence, a more conservative moderate effect size (Cohen’s d = 0·5) (a conservative moderate effect size, based on conventional benchmarks proposed by Cohen(Reference Cohen27)) was subsequently adopted for final sample size estimation. The revised analysis indicated that a minimum sample size of thirty-six participants would be required to achieve adequate statistical power, accounting for potential sources of variability, including inter-individual differences, measurement error and variability in protocol adherence, as well as the inclusion of secondary outcome measures. To accommodate potential attrition, the final recruitment target was increased to forty-one participants.
Results
Participant flow
A total of forty-one participants were enrolled in the study. During the intervention, seven participants withdrew, including two for personal reasons, two due to non-compliance with the dietary protocol, one due to non-compliance with the training protocol and two due to non-compliance with both protocols. In addition, two participants completed the intervention but did not undergo post-intervention assessments. Consequently, data from thirty-two participants were included in the final analyses (Figure 1).
Flow diagram of the study. Participants were randomly assigned to one of four groups using a computer-generated randomisation tool (www.random.org). THP, TRE plus high protein; TRP, TRE plus regular protein; HP, high protein; RP, regular protein; TRE, time-restricted eating.

Figure 1. Long description
A flowchart illustrating the randomization and allocation of participants into different study groups. Initially, 56 participants were screened. 15 participants were excluded due to pregnancy, being over 30 years old, having an inappropriate BMI range, or declining to participate. This left 41 participants who were randomized using a computer-generated tool. The participants were divided into four groups: THP with 10 participants, TRP with 10 participants, HP with 11 participants, and RP with 10 participants. In the THP group, 1 participant had personal issues and 1 did not follow the post-test procedure, leaving 8 participants. In the TRP group, 1 participant did not adhere to the diet and 1 did not follow the post-test procedure, leaving 8 participants. In the HP group, 1 participant did not adhere to the diet, 1 did not adhere to training, and 1 did not adhere to both diet and training, leaving 8 participants. In the RP group, 1 participant had personal issues and 1 did not adhere to diet and training, leaving 8 participants.
Descriptive data
Baseline and post-intervention descriptive data have been published elsewhere(Reference Bagherpour, Arazi and Rajabi23).
Time and group comparisons
Inferential analyses for time and group effects were previously published(Reference Bagherpour, Arazi and Rajabi23).
Adherence to training sessions
Participants exhibited strong compliance, completing an average of 94·1 % of the scheduled training sessions, with adherence calculated individually for each participant.
Body fat
Leptin and visceral adipose tissue
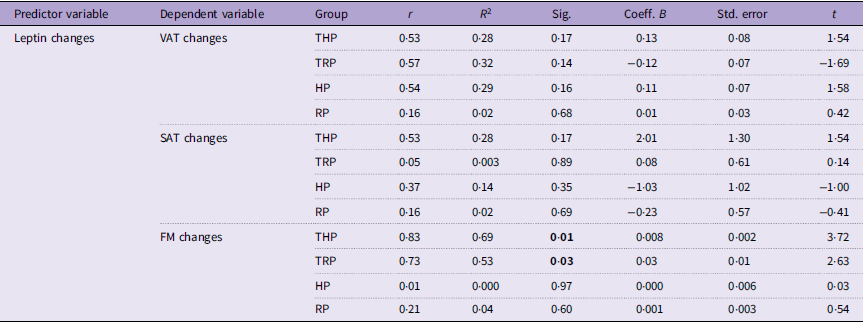
No significant associations were observed between changes in leptin and VAT in any group. Correlation coefficients varied in direction and magnitude across groups, but none of the regression models reached statistical significance. Detailed results are presented in Table 1.
Associations between changes in leptin and changes in body composition (Data presents the regression analyses)

Table 1. Long description
A table with 10 rows and 9 columns showing regression analyses of leptin changes and body composition changes across different groups. The columns are Predictor variable, Dependent variable, Group, r, R-squared, Sig., Coeff. B, Std. error, and t. The rows are grouped by Dependent variable: VAT changes, SAT changes, and FM changes. Each group (THP, TRP, HP, RP) has corresponding values for r, R-squared, Sig., Coeff. B, Std. error, and t. Notable trends include significant correlations for FM changes in the THP and TRP groups.
r, correlation coefficient; R 2, coefficient of determination; B, unstandardised regression coefficient; t, t-value; VAT, visceral adipose tissue; SAT, subcutaneous adipose tissue, FM, fat mass; THP, TRE plus high protein; TRP, TRE plus regular protein; HP, high protein; RP, regular protein.
Leptin and subcutaneous adipose tissue
No significant associations were observed between changes in leptin and SAT in any of the groups. Correlation coefficients varied in direction and magnitude across groups, and Spearman’s correlation was applied in the HP group due to non-normality. Similarly, regression analyses indicated that changes in leptin did not significantly predict SAT changes in any group. Detailed results are presented in Table 1.
Leptin and fat mass
Significant positive associations between changes in leptin and FM were observed in the THP and TRP groups, indicating that reductions in FM were accompanied by decreases in circulating leptin levels. No significant associations were identified in the HP or RP groups. Regression analyses also demonstrated significant associations between leptin and FM changes in the THP (R 2 = 0·69, P = 0·01) and TRP groups (R 2 = 0·53, P = 0·03) (Figure 2). These findings should be interpreted cautiously given the relatively small sample size within each group. Detailed results are presented in Table 1.
Regression analyses showing the significant associations between changes in leptin and changes in FM in the THP (A) and TRP (B) groups. The solid line represents the line of best fit from the simple linear regression model. FM, fat mass; THP, TRE plus high protein; TRP, TRE plus regular protein; TRE, time-restricted eating.

Blood lipid profile
Leptin and TG
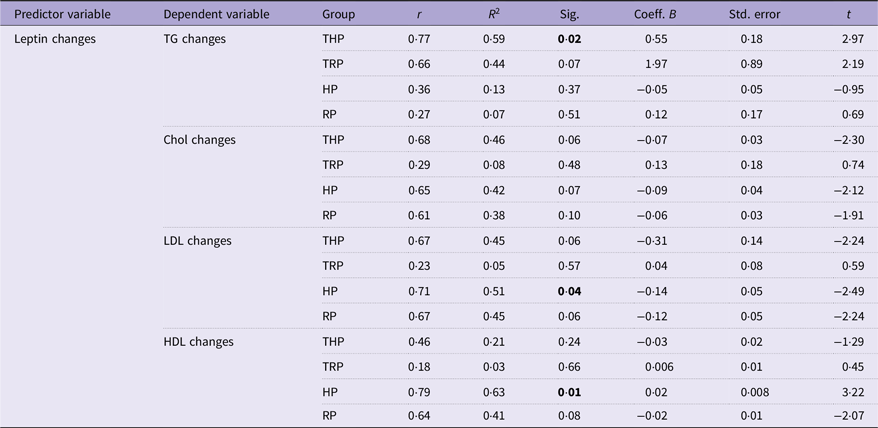
A significant positive association between changes in leptin and TG was observed only in the THP group (R 2 = 0·59, P = 0·02) (Figure 3). No significant associations were identified in the TRP, HP or RP groups. Detailed results are presented in Table 2.
Regression analyses showing the significant associations between changes in leptin and changes in TG in the THP group (A), and changes in LDL (B) and HDL (C) in the HP group. The solid line represents the line of best fit from the simple linear regression model. HP, high protein; THP, TRE plus high protein; TRE, time-restricted eating.

Figure 3. Long description
Panel A: A scatter plot shows the relationship between leptin changes and TG changes in the THP group. The x-axis represents leptin changes, ranging from -220.00 to -80.00. The y-axis represents TG changes, ranging from -75.00 to 25.00. The plot includes a line of best fit with an R-squared value of 0.597, indicating a positive association. Panel B: A scatter plot shows the relationship between leptin changes and Log LDL changes in the HP group. The x-axis represents leptin changes, ranging from -200.00 to 0.00. The y-axis represents Log LDL changes, ranging from -0.50 to 3.50. The plot includes a line of best fit with an R-squared value of 0.158, indicating a weak negative association. Panel C: A scatter plot shows the relationship between leptin changes and HDL changes in the HP group. The x-axis represents leptin changes, ranging from -200.00 to 0.00. The y-axis represents HDL changes, ranging from -6.00 to -1.00. The plot includes a line of best fit with an R-squared value of 0.634, indicating a positive association.
Associations between leptin changes and lipid profile changes (Data presents the regression analyses)

Table 2. Long description
A table with 5 rows and 9 columns. The columns are labeled Predictor variable, Dependent variable, Group, r, R-squared, Sig., Coeff. B, Std. error, and t. The rows are grouped by different dependent variables: TG changes, Chol changes, LDL changes, and HDL changes. Each group (THP, TRP, HP, RP) has corresponding values for r, R-squared, Sig., Coeff. B, Std. error, and t. Notable values include significant associations in the THP group for TG changes (Sig. 0.02) and in the HP group for HDL changes (Sig. 0.01).
r, correlation coefficient; R 2, coefficient of determination; B, unstandardised regression coefficient; t, t-value; Chol, cholesterol; THP, TRE plus high protein; TRP, TRE plus regular protein; HP, high protein; RP, regular protein.
Leptin and cholesterol
Associations between changes in leptin and total Chol were not statistically significant in any group, although correlation coefficients varied in direction and magnitude. Detailed results are presented in Table 2.
Leptin and LDL
A significant association between changes in leptin and LDL concentrations was observed only in the HP group (R 2 = 0·51, P = 0·04) (Figure 3). No significant associations were found in the THP, TRP or RP groups. Prior to regression analysis, the normality of residuals was assessed using the Shapiro–Wilk test. Because residuals in the HP group deviated from normality, LDL values were natural log-transformed before the final regression analysis was performed. Following transformation, the residuals no longer showed a significant deviation from normality (Figure 3).
Leptin and HDL
A significant association between changes in leptin and HDL concentrations was observed only in the HP group (R 2 = 0·63, P = 0·01) (Figure 3), whereas no significant associations were identified in the remaining groups. These findings should be interpreted cautiously given the limited sample size.
Discussion
This study investigated the associations between changes in leptin levels and both body composition (VAT, SAT and FM) and lipid profile (TG, Chol, LDL and HDL) across four different intervention groups. These findings provide insight into the short-term associations between changes in leptin, body composition and lipid profile variables during an 8-week dietary and RT intervention in women with overweight. Overall, our results demonstrated that changes in leptin levels were significantly associated with changes in FM in the THP and TRP groups, whereas no significant associations were observed with VAT or SAT. Associations between leptin and lipid markers were less consistent and varied across intervention groups.
These findings are consistent with the study by Tremblay et al.(Reference Tremblay, Dutheil and Drapeau28), in which participants (aged between 50 and 70 years, having a diagnosis of metabolic syndrome, being overweight and sedentary) engaged in a moderate-to-vigorous exercise regimen over 12 weeks. They observed reductions in total body fat and visceral adiposity, accompanied by favourable shifts in adipokine profiles, including leptin, and Moro et al.’s(Reference Moro, Tinsley and Bianco29) study, which investigated the effect of TRE and a high-protein diet beside RT on resistance-trained males, reported significant reductions in FM and improvements in lipid profile markers, including total cholesterol and LDL levels. In contrast, Caldeira et al. found that high-intensity intermittent training in healthy and non-obese men, aged between 18 and 35 years, led to no reductions in FM but decreased leptin levels(Reference Caldeira, Panissa and Inoue30). Mengi Çelik et al. also showed that TRE improved diet quality and body composition in overweight females, which is in line with the fat-related outcomes observed in our THP and TRP groups, but leptin had no significant changes(Reference Mengi Celik, Koksal and Akturk31). In contrast, in the study of Stratton et al., after 4 weeks of TRE, restricted diet, high protein and RT, they did not report any significant decrease in FM in recreationally active males(Reference Stratton, Tinsley and Alesi32).
As noted, changes in leptin were significantly associated with reductions in FM in the TRE groups (THP and TRP). Although reductions in leptin may accompany favourable metabolic adaptations during weight loss, the present study was not designed to assess the underlying mechanisms responsible for these changes. Previous research has suggested that TRE may influence leptin regulation through alterations in energy balance, meal timing and metabolic processes(Reference Mattson, Longo and Harvie16). However, leptin sensitivity, inflammatory markers and circadian-related variables were not measured in the current study. Therefore, any mechanistic interpretation of the observed associations should be considered speculative and warrants further investigation.
Associations between leptin and lipid parameters were less consistent overall, although several significant relationships were observed in the high-protein groups. In the THP group, changes in leptin were significantly associated with changes in TG, whereas in the HP group significant associations were observed with LDL and HDL. No significant associations between leptin and lipid variables were identified in the RP or TRP groups. In addition, changes in total Chol were not significantly associated with leptin in any group. Collectively, these findings suggest that the relationship between leptin and lipid variables may differ across intervention conditions; however, the present analyses are associative in nature and do not permit conclusions regarding causality or the underlying mechanisms of these relationships.
The study by Zaman et al.(Reference Zaman, Abohashrh and Ahmad33) reported significant leptin reductions in a 12-week resistance exercise intervention. Their healthy adult participants showed reductions in blood lipid profile (TG, Chol and LDL) and a raised HDL alongside leptin reduction, which is contrary to our study. In another study, Mengi Çelik et al. reported that a TRE diet did not change either leptin or blood lipid profile significantly. Similarly, Moro et al. reported a significant change in leptin but non-significant changes in lipid profiles, even though their diet was high in protein.
Previous research has suggested that higher protein intake may influence satiety and leptin regulation(Reference Izadi, Saraf-Bank and Azadbakht34,Reference Mendoza-Herrera, Florio and Moore35) . Although previous research has suggested a potential influence of higher protein intake on leptin regulation, the present study did not assess leptin sensitivity directly. Consequently, no conclusions can be drawn regarding the effects of protein intake on leptin sensitivity.
Physiologically, leptin is closely linked to both adiposity and lipid metabolism. As an adipocyte-derived hormone, leptin regulates energy homeostasis and has been associated with lipolysis, fatty acid oxidation and hepatic lipid metabolism(Reference Fruhbeck, Mendez-Gimenez and Fernandez-Formoso36,Reference Jackson, Ahima, Fantuzzi and Mazzone37) . In healthy metabolic states, reductions in FM are typically accompanied by decreases in circulating leptin concentrations. The significant association between leptin and HDL observed in the HP group should be interpreted cautiously, particularly because similar associations were not observed across all intervention groups. The observed associations between leptin and lipid variables may reflect concurrent responses to changes in body composition and energy balance during weight loss rather than direct causal relationships. Previous studies have reported that alterations in leptin and lipid markers may occur simultaneously during periods of energy restriction and fat loss(Reference Bacchetti, Morresi and Simonetti38).
Therefore, the associations observed in the present study may represent context-specific responses to the intervention. However, the underlying mechanisms cannot be determined from the current data and require further investigation.
This study has several strengths. First, it examined the associations between changes in leptin, body composition and lipid profile variables within the context of combined dietary and RT interventions. Second, VAT was assessed using MRI, which provides a highly accurate and non-invasive measure of adipose tissue distribution. Third, the inclusion of RT novices reduced the potential influence of previous training adaptations and allowed clearer evaluation of intervention responses. Finally, the focus on young women with overweight provides clinically relevant information for an understudied population at risk of future metabolic complications.
Nevertheless, several limitations should be acknowledged. First, the final sample size within each intervention group was relatively small, which may have limited statistical power and the stability of regression estimates. Second, physical activity performed outside the intervention was not objectively monitored, and occupational activity levels may have influenced the observed outcomes. Third, dietary adherence relied primarily on self-reported records without objective verification, introducing the possibility of reporting bias. Sleep duration and sleep quality were also not monitored, despite their potential influence on hormonal regulation, metabolic responses and body composition outcomes. A particularly important limitation is that participants’ habitual eating windows were not recorded prior to the intervention. Consequently, it was not possible to determine the extent to which the prescribed TRE protocol differed from participants’ usual eating patterns. This may have influenced the magnitude of the metabolic and body composition responses observed.
Future studies with larger sample sizes are needed to confirm the present findings and improve the robustness and generalisability of the observed associations. In addition, future research should investigate the mechanisms underlying the relationships between leptin, body composition and lipid profile variables. Exploring the effects of early v. late TRE schedules and assessing appetite-regulating hormones at multiple time points throughout the intervention may also provide further insight into hormonal adaptations during weight loss.
Conclusion
This study examined the associations between changes in leptin, body composition and lipid profile variables following an 8-week intervention combining RT with TRE and either high- or regular-protein intake. Changes in leptin were significantly associated with changes in total FM in the THP and TRP groups, whereas no significant associations were observed with VAT or SAT. Associations between leptin and lipid variables were less consistent and varied across intervention groups. These findings suggest that changes in leptin may be more closely related to overall FM than to regional adipose tissue depots during weight loss. Further research with larger sample sizes is required to confirm these findings and clarify their clinical relevance.
Data availability statement
Further data supporting the findings of this study are available from the corresponding author upon reasonable request.
Acknowledgements
The authors extend their heartfelt appreciation to all participants for their commitment and valuable time devoted to this study. The authors are especially indebted to Zahra Bagharpour for her exceptional contribution to MRI image analysis and adipose tissue quantification. Their gratitude also goes to Ali Tavakoli for overseeing participant supervision during imaging sessions and to Ali Mohammad Ghasemi for his assistance in blood sampling and analysis. The authors sincerely thank Masoud and Soudabah Bagharpour for their unwavering moral and material support throughout the project. Finally, the authors acknowledge the staff of the Faculty of Sports Sciences at Kharazmi University for providing outstanding research facilities, including access to the gymnasium and clinical laboratories.
Designing study and conceptualisation: HA; Project administration, data collections, clinical trial, statistical analysis and writing – original draft preparation: FB; Supervision, writing – review and editing, critical revisions to the manuscripts and study content: HA; Technical assistance and administrative support, writing – review and editing: HR; Writing – review and editing: BIC. All authors have read and approved the final version of the manuscript.
The research was conducted independently of external funding.
No conflicts of interest were declared by the authors.