

Introduction
The Henan famine was the major Chinese famine of the Second World War. Estimates of famine deaths presented in recent publications range between one and five millions, on top of perhaps three million refugees who fled from Henan province into Nationalist-controlled areas to its west, or to Japanese and Communist-controlled territories to its north and east.Footnote 1 In addition to the human toll of the famine, it also had significant political consequences. The perception that the Nationalist government had neglected its duty to its citizens by providing insufficient relief to its starving citizens undermined the legitimacy of the Nationalist government, both internationally and within Henan itself. The famine formed an important social context for the pro-Japanese uprisings that accompanied the effective annexation of the province by Japanese forces in 1944, and helped the Chinese Communist Party to consolidate its position as a broad-based mass movement in the late years of the war.
Xia Mingfang, the leading social historian of natural disasters in Republican China (1912–1949), provides the following overview of the 1942 Henan famine:
Everyone has heard of the 1938 breaching of the dykes of the Yellow River at Huayuankou. However, most readers may not be familiar with the great famine that took place four years afterwards in the same area. In comparison to the Huayuankou breaching, this famine affected a greater area and had much graver human consequences. According to incomplete official sources, in the single province of Henan alone the number of people who starved to death amounted to over 3 million, three times the amount of people killed in the flooded regions of Henan and Anhui during the nine years of the [Huayuankou] breach.Footnote 2
As with a number of other brief accounts of the famine that have been published in China in the last 15 years, this paper draws primarily on descriptive sources by writers who experienced the famine first-hand.Footnote 3 The author cites news articles (including the famous Time article by Theodore White), memoirs and literary diaries written by eyewitnesses of the famine, as well as the official report compiled in the wake of the famine by the Chinese Communist government of the Shanxi-Hebei-Shandong-Henan border region.Footnote 4
Xia Mingfang lists many causes contributing to the famine, both natural (drought, locusts) and man-made (Japanese invasion, the deliberate flooding by the Nationalists of the Yellow River, harsh taxation policies).Footnote 5 To date, little attempt has been made to describe how these various contributing causes came together in the event of the famine, or even to describe systematically what happened. Xia refers, without citation, to ‘incomplete official sources’ to claim that the famine claimed ‘more than 3 million’ lives in Henan alone. The main source he had in mind was probably the propaganda report on the famine by the Communist border area government operating in Henan. The estimates found in most recent scholarship are generally in the range of 3– millions, generally unsourced or based on the estimates of eyewitnesses such as Theodore White, and always without reference to detailed demographic data. In contrast, the official survey conducted by the Nationalist government, the main administration at the time in Henan, estimated the famine toll to be 1.5 million lives.Footnote 6
It is difficult to gauge the relative significance of the factors posited as contributing to the famine without critical engagement with quantitative sources, or to compare the severity of this particular famine in relation to other famines that occurred in Henan and elsewhere during the twentieth century. Amartya Sen based his account of the Great Bengal famine of 1943 on the several hundred pages of statistical material compiled in the Famine Commission Report—data on the weather, crop yields, grain prices, wages and demographic trends. Such data, where available, might provide concrete answers to basic questions about the geographic extent of the Henan famine: was the famine limited to Henan, or did it affect all of north China, as was claimed by Xia Mingfang? Its relative severity: was it more or less severe at a local level than the Great Leap famine? The relative significance of its many contributing causes: was it caused by a decline in food availability, or a change in food entitlements?
The Henan famine, despite the lacuna of data in the secondary literature, is one of the better-documented famines of Chinese history. The Nationalist statistical agencies remained active during the war, and produced a broad range of data on the population, climate, agricultural conditions and price of goods in Henan, compiled from county-level statistical reports. These can be supplemented by information found in population censuses and retrospective fertility surveys. Whilst demographers generally doubt the quality of official population statistics (household registration data) for Henan during the wartime period, many other types of statistical data appear to be of reasonable quality. This paper draws on statistical data that is available in published form, which are sufficient to describe in broad terms the climatic, economic and even demographic trends during the period of the famine.Footnote 7
The statistical tallies of the 1942 famine carry political significance today. The death toll of ‘over 3 million’ cited by Xia Mingfang implies that the ‘Nationalist famine’ in Henan was quantitatively worse than the ‘Communist famine’ that occurred 15 years later.Footnote 8 Henan was one of the provinces most severely affected by the Great Leap famine of 1958–1961, and has since emerged as the favourite location for case studies of the political and economic causes of this later famine.Footnote 9 A more detailed understanding of the nature and causes of the 1942 Henan famine, as the last great famine before the victory of the Chinese Communist revolution, may help to place the Communist-era famine in historical perspective.Footnote 10
The 1942 Henan famine is also of comparative interest in relation to other famines that occurred in the later part of the Second World War. It shares several important characteristics with the contemporary Great Bengal Famine: the death toll was on a similar scale, with a similar wide range of uncertainty; it also occurred near strategically important areas on the front-line of Japanese-controlled territories when the Japanese military machine was at its most threatening; and it may have been precipitated by the same climatic phenomenon relating to aberrations in the Asian summer monsoon system.Footnote 11 Sugata Bose argued that the war-time famines in Henan, Bengal and Tonkin were linked by similar agrarian systems and a wartime political economy that conspired to deprive landless labourers of their customary food entitlements, despite no decline in the overall food availability.Footnote 12 This paper concurs with the first part of Bose's claim, but a closer look at weather and crop data clearly show that there was a severe decline in crop production in Henan 1942.
The following three sections examine in turn data on the climatic, agricultural and demographic conditions in Henan during the period of the famine. Each section opens with a representative passage from Zhang Gaofeng's news report published in Da Gong Bao in February 1943, with the title ‘A factual account of the Henan disaster’.Footnote 13 This was the most influential news report on the famine, and is what prompted Theodore White and a number of other foreign and Chinese journalists to make the journey to famine-affected areas and produce their own eyewitness accounts.Footnote 14 Zhang's report, though not necessarily impartial (its author was an underground Communist agent), drew upon interviews with Nationalist provincial officials and local notables directly involved in famine relief operations, and is found to be broadly consistent with the statistical record. The many other eyewitness accounts, official reports and memoirs of the famine will not be discussed here.Footnote 15
The Weather
In the spring, during the 3rd and 4th lunar months [of 1942], west Henan was devastated by hail storms and late frosts, southern and central Henan suffered extreme winds, and parts of eastern Henan were plagued by locusts. From the onset of summer, it did not rain anywhere in the entire province for three months. In late August there was rain, then no rain from the onset of autumn, at which point the drought hit home. At the time of the autumn harvest, there was still hope for the barley and wheat crop in western Henan when on the eve of the harvest a heavy frost struck suddenly before the fields could be flooded, and the entire crop was killed. Footnote 16
There are two extensive collections of Chinese weather data covering the period of the Henan famine. The first of these is found in the appendix of Maps of the Distribution of Flood and Drought over the past 500 years, a 1981 publication produced by the research arm of the China Bureau of Meteorology.Footnote 17 It provides long-run annual indices of agricultural conditions in 120 prefectures (diqu) across the territory of China. The second is a collection of monthly average temperature and precipitation data for 270 meteorological stations in the People's Republic of China, compiled under a joint initiative by the Chinese Bureau of Meteorology and the American Department of Energy.Footnote 18 Although neither of these sources provides reliable information on the severity of the hailstorms, extreme winds, locust plagues or unseasonal frosts listed by Zhang Gaofeng, the two sources together provide a clear picture of the severe drought conditions that prevailed during 1941 and 1942.
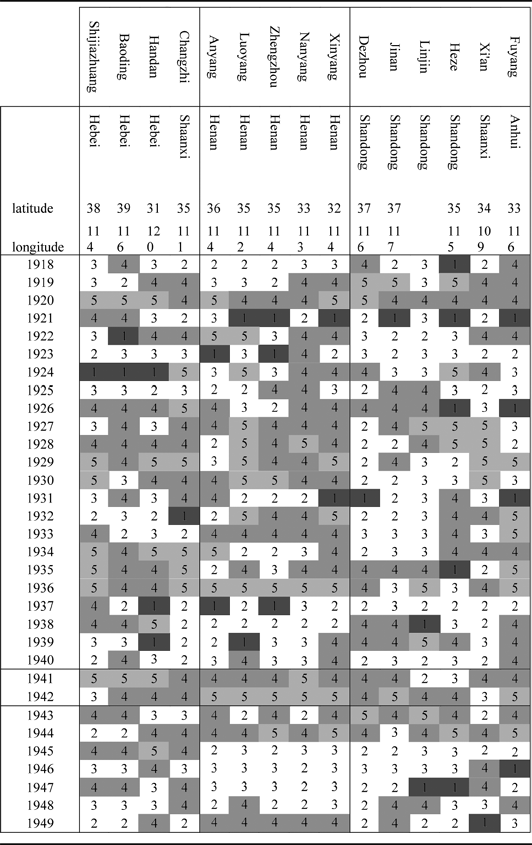
The agricultural indices were compiled for 120 prefectures based on verbal descriptions of crop and weather conditions gleaned from local gazetteers and other semi-official sources covering the period 1470 and 1949.Footnote 19 These verbal descriptions were converted into numerical grades from 1 to 5, with 1 denoting severe flood-related damage to crops, 5 denoting severe drought-related damage to crops, and the middle value of 3 given if the records showed that the weather was normal (neither too wet nor too dry) during the agricultural season.Footnote 20
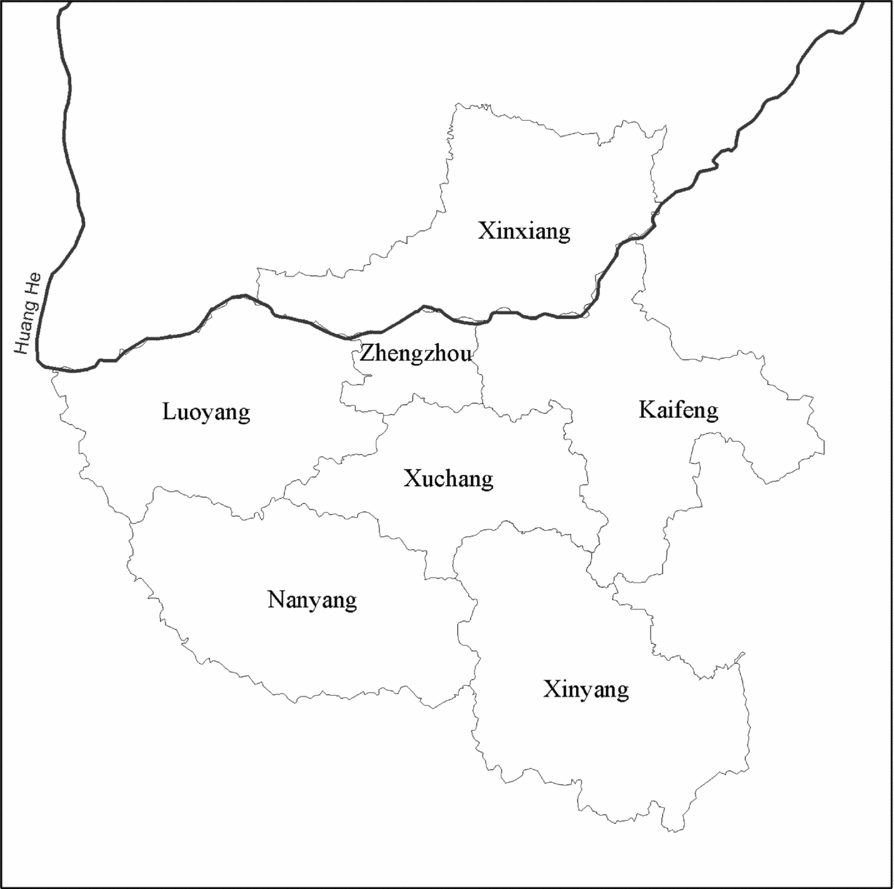
Henan is represented by five prefectures evenly distributed across the province. These are Anyang in the northeast, Zhengzhou and Luoyang in the north, Nanyang in the south and Xinyang in the southeast (see Map 1). The Henan prefectures have good coverage, all containing complete data for the entire Republican period with the exception of Nanyang, which is missing four years of data during the first decade of the Republic. The distribution of grades for the Henan prefectures is similar to that for the entire data set, though with a slightly higher proportion of years allocated an extreme drought grade. The indices for these five prefectures are highly correlated with each other: the correlation of any pair of prefectures within Henan over the five centuries covered by the data is above 0.3, with the exception of Anyang and Nanyang located in the far southwest and northeast of the province respectively (correlation of 0.26). As would be expected, the index for the most centrally located of the prefectures within the province, Zhengzhou, is most representative of those for the other prefectures (an average correlation of 0.5). The indices of a further eleven prefectures in neighbouring provinces also show an average correlation with the Henan prefectures greater than 0.3, and so are included in the analysis below.
Henan province, showing boundaries of prefectures in 1958. Source: Adapted from China Data Centre 1964 County Population Census GIS Map.

The data suggest that average conditions across the 120 stations were wetter than average during the Republican period, with 5 per cent more of the data falling in grade 1 (extreme wet) between 1912 and 1949 than the average for the entire 480 years. However, for Henan the situation was the opposite, with the distribution of grades heavily skewed to the two dry grades of 4 and 5. A similar pattern of exceptional dryness during the Republican period is evident for north China generally, though in the two Henan prefectures of Nanyang and Xinyang the percentage of dry years is greater than anywhere else, with almost 60 per cent of the years showing either grades 4 or 5.
It can be seen from Table 1 (below) that these dry years in Henan were concentrated between 1919 and 1945. For four of the five Henan prefectures, this period had more drought years than any period of corresponding length for which data is available. Xinyang is the most extreme, showing a long string of drought years punctuated by flood years in 1921 and 1931, with only four mild years (grades 2 or 3) in 1923, 1925 and 1937–1938. The years 1936 and 1942 stand out as being the only years, along with the Great North China drought of 1877, for which the indices for all five prefectures give a reading of 5. The severity of drought indicated in 1942 is compounded as it followed after a year in which all five prefectures suffered dry conditions (grades 4 or 5). Henan stands out as the driest province in China for these two years, especially in Nanyang prefecture, which is one of only two of the 120 prefectures that show two consecutive years of extreme drought in 1941 and 1942. (The other is Hanzhong, Shaanxi province, 500 kilometres west of Nanyang.)
Wet/dry index for prefectures in Henan and adjacent areas, 1912–1949.
Note: For an explanation of the 1 to 5 drought/flood scale used here, see main text above (p 8). Source: Central Bureau of Meteorology 1981.
It is possible that Henan in 1941–1942 did not experience such a concentration of dry years over an extensive geographic area as did the area of the North China Plain further north of Henan in 1935–1936, or a broad area of the North China Plain in 1927–1930 (during which Luoyang in Henan experienced four consecutive years of extreme drought). For a case of drought in Henan that was clearly worse than that of 1941–1942, we have to go back to the time of the Great North China Famine, when all the Henan prefectures included in the index show extreme drought conditions (grade 5) over two, and in some cases three, consecutive years.
The agricultural indices were compiled from written information on climatic and agricultural conditions found in local gazetteers. It is possible to return to the descriptive anecdotes in the gazetteers upon which the quantitative indices were based.Footnote 21 Su Liumin has done this for a number of the counties that make up Nanyang prefecture, and the anecdotes he collated for these counties support the conclusion that this prefecture at least suffered from extreme dry conditions in both 1941 and 1942. For example, the gazetteers for two of the counties in Nanyang prefecture record the following weather conditions for 1941 and 1942:
Nanzhao county:
1941 summer, severe drought; early autumn, the sorghum crop yielded 15–20 jin per mu [130-150 kg/hectare]
1942 spring, no rain; summer, no rain for three months; wells and ponds have dried up; crops withered, grass dead
Tanghe county:
1941 June to August, serious drought in the south of the county; total harvest failure for black beans and soybeans; sweet potato yields of 100 jin per mu [750kg/hectare]
1942 June to September, great drought; most crops withered; the people each grasses, roots and bark; sons and daughters being soldFootnote 22
The crop yields cited in these gazetteers are of the order of one-tenth of the provincial average for these crops in the pre-war years. These anecdotes suggest the summer rains (June to September), which normally make up over two-thirds of the annual rainfall in Nanyang, failed totally in both 1941 and 1942. Su Liumin also compiled agricultural indices for each of the counties in Henan over the Republican period, and the distribution of drought conditions indicated by this data is discussed in the demography section below (see Map 3).
Based on the evidence of the agricultural indices, Henan was the province worst affected by drought in 1941–1942. This was a drought on a comparable scale of severity to that experienced by other areas of the North China Plain during 1920–1921 and 1929–1930, but one not experienced in Henan itself since the Great North China Famine of 1877–1878. Whereas the agricultural indices are the most comprehensive, quantitative measure of climate conditions relevant to agriculture that exist for the Ming and Qing periods, for the modern period the indices compiled by the Central Bureau of Meteorology are for certain locations superseded by meteorological data. However, due to disruption of war, there are no published meteorological data that describe both temperature and rainfall trends at any location in Henan through the period of the famine.
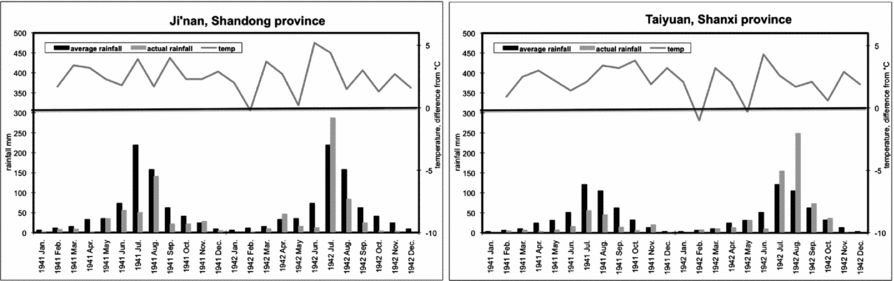
The Henan data included in the Carbon Dioxide Information Analysis Center series for the period are monthly temperature data for Anyang for the entire period of the famine and for Nanyang up to the end of 1941, and monthly temperature and rainfall data for four stations in provinces adjoining Henan (Xi'an, Shaanxi; Yunxian, Hubei; Taiyuan, Shanxi; and Ji'nan, Shandong). The story told by this meteorological data is that the growing seasons of 1941 and 1942 were exceptionally hot across north and central China, with average monthly temperatures for the eight selected stations consistently two degrees above the monthly average from March to September for both years. In both years June was the hottest month, a massive five degrees above the monthly average for some stations. The area of most extreme heat in 1941 appears to have been somewhat further south than that of 1942. In 1941, the station recording the greatest deviation from the monthly average was Xi'an (5.1 degrees above the June average), with temperatures at other stations on the same latitude almost as extreme. In 1942, the hottest stations of the seven selected were Ji'nan and Taiyuan, to the north of Henan, with the available Henan stations only slightly less extreme.Footnote 23 The temperature data show clearly that the spring and summer of 1941 and 1942 were unusually hot years in Henan, though Henan itself does not appear to have been exceptionally warm in the pervasive hot conditions experienced across north China.
As for rainfall conditions, the meteorological data indicate that there was a failure of the summer rainfall in certain areas of north China in both 1941 and 1942. In Henan, as in much of north China, two-thirds of the annual rainfall falls in the monsoon season between May and September, particularly concentrated in the months of July and August. Good rains during the early stage of the monsoon season allow for the planting of the summer crops (harvested in autumn), whilst good rains over the entire monsoon season allow for the planting of winter wheat (planted in autumn, harvested early the following summer). In 1941, all four of the stations considered here recorded below average rainfall for the year, ranging between two-fifths and three-quarters of the average amount. Taiyuan, the driest of the stations in 1941, received an almost negligible amount of rain in the first half of that year, and less than half the average in the wettest months of July and August. In 1942, rainfall was closer to the average for the year though distributed very erratically in time, with almost no rain in June (a crucial month for the summer crop), and very high rainfall in at least one month suggesting that much of the rain fell in the form of unusually violent summer storms.
No precipitation data is available for Henan for 1941 and 1942. The general rainfall trend is difficult to surmise in adjacent provinces because the geographic distribution of rainfall is much more erratic than temperature, especially in the summer months when rainfall in north China is predominantly delivered in the form of violent storms. In 1941, the summer monsoon rains failed at the stations to the north and east of the province but not at those to the south and west, whilst in 1942 they failed in the stations to the south, east and west but not in those to the north. This particular pattern leaves open the possibility that the zones in which the summer rains failed in each of the two years overlapped in Henan (and especially Nanyang prefecture). It is more likely that the distribution of rainfall across Henan in these two years followed a more erratic pattern, and that much of the rain that did fall across the province came in the form of particularly violent storms. Monthly rainfall and temperatures for Taiyuan and Ji'nan are illustrated below in Charts 1a and 1b—it can be seen that in these locations the temperature averaged two to three degrees above normal, and rainfall (light columns) was less than half the average (black columns) from the beginning of 1941 through to June 1942.
Monthly rainfall (with comparison to average, black columns) and temperature (difference from mean) for locations in two provinces adjoining Henan. Source: Carbon Dioxide Information Analysis Center.
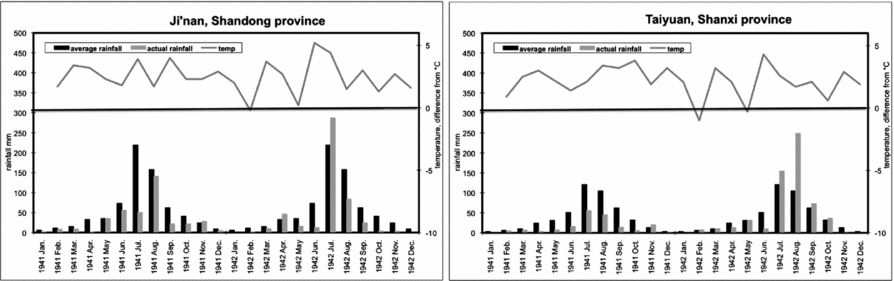
The available meteorological data, taken together with the agricultural data for Henan discussed above, suggest that the spring and summer of 1941 and 1942 were very hot across north China, and that in much of Henan the summer rain failed in both years. This is consistent with Zhang Gaofeng's account of the weather, which claims that the spring and summer rains failed in most of Henan in 1942 (though he says nothing of weather conditions in 1941).
Food availability
The unusually hot and dry weather conditions of 1941–1942 would be expected to have a significant negative impact on crop production. This section reviews the available data on crop yields, as well as further information on taxation and prices that determined how the food harvest was distributed.
The Nationalist government published a standard series of agricultural statistics covering the areas under their control from 1933 to 1947. Agricultural production data was reported by county-level officials, and then collated by the central government into the province-level data found in the Nationalist national statistical reports from which this data is taken. For the wartime years, two-thirds of the counties of Henan remained nominally under Nationalist control, encompassing a little under half the arable land of the province. The data discussed here refers to these counties under Nationalist control, and no data is currently available on conditions in the northern and eastern portion of the province under Japanese control.Footnote 24
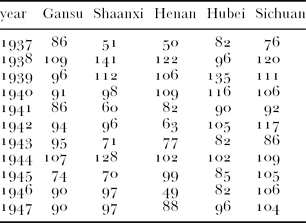
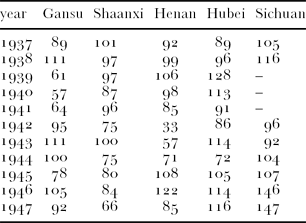
The Nationalist agricultural production data (see Table 2.1 and 2.2) shows that yields for the winter wheat crop (planted in the autumn of the previous year) were poor in Henan in 1942, further below average than for any of the other provinces under Nationalist control, though not as poor as they had been in either Henan or Shaanxi in 1937. Unlike in 1937, the Henan summer crop in 1942 failed spectacularly, with yields at only one-third the pre-war average. As the rural population consumed primarily the summer crop, whilst the winter wheat crop was either sold on the market or procured by the state, a failure of the summer crop would have been particularly detrimental to the welfare of the rural population. The poor yields experienced in 1942 were not isolated. In 1941, yields of both winter and summer crops were significantly below average. In 1943, the winter and summer crops were significantly better than those of 1942, though the summer crop was very poor. Yields approached normal level in 1944, and were above average in 1945.
Index of yield of wheat per sown area in several provinces under Nationalist control, 1938–1945 (1933–1936 average = 100).
Index of yield of summer crops (sorghum, millet and maize) per sown area in several provinces under Nationalist control, 1938–1945 (1933–1936 average = 100).
Source: Adapted from Xu Daofu 1983, pp. 19–22, 35–38, 54–57, 66–69, 70–73.
Based on anecdotal evidence, Lloyd Eastman stated that the spring (winter wheat) and summer crops of 1942 where 25 per sent below normal.Footnote 25 Sugata Bose claimed that Eastman's assertion was ‘not supported by available statistics and could be open to question’. Bose cited Nationalist official statistics to claim that in 1942 there was little, if any, shortfall in the major crops for the 15 provinces nominally under Nationalist control.Footnote 26 This allowed Bose to argue that the famine in Henan was primarily caused by a change in food entitlements rather than a decline in food availability, in line with Amartya Sen's analysis of the Bengal famine. The origins of the contrary assertions can be sourced to the crop yield data published by the Nationalist government shown in Table 2.1. Whilst reported yields in 1942 were slightly above the trend level when averaged across the provinces under Nationalist control, as Bose correctly states, the situation in Henan was clearly different.Footnote 27 Lloyd Eastman's claim of a fall of 25 per cent in the grain crop for Henan itself is consistent with the official estimate for the winter wheat crop averaged over the province as a whole, which in normal years represented 40 per cent of the total annual crop. If the exceptionally poor harvest of the summer crop is added to this, average crop yields in Henan in 1942 were in fact 40 per cent below the pre-war average.
A drop in yield of 40 per cent represents an extreme case of crop failure. This was the average for Henan province as a whole, which implies that the harvest in many counties were likely to have been just a fraction of their normal level. Bose's statement was technically correct but misrepresented the situation in Henan. As very little grain was traded between the inland provinces under Nationalist control, local grain availability was primarily determined by local crop yield.
If the climatic conditions of 1942 and the resulting harvest failure had occurred in peacetime, the population of Henan would have been faced with a dire situation. The wartime context made the situation markedly worse. Two factors relating to the war will be discussed here—heavy taxation by the Nationalist government and the collapse of the market for commercial crops.
Many anecdotal sources claim that in many counties of Henan, the Nationalist government levied a heavy grain tax throughout the period of the famine.Footnote 28 Zhang Gaofeng says that the government reduced Henan's grain tax quota for 1942 by one-quarter, but then applied unrelenting pressure to bring in this amount:
It is said that last year the government pressed hard [to get the grain tax in], holding people hostage in the county government's office for several days without food, giving them a good beating, and then sending them home with instructions that they must sell their land.Footnote 29
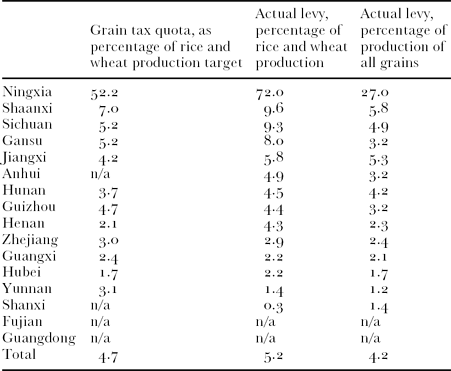
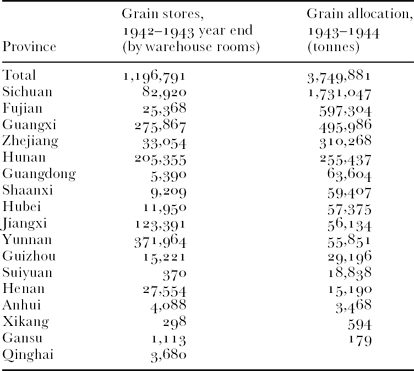
Official data on land tax revenue for the 1942 agricultural season is not available to corroborate Zhang's claims. Data for the 1943 agricultural season, which saw a partial alleviation in famine conditions, are available and show that the government fulfilled almost all the comparatively low tax quota allocated to Henan.Footnote 30 Whilstthis was not the only form of tax levied on grain production—there were also ‘procurements’ and grain ‘borrowings’ carried out by the Nationalist central government, and various local and military taxes not reflected in the central government revenue records—the grain tax rate for Henan was comparatively low, consistent with that of other provinces such as Zhejiang over which the Nationalist had weak control. The likely reason that the Nationalists did not provide any further tax relief in Henan during this famine year can be found in official data grain stores: at the end of the 1942 grain year (30 June 1943) grain stores were low, especially in Sichuan, the province with the heaviest concentration of government military and civilian personnel.Footnote 31
In Table 3 below, the grain tax quota and actual levied amount is given as a percentage of targeted and actual grain production. Actual collections of the grain levy shown here represent a little under 7 per cent of total wheat production for the year, whereas the average for most provinces was 10 per cent. This puts the allocated tax levy in Henan at substantially less than that of the core provinces under Nationalist control, but more than that of other contested provinces such as Anhui. The first column in the left shows a pattern that may reflect the rationale behind the Nationalist government's determination of the size of the grain levy. Overall, the targeted grain tax quota came to slightly under 5 per cent of targeted production of wheat and rice, and the amount actually collected was slightly over 5 per cent. The higher level of actual collections as a percentage of wheat and rice production is explained by actual production being substantially lower than expected (here 1943 was typical—the Nationalist government consistently forecast grain production to be 30–60 per cent higher than was realized during the wartime period), and the actual levy being substantially reduced from the targeted amount but not by as much as the shortfall in production. The pattern shown in the first column of Table 3 is that provinces under direct and stable Nationalist rule (Sichuan, Shaanxi, Gansu, Guizhou, Yunnan) had a high levy of around 5 per cent of targeted wheat and rice production, whereas those under indirect or partial rule (Hubei, Henan) had a lower levy of around 2.5 per cent.
Grain tax quota and actual levied amount, 1943, as percentage of grain production (ordered by actual levy as a percentage of rice and wheat production).
Source: Nationalist Bureau of Statistics 1944, Tables 105, 107, 78.
In addition to this grain levy, the budget of the Nationalist government also included grain ‘procurement’ and ‘borrowings’, which presumably covered military expenses.Footnote 32 The amount of grain collected under these tax categories is given in the 1943 statistical report for a list of 20 provinces, which for unknown reasons does not include Henan. These other forms of official taxation made a similar contribution to Nationalist government grain receipts as the grain tax levy. Assuming that the situation in Henan was similar to that of these other provinces, government taxes in Henan amounted to around 15–20 per cent of the crop. This is a large amount in normal years, and in 1942 even with the partial tax remission would have amounted to half of the wheat crop. In addition, local governments and the military applied further ad hoc taxes. The claim that heavy taxation was an important factor contributing to the famine is justified.
The total of the central government grain tax, procurements and ‘borrowings’ for 1943 was three and three quarter million tonnes, significantly less than the budgeted amount of five million tonnes.Footnote 33 At the end of the 1942 grain accounting year, there were 1.2 million tonnes remaining in grain stores. Whilst this may appear to be a reasonable level of stores, amounting to around three months of national grain distribution, a lot of this grain was warehoused in outlying areas of the territory under Nationalist control such as Hunan and Jiangxi (see Table 4). In particular in Sichuan, host to the Nationalist administrative capital that consumed almost half the government supply of grain, stores were down to just 5 per cent of the provincial allocation for the coming year, or two weeks’ supply. Grain stores outside Henan were low, and in addition the 300,000 government troops stationed within Henan needed to be fed, which helps to explain why the government was disinclined to offer more substantial famine relief in the form of tax remission.
Grain stores and allocations of the 1943 crop, in order of grain allocation.
Source: Derived from Nationalist Bureau of Statistics 1944, Tables 100, 106, 107, 108.Footnote 34
Heavy taxation reduced the amount of grain available to the civilian population of Henan. A second important factor depressing rural welfare levels is that the market for commercial crops such as cotton and soybean grown in the Nationalist-controlled areas of Henan was severely disrupted by war. Before the war, the main external markets for industrial crops grown in Henan, the most important of which was soybean, lay to the east. After the onset of war, the Japanese occupied the northeast corner of Henan where commercialization was most advanced, and farmers in the remaining portion of Henan under Nationalist control were left isolated. Data on prices obtained by producers in Henan is difficult to obtain, and when available are difficult to analyse given the lack of price stability in both Japanese and Nationalist territories during the war. (Annual inflation in Nationalist-controlled cities averaged over 200 per cent between 1941 and 1944.Footnote 35) However, some trends in the market for industrial crops can be taken from the proportion of sown area dedicated to industrial crops in Nationalist Henan.
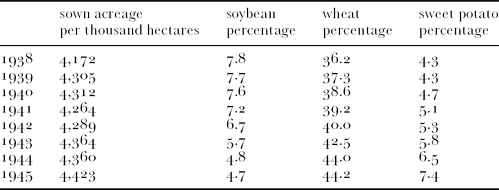
Table 5 below shows the percentage of total sown area dedicated to wheat, soybean and sweet potato. The reported sown area in Henan before the war was a relatively stable 9.4 million hectares, and between 1938 and 1945 ranged from 4.2 to 4.4 million hectares, representing a reduction of 55 per cent from pre-war level. This sown area data reflects the amount of territory nominally claimed by the Nationalist government during the wartime period, and does not reflect year-to-year fluctuations in the amount of territory in Henan over which it exerted effective control.
Percentage of sown area dedicated to various crops in Nationalist-controlled Henan.
Source: Adapted from Xu Daofu 1983, pp. 19–22.
During the wartime period, the area sown to the most important industrial crop, namely soybeans reduced steadily. The trend is less clear for other industrial crops such as sesame, tobacco and cotton.Footnote 36 Some of the area previously dedicated to soybean appears to have been taken up by wheat, the most heavily marketed of the grains. This does not mean that the rural population of Henan ate better—on the contrary, the fact that the area dedicated to sweet potatoe also rose steadily is strong evidence that the rural population were increasingly concerned about their food intake. Of the major food crops grown in China, sweet potato is traditionally the highest yielding in calorific terms but the least loved. The trend in sown area strongly suggests that the bottom fell out of the soybean market at least, and that farmers were forced by impoverishment to dedicate a greater portion of their land to low-quality, high-yielding food crops.
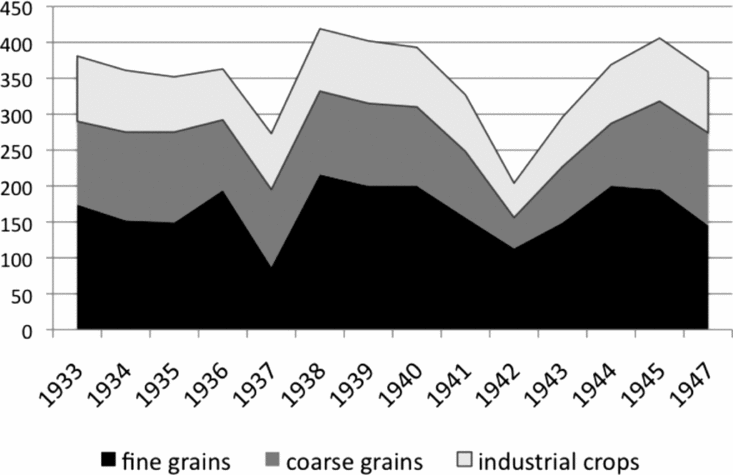
A rough calculation of grain availability in Henan can be made based on the agricultural production data introduced above. The data for the period 1933–1936 provide a basic measure of the relative prosperity and development trends in Henan in the period leading up to the Japanese invasion. Per capita grain production in Henan, assuming that the population density remained at the level of the 1936 census, varied between 100 and 120 kg of coarse grains (primarily consumed by the rural population), with 150–200 kg of fine grains (a large portion of which was marketed), and the equivalent of an additional 70–90 kg of fine grain in other industrial crops such as soybean and cotton (converted using pre-war average prices).Footnote 37 This amounted to a total of around 360 kilograms of fine grain equivalent per capita (see Figure 1).
Crop production, kg per capita.
Sources: Grain production data are taken from Xu Daofu 1983; these are divided by the Henan population at the time of the 1936 census (Ge Jianxiong 2001) modified by the total reported acreage in Xu Daofu 1983.Footnote 39 The value of industrial crops has been converted to fine grain equivalent using pre-war average prices (1933–1936).
Note: The data for 1938–1944 reflect only counties nominally under Nationalist control, accounting for roughly two-fifths of the arable land in Henan.
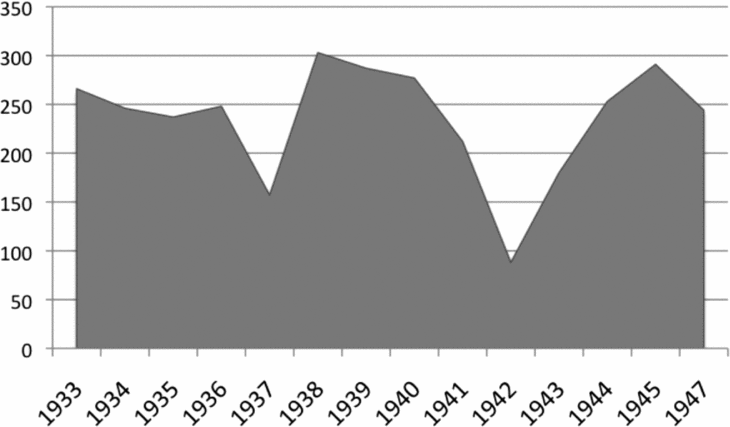
In 1937, total agricultural production fell to three-quarters of the pre-war average, but was followed by three above-average years (1938–1940). The 1941 crop was ten per cent below average, the 1942 crop more than 40 per cent, and the 1943 crop 20 per cent. In normal years, of the total agricultural production of 360 kg of grain-equivalent, a portion was collected from the tenant farmer as tax and a further portion as rent. Victor Lippit estimated that these various taxes and rent amounted to one-third of total production.Footnote 38 The trend throughout north China during the Republican period was for this to be measured against the production level in a normal year, rather than a percentage of the actual crop, and for landlords to be increasingly less inclined to forgive the debts of their tenants during a drought.Footnote 40 Lippit's estimate, if appropriate to Henan, would leave around 250 kg per capita of grain equivalent for the rural household in a normal year. This includes an amount to be retained as seed and feed, and further portions to be traded with the urban population or sold at distant markets. It can be safely assumed that this average of 250 kg per capita retained by the tenant farmer did not leave a large household surplus, and that substantial reduction from this level of food availability would quickly reduce the tenant farmer to starvation conditions.
Figure 2 shows that tenant grain availability fell two-thirds below the pre-war average of 1937, and to only one-third of pre-war average in 1942. This was following a below-average year in 1941 (15 per cent below normal), and was followed by another bad year (28 per cent below normal). Without tax and rent relief, the average tenant farmer was on a starvation diet, and the landless agricultural labourer was no doubt much worse off.
Estimate of grain availability for tenant farmers, kg per capita.
Source: Derived from data in Figure 1.
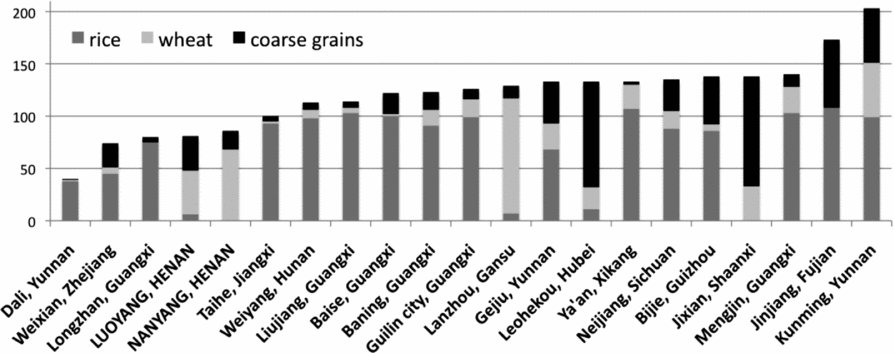
The discussion so far has been based on province-level grain production data, assuming the population remained constant at the 1936 level. The National Comprehensive Statistical Report published by the Nationalist Bureau of Statistics in 1944 includes a table listing grain consumption in select locations in the first half of 1943, the half-year period for which we would expect the famine in Henan to have been at its most severe. No information is available on how the survey was conducted, though the way the data are presented suggests that the statisticians were also working backwards from grain production estimates using county-level crop data and more up-to-date population data than those used in the analysis above. The table includes two precincts in Henan, namely Luoyang city and Nanyang county. The level of grain consumption here is compatible with the crude estimate of per capita grain production made above, showing 80 kg for the half year as against 200 kg for the full year, in my estimation. Lower figures are given for just two locations, one it would appear is due to inconsistencies in the data (namely Dali, in Yunnan, where grain consumption is given as less than a third of that in nearby counties of the same province). A measure of the long-term economic status of the county can by calculated from the table by taking the percentage of grain consumption made up of coarse grains, given in the right-hand column. This simple measure suggests that the two Henan counties, Luoyang and Nanyang, were poor but not worse off than the average of the counties sampled (Figure 3).
Official grain consumption data, kg per capita.
Source: Derived from county-level population and grain production data produced by the Survey Office of the Nationalist government, in Nationalist Bureau of Statistics 1944, Table 74.
For those who did not produce their own grain, such as rural day labourers, a more direct measure of food availability is the price of grain. Many of the newspaper accounts on the famine provide information on the price of grain, such as the following passage from Zhang Gaofeng:
The money that comes from selling a human being is not enough to buy four piculs of grain. A picul of wheat weighing 120 jin [60 kilograms] sells for 900 yuan, a picul of sorghum for 640 yuan, corn for 700 yuan, millet for ten yuan per jin, and steamed buns for 8 yuan per jin.Footnote 41
Here, as in most of the newspaper accounts, the figures quoted are local market prices at the time of the writer's visit to Henan, and in some accounts a pre-famine price is provided for reference. It is difficult to gauge what these cash prices mean due to the rampant inflation of the time, though the value given here for a servant girl of 240 kg of grain (the average amount consumed by one person in a year) does indicate clearly that grain was expensive. A time series of market prices of grain in various locations across Henan and other parts of China might give a clearer indication of the timing and severity of the crisis in Henan, but no such data have been published.Footnote 42
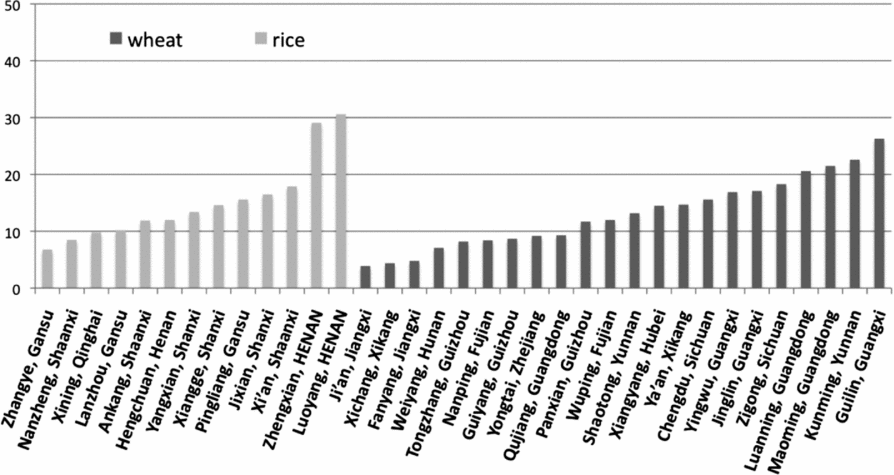
The National Comprehensive Statistical Report does include some price data confirming that Henan was worse off for grain than other areas under Nationalist control. Average prices for the calendar year 1943 are given for 23 rice markets and 13 wheat markets. The price of grain in markets proximate to large urban centres is generally twice or more than in remote counties of the same province, suggesting that there was some degree of grain scarcity in all the cities under Nationalist control, but the trend is sharpest in Henan. In the two cities given for Henan, Zhengzhou and Luoyang, wheat prices were 150 per cent greater than the average of the other 11 markets, and a similar amount above the average for rice markets in grain weight (see Figure 4). It also shows prices decreasing the further the location is away from Henan in any direction, such as westwards from Luoyang (Y30.6/kg) to Xi'an (17.9), Pingliang (15.6) and Lanzhou (10.2), or northwards to Jixian (16.5) and Yangxian (13.4).
Prices of grain in various cities, 1943, CNY per kg
Source: Nationalist Bureau of Statistics 1944, Table 75. Average of monthly prices for major grain markets, originally given in CNY per metric picul, converted to CNY per kg using conversion rates in Xu Daofu 1983.
Demography
Zhang does not provide a death toll, or even an estimate of the numbers of starving people, but instead makes a more general claim that the entire population of the province of 30 million people were suffering. This is consistent with the authors of many of the contemporary news reports, which rather than advertise a demoralizing death toll, instead gave an estimate of the number of people who could potentially die. For example, Theodore White in his Time article of March 1943 quoted an estimate of how many people would die before the summer harvest if relief failed to arrive:
Of Honan's 34 millions we estimated that there have been three million refugees. In addition, five million will have died by the time the new harvest is gathered.Footnote 43
This has been accepted in many recent publications as a credible estimate of the death toll, used by Xia Mingfang as the upper limit of his death toll for the famine of ‘3–5 million’. But it was an estimate of the number of destitute, not of famine deaths, and relief did in fact arrive primarily in the form of transport of refugees from the province and, a month after the publication of White's article, through substantial shipments of grain into the province from neighbouring Shaanxi.
The ‘we’ referred to by White probably was a reference to the foreign aid workers based in Henan, especially agents of the American Red Cross. The US Ambassador to China John Service provided more conservative estimates to the American State Department in November 1942:
Mr Service reports that supplies of food will be exhausted by the end of December, and that considerable suffering is expected until the harvesting of new crops in April or May of next year. According to Chinese estimates, 18 million people are affected by the famine, of whom 6 million require assistance and 2 million may starve; foreign estimates indicate that around 10 million are affected of whom 2 million are seriously affected. A large-scale movement of famine sufferers from Honan is creating a relief problem in Shensi province.Footnote 44
Both foreign aid workers and the Nationalist government thus estimated the number of those who might starve in the absence of relief at two million. Whereas the demographic sources that might be used to estimate the number of people that actually died are limited, they indicate that the number of deaths were well below this estimate of those reckoned to be ‘destitute’ in the winter of 1942–1943.
Whilst neither Zhang Gaofeng nor Theodore White remained in Henan to count the bodies, others tried to do so. A detailed survey organized by the Nationalist government in 1943 of the impact of the famine came up with a toll of 1,484,983 million, broken down by county.Footnote 45 The official population registers of Henan show a net decline in population from 1942 to 1943 of one million people, or 3 per cent of the population. If we assume that the natural rate of increase in the population before the famine was 2 per cent (as was the case prior to the outbreak of war, but not during the war), the resulting figure of 5per cent of the population or 1.7 million people is assumed after the famine. This is consistent with the official figure, and includes both fertility loss (decline in births due to the famine) and outward migration as well as excess deaths. Whereas no reliable data on migration is available, comparison with other famines would suggest that fertility loss and excess deaths would have made a similar contribution to total population loss, which means that the tally of excess deaths is likely to have been well under one million.Footnote 46
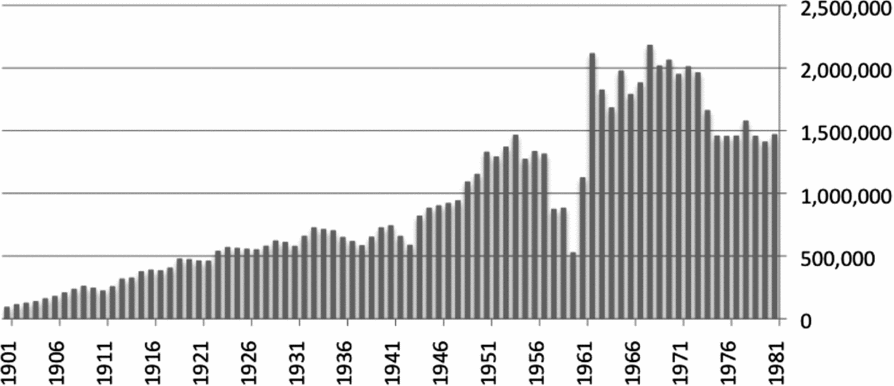
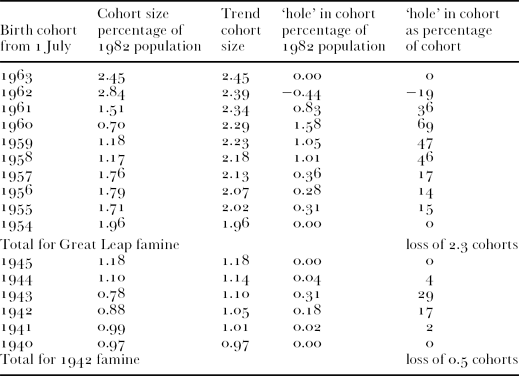
Without more detailed information on fertility and migration trends than are available from the contemporary population records, it is difficult to say much more about the death toll caused by the famine. An alternative, reliable measure of the general demographic impact of the famine may be derived from the relative size of age cohorts born during and immediately after the famine, as enumerated by later population censuses. The population tree of Henan as enumerated in the 1982 census is shown above in Figure 5.Footnote 47 The effect of the post-war and particularly post-1949 population boom is readily apparent. Also apparent are several ‘holes’ in the population tree, ages where the size of the cohort for a particular couple of years is much less than expected, given the trend in the size of nearby cohorts. In the Henan population of 1982, for example, the size of the population aged 21 at the time of the census (30 June 1982) is a quarter of those aged 19, and two-fifths of those aged 24. The four cohorts aged 20 to 23, who were born between 1 July 1958 and 30 June 1961, are radically underrepresented from that expected, if demographic conditions had remained stable. This is the legacy of the Great Leap famine, and was caused by a large decline in fertility and a significant increase in infant mortality during several years after 1958.
Henan population tree (1982 population census) Cohorts are of those born in the 12 months commencing 1 July of the year indicated.
Source: See Footnote 47.
Information from the population tree can be converted into a quantitative measure of the demographic impact of famine. Chinese census data is well suited to this type of modelling exercise, due to the fact that even poorly educated census interviewees in China tend to report their ages accurately (like their counterparts elsewhere in East Asia, but not in other parts of the developing world). The scale of the famine can be quantified by comparing the number of people born in the famine year with those born in a reference year. In the case of the Henan wartime famine, the size of the age cohorts born in the year from 1 July 1942 to 1 July 1943 is 17 per cent and 31 per cent below the trend level respectively, resulting in the loss of about half an age cohort.Footnote 48 This is a crude measure, reflecting primarily fertility fluctuations caused by the famine but also changes in infant mortality. Though crude, it is statistically reliable, is relatively unaffected by migration trends, and most importantly can be readily reproduced for any administrative district for which a breakdown of the census into single year age cohorts is available.
Geography
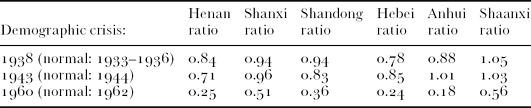
Comparing this measure of cohort loss across provinces, it is apparent that the 1942 drought had a greater demographic impact on Henan than on any other province of central and north China, though Shandong and Hebei also suffered from famine. The severity of the demographic shock of the 1942 famine in Henan was significantly greater than that of the drought of 1937 or of the social disruption caused by the Japanese invasion in 1937–1938. On the other hand, the demographic impact of the Great Leap famine in Henan was an order of magnitude greater than that of the famine in 1942 (Tables 6 and 7).
Estimate of cohort loss for Henan.
Source: Derived from Henan sheng renkou pucha bangongshi (Office of the Henan province population census), 1985.
Henan with provinces of central and north China affected by drought in 1942.
Source: Derived from Henan sheng renkou pucha bangongshi, 1985.
The cohort loss measure can also be used to examine variation in famine severity within Henan. Zhang Gaofeng described the regional profile of the famine as follows:
If we go by the different river systems, the area[s] adjacent to the Yellow river and around the Funiu Mountains have been most severely hit, the Hong, Ru and Luo river valleys slightly less so, and then the Tang and Huai river valleys.Footnote 49
This passage refers to the approximately 80 Henan counties under Nationalist control. Earlier in the article, Zhang described famine conditions in the counties of northeast Henan occupied by the Japanese as substantially worse, and those in some parts of Shandong province as worse still. This description, based on anecdotal evidence provided by Henan local officials and refugees, is broadly consistent with the measure of cohort loss in the rural prefectures into which Henan was divided in 1982.
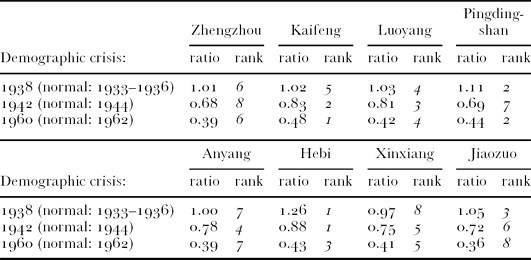
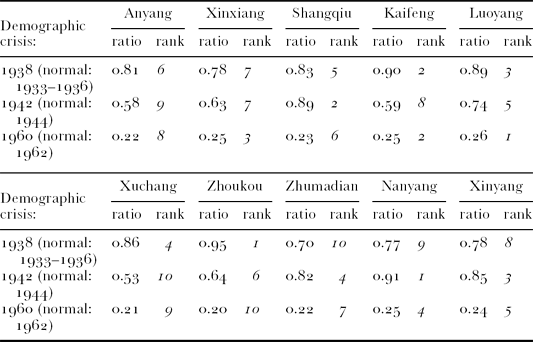
Tables 8.1 and 8.2 below show that the demographic shock caused by the drought of 1937 was limited to rural areas, and neither Nationalist-controlled cities nor those that fell to the Japanese appear to have suffered a sharp decline in food conditions. Following the 1942 drought, the rural bias of the resulting demographic crisis was reversed. The urban areas on average register a more severe demographic shock than the rural areas. Zhengzhou, the Nationalist city closest to Japanese-controlled territory, was particularly severely hit. Of the rural prefectures, those under Japanese control (Anyang, Xinxiang) appear to have been most severely affected by famine, as well as Xuchang located in the geographic centre of Henan.
Relative scale of three demographic shocks in 8 urban prefectures (shi) of Henan.
Relative scale of three demographic shocks in 10 rural prefectures (diqu) of Henan.
Source: Derived from Henan sheng renkou pucha bangongshi, 1985.
The analysis of cohort loss also clearly shows that the 1942 famine caused substantially less of a demographic shock in all urban and rural prefectures than that of the Great Leap famine.Footnote 50 Whilst the cohort loss measure cannot be translated directly into an estimate of famine mortality, analysis of cohort loss suggests that the severity of the 1942 famine in Henan (cohort loss: 0.31) was comparable with that of the least famine-affected provinces during the Great Leap famine (cohort loss in Heilongjiang: 0.29). This does not mean that welfare levels in Beijing in 1960 were comparable with those in Henan in 1942, but that the relative decline in welfare levels brought about by famine was similar. In Heilongjiang during the Great Leap famine, the reported crude death rate peaked at 27 per cent above the pre-famine level, resulting in excess deaths of less than half a per cent of the population.
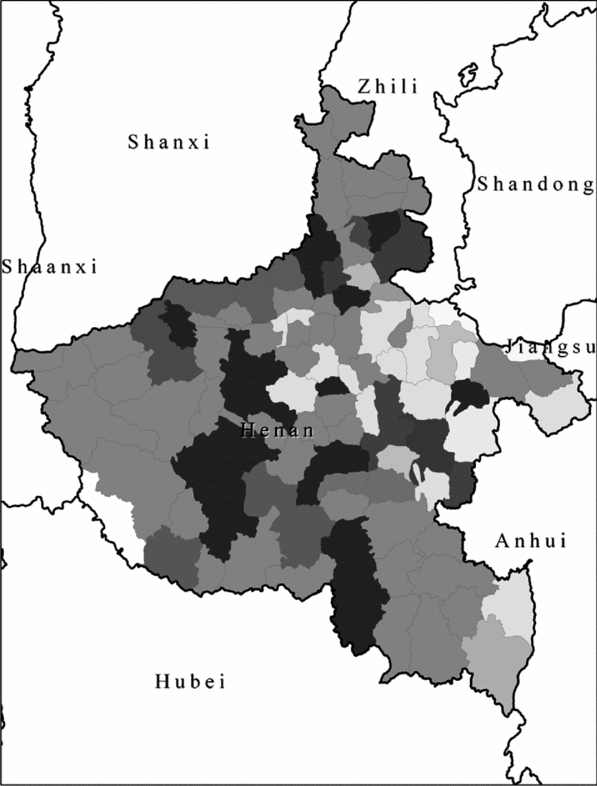
Impact of drought, 1941–1942; dark shades denote severe natural disaster in both years, lighter shades denote no flood/drought or mild flood/drought in only one of these years.
Source: Su Xinliu (2004).
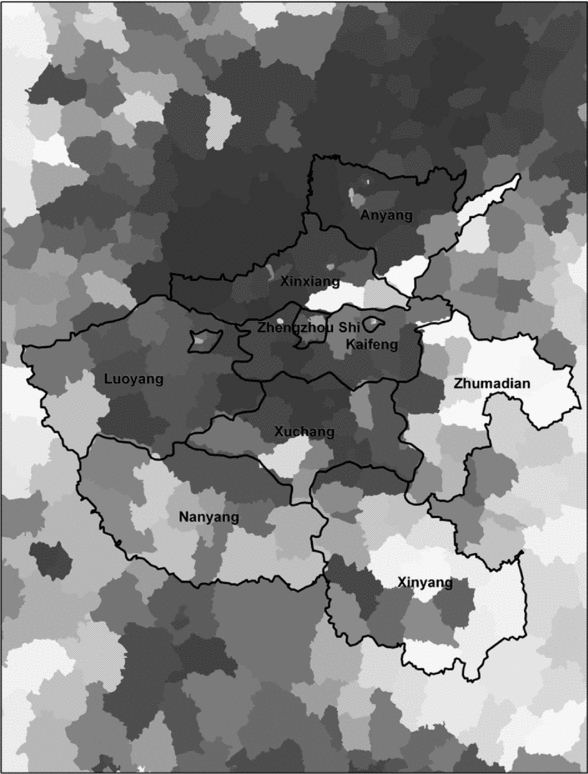
Analysis of cohort loss at county-level is also possible, using data from the 2000 census.Footnote 51 This can be used to produce a more detailed map of variation in famine severity within Henan and the geography of the famine (see Map 2). The map indicates that the demographic impact of the famine was greatest in the centre-north and centre of the province (dark areas of Map 2), whilst the west and south of the province where comparatively lightly affected. The impact of the famine, as measured by cohort loss, was negligible in the blocks of counties in the east and southeast of the province (light areas), as well as in a handful of counties along the Yellow River east of Zhengzhou. These trends evident on the map could be used to make certain claims about the effectiveness of famine relief. For example, the light shading for the southern prefectures of Henan bordering on Nationalist controlled territories suggests that proximity of a destination for refugees significantly reduced famine pressure. However, this would assume that the drought affected all areas of Henan equally, which may not have been the case.
Su Liumin compiled a rainfall index based on gazetteer anecdotes for each of the counties of Henan over the Republican period. A map showing the departure of the rainfall index from the average over the two years 1941 and 1942 is shown below. From this map, it is apparent that not all parts of Henan experienced the same severity of natural disaster. The counties least-affected by drought were located in the far east and southeast of the province. The worst-affected counties lay in a swathe north to south through the centre of the province, many of which reported two consecutive years of extreme drought where clearly less affected by the drought.
The broad pattern of variation in natural conditions (Map 3) is reflected in the map of the demographic impact of the famine (Map 2). Both the demographic impact and natural conditions were most severe in the central north-south section of the province, and were least severe in the far east of the province. However, there are significant differences between the two maps. Most importantly, the demographic impact shows a gradient of famine severity from north to south that is not apparent on the map of natural conditions. The wartime context of the famine provides a plausible explanation for this difference between the two maps. Central and northern Henan show up on Map 2 as having suffered varied natural conditions, but on Map 3 as having experienced consistently severe famine. It appears that in the counties occupied by the Japanese to the north of the Yellow River east of Zhengzhou and in the prefecture immediately to the south, social disruption or conflict caused by the war exacerbated the demographic impact of the famine. The demographic impact is less severe than might be expected from the severity of natural disaster for the three prefectures along the southern border of Henan, and here the possibility of fleeing Henan into Nationalist-controlled areas to the south and west appears to have significantly reduced the demographic impact of the famine.
Measure of cohort loss, 1942–1943; dark shades denote severe cohort loss, light shades denote mild or no cohort loss.
Source: See Map 4.
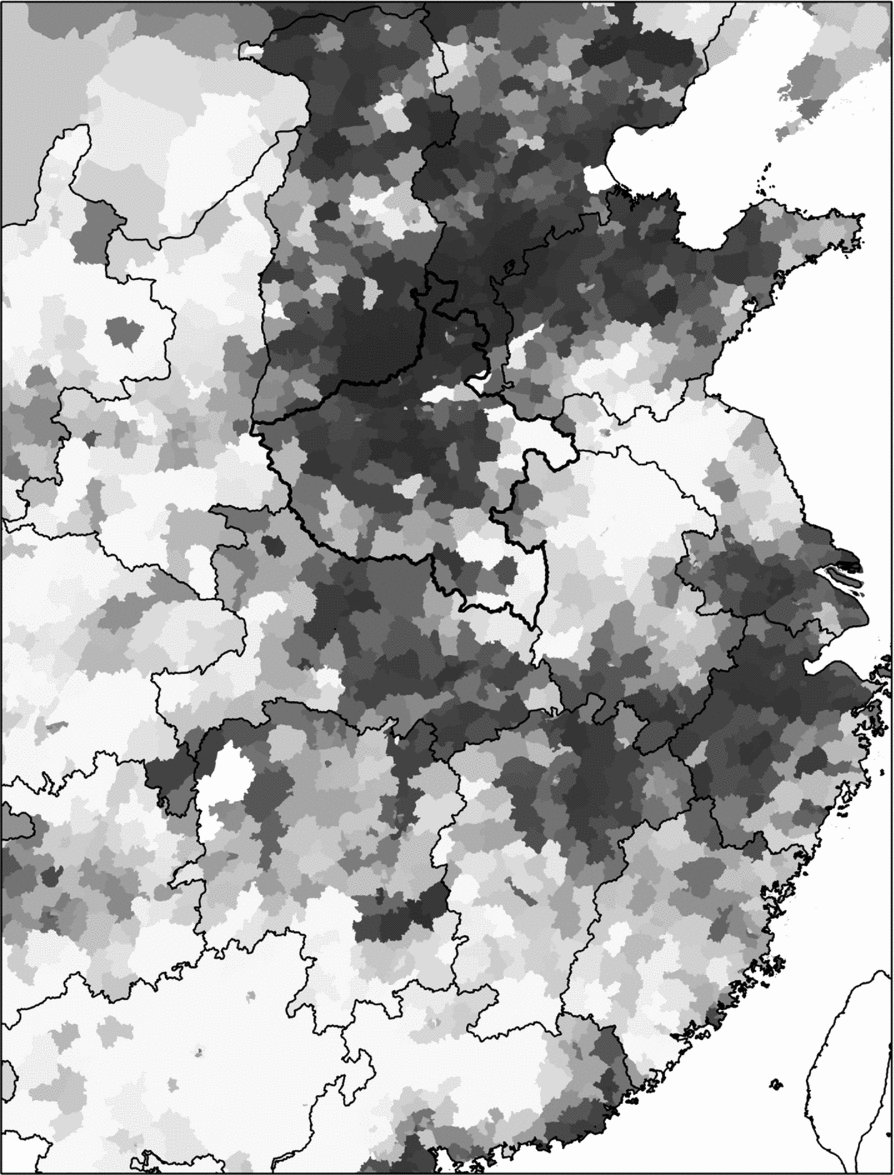
Finally, the same county-level measure of the demographic impact of famine is shown over a much larger area (see Map 4). It is immediately apparent that Henan was not the only place that suffered famine at the time. A greater proportion of Henan shows up red on this map than any other province, justifying this famine being popularly referred to as the Great Henan Famine of 1942’ it can be seen that the demographic impact of the famine in the counties of southern Shanxi and southern Hebei (both under Japanese control) were comparable to those in central and northern Henan. It is noteworthy that the populations of adjacent counties either side of the border between Shanxi and Shaanxi, and between north-central Henan and Shanxi, suffered during the famine to a similar degree, despite being governed by different regimes.
Relative size of the 1942 cohort compared with 1945–1948 cohorts.
Source: This map uses county-level data from the 2000 population census, made available by the China Data Center; the metric used is the size of the cohort enumerated in the 2000 census who were born between 1 July 1942 and 30 June 1943, as a ratio of the average number born in the three years between 1 July 1945 and 30 June 1948. The maps shows that much of north China and several other prefectures were affected by famine, but that conditions were most severe in the area encompassing central Henan, southern Shanxi and southern Hebei.
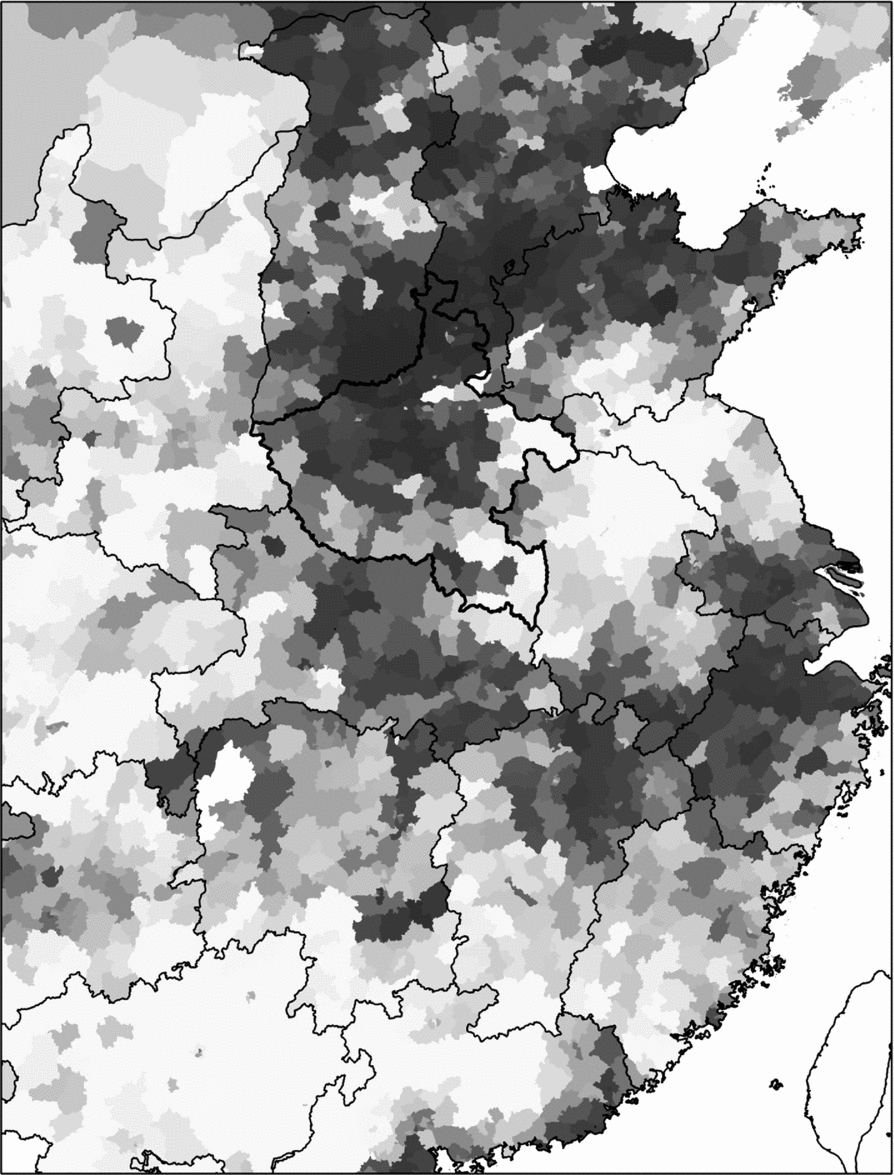
There also appears to have been severe famine in several smaller areas: in western Hebei, western Zhejiang, the western portion of the Shandong peninsula and the western bank of the Pearl River delta. These four areas are in the agricultural hinterland of the four main industrial cities of Occupied China, and are likely to have been the focus of efforts by the puppet government to keep these cities supplied with grain. The Japanese may be guilty of the same crime that the British in India have been accused of in relation to the Bengal famine, that of protecting key war industry areas at the expense of the welfare of the inhabitants of nearby areas.Footnote 52
Conclusion
The above discussion of published statistical sources allows for several unambiguous statements to be made about the Henan famine of 1942. Contrary to the claim of Sugata Bose that there was no substantial decline in food availability in the lead up to the Henan famine, it is clear that the direct cause of the famine was below-average crop yields in the years 1941 to 1943, and an especially poor harvest of summer crops in 1942. The poor harvests can be related to aberrant weather during 1941–1942, characterized by extreme heat across north China and erratic summer rainfall. Whilst rainfall data is not available from any meteorological stations in Henan for this period, it is likely that the summer monsoon rains failed in Henan in both 1941 and 1942, spectacularly so in 1942.
This would have given rise to famine in most circumstances, but the wartime situation compounded the human cost of the poor harvests in several ways. The war left the Nationalist-controlled counties of Henan cut off from what had been domestic and international markets to the east, depriving many farmers of a buyer for important cash crops such as soybean, and making the task of bringing grain into the province more costly and logistically more difficult. War priorities also meant that the Nationalist government was reluctant to release warehoused grain from neighbouring provinces, or to provide relief in the form of grain tax remissions. Given the constraints of war, the Nationalist government does nevertheless appear to have provided effective famine relief by facilitating the flight of refugees out of the province. A comparison of county-level data on agricultural conditions with the resulting demographic impact shows that people generally suffered in proportion to the severity of the agricultural conditions, though counties to the south of the province where the Nationalist government had a firmer grip on power appear to have weathered the crisis better than those in counties to the north of the province where power was either contested or in Japanese hands.
The statistical sources also affirm that the eyewitness reports are credible, especially the most influential of the eyewitness accounts by Zhang Gaofeng. The main point of contradiction between the available statistics and recent scholarly writing is over the scale of the death toll, though this is not the direct result of misreporting eyewitness accounts. The closest Zhang Gaofeng came to an estimate of the death toll was the opening statement of his article that, ‘Today in Henan people gather in their thousands and tens of thousands to eat the bark of trees, as the leaves have already been eaten’.Footnote 53 Theodore White wrote in the spring of 1943 that ‘five million will have died by the time the new harvest is gathered’, a number based on the much lower estimate of American aid workers of the number of people left destitute, and later reflected that ‘probably. . .two or three million had died’.Footnote 54 Though White did not stay to count the bodies, his inflated forecast of how many people might die has often been cited as a conservative estimate of the toll. A team of Nationalist officials compared household registration figures from before and after the famine to produce an estimate of the famine toll of slightly over 1.5 million. Comparison with the diminution in the size of age cohorts born during the famine years suggests that the official Nationalist figure includes population loss through excess mortality and declined fertility migration, which leaves a famine death toll of well under 1 million. By the same cohort loss measure, the Henan famine of 1942 was an order of magnitude less severe than the famine in Henan province during the Great Leap Forward, a decade and a half later.
Given the severity of the harvest shortfall and the backwardness of transport infrastructure in Henan at the time, it is remarkable that the demographic impact of the famine was as limited as it was.Footnote 55 Whilst the war certainly did not help matters, by reducing the scope of the operation of markets, disrupting transport infrastructure and making the state more cautious in opening grain warehouses to provide relief, available famine coping mechanisms such as the flight of refugees must have been reasonably effective. A more comprehensive understanding of what these coping mechanisms were may be possible in the future based on the copious archival materials produced by the war-time Nationalist, Communist and Japanese governments, and through more sophisticated use of demographic data such as the Nationalist population censuses and retrospective demographic surveys conducted in the 1980s.Footnote 56