Introduction
Public opinion and health institutions are becoming increasingly alarmed by the illegal use of hormones for increased growth and slaughter performance (Courtheyn et al., Reference Courtheyn, Le Bizec, Brambilla, De Brabander, Cobbeart, Van de Wiele, Vercammen and De Wasch2002). Consumers are primarily concerned for their own safety; public health authorities are also apprehensive about animal welfare. Given that growth promoters are currently banned within the European Union, the Report of the Scientific Committee on Animal Health and Animal Welfare (SCAHAW, 2001) did not identify illegal treatment as a potential risk factor for beef cattle welfare. Data from control plans conducted at the national level, however, show that illegal growth promoters are still being administered to fattening bulls. Residue controls conducted at Italian farms and slaughterhouses found percentages of samples positively targeted for corticosteroids of 0.66 and 1.08, respectively (Italian Ministry of Health, 2005).
As previously observed by other authors (Van der Wal et al., Reference Van der Wal, Berende and Sprietsma1975; Istasse et al., Reference Istasse, De Haan, Van Eenaeme, Buts, Baldwin, Gielen, Demeyer and Bienfait1989; Courtheyn et al., Reference Courtheyn, Le Bizec, Brambilla, De Brabander, Cobbeart, Van de Wiele, Vercammen and De Wasch2002), the non-therapeutic use of dexamethasone affects beef cattle growth performance and carcass traits, while its effect on hormonal, haematological and biochemical parameters is still unknown. Broom (Reference Broom1988), however, reported that the administration of exogenous corticosteroids to animals may trigger an adaptation process that might lead to significant alterations in metabolism and blood parameters.
The potential modification of haematological and endocrine parameters induced by treatment could be used to identify illegally treated animals at the farm level and subsequently confirmed by treatment residue investigations in organic matrices. Moreover, changes in beef cattle blood parameters caused by the administration of low-dosage dexamethasone also indicate animal welfare levels.
Material and methods
In accordance with Decreto Legislativo n. 116/1992 (1992), the Italian Ministry of Health authorized this study following the submission of a detailed description of the experimental plan by the project’s scientific coordinator.
Animals and housing
In this study, we used 15 finishing Marchigiana bulls with average body weight of 487 ± 14.9 kg housed in five pens of three animals each.
Nine animals in three pens were considered the Control group. One of these bulls was excluded from the experiment at day 30 because of an ocular trauma. The total number of animals considered for data collection was therefore 14. The remaining six bulls (Dexa group) were treated daily with 0.75 mg/head of dexamethasone per os (Desashock®; Fort Dodge Animal Health SpA, Bologna, Italy). The treatment period started on day 5 and was suspended on day 53, i.e. 3 days prior to slaughter. Further description of the experimental design and treatments, housing system and feeding management are reported in Gottardo et al. (2008).
Blood sample collection and analysis
Individual blood samples were taken from the jugular vein on day 6, 27, 48 and 56. Blood was collected in the morning prior to diet administration, and placed in four separate vacutainer tubes (Becton Dickinson, Meylan Cedex, France), each one dedicated to a specific set of analyses described below.
Test tubes of 10 ml containing K3EDTA were used for the collection of the samples submitted to haematological profile determination. The analyses were performed using a Cell Dyn 3500® automated analyzer (Abbott Laboratories; Abbott Park, IL, USA). A specific software for bovine blood was utilized to achieve total white blood cell counts (WBC) and differential leukocyte counts, and to evaluate the proportion of different leukocyte types divided in neutrophils (NEU), lymphocytes (LYM), monocytes (MONO), eosinophils (EOS) and basophils (BASO). The neutrophil/lymphocyte ratio (Neu/Lym) was also considered. Parameters correlated to red blood cells (RBC), such as haemoglobin concentration (HGB), haematocrit (HCT), mean corpuscolar volume (MCV), mean corpuscolar haemoglobin (MCH), mean corpuscolar haemoglobin concentration (MCHC) and red cell distribution width (RDW), were investigated, as well as total platelet counts (PLT) and mean platelet volume (MPV).
Blood specimens were collected in heparinized test tubes to detect oxidative stress index glutathione peroxidase (GPx) using a commercial kit (Ransel, Randox Laboratories Ltd, Crumlin, Co. Antrim, UK).
Serum samples, obtained after clot formation in tubes without anticoagulant and centrifugation at 2500 × g at 20°C for 10 min in a refrigerated centrifuge, were used to determine total antioxidant status (TAS) using a commercial kit (Total Antioxidant Status; Randox Laboratories Ltd). Both parameters (GPx and TAS) were automatically analyzed using a BM Hitachi 911 analyzer (Roche, Basel, Switzerland).
The haematic concentration of adrenocorticotrophic hormone (ACTH) was analysed by means of a commercial kit (LKAC1, Medical System, Genoa, Italy) in plasma obtained from K3EDTA tubes that were centrifuged at 1500 × g at 4°C for 15 min.
Cortisol concentration was determined in serum blood specimens using a commercial kit (LKCO1; Medical System). Both hormones (ACTH and cortisol) were quantified by chemiluminescent immunometric assays performed with the automated analyzer, Immulite One (Medical System).
Total serum proteins were measured by a colorimetric assay with biuret reagent (TP; Roche) using the automated BM Hitachi 911 analyzer (Roche), while the concentration of albumin and α, β and γ globulin fractions was measured using an automated electrophoresis apparatus Hydrasis LC (Sebia, Issy-les-Moulineaux, France) on 0.8% agarose gel (Hydragel 30 Protein; Sebia).
Test tubes of 5 ml containing Na citrate were used to collect blood samples for fibrinogen determination. Tubes were centrifuged at 1000 × g at 4°C for 15 min and plasma was then separated to measure the fibrinogen concentration and coagulation time with an appropriate commercial kit (HemosIL™ Fibrinogen-C; Instrumentation Laboratory, Barcelona, Spain). The analysis was performed with the automated coagulometer ACL 7000 (Instrumentation Laboratory).
Statistical analysis
Experimental data were submitted to statistical analysis using a linear model within PROC-GLM of SAS (1990). The model considered the effects of treatment, animal within-treatment, sample collection day, and the interaction between treatment and sample collection day. The effect of treatment was tested using animal within treatment variance as the error term. Means differences were considered statistically significant at P < 0.05.
Results
Endocrine parameters
Bulls treated with dexamethasone showed significantly lower haematic cortisol concentrations than Control animals (5.7 v. 42.3 nmol/l; s.e.d. = 4.17). A significant treatment per sample collection day interaction (Figure 1) showed the peaking of cortisol concentration in the Control group, occurring in the first 2 days of sampling, before falling to the constantly low level of the bulls treated. Regardless of the day of sampling, however, the average cortisol concentration in the Dexa group was always very low in the vicinity of the instrumental detection threshold (5.5 nmol/l). Another significant treatment per sample collection day interaction was regarding ACTH concentration (Figure 1). In the Control bulls, ACTH levels were higher at first sampling and then decreased, while the bulls treated showed a significant peak after 48 days.
Plasma concentration of cortisol (s.e.d. = 4.17) and adrenocorticotrophic hormone (s.e.d. = 21.00) in Control bulls (–●–) and in animals treated with dexamethasone per os (- -□- -) from day 5 to day 53 of the trial. **Least square means within sampling day are significantly different for P < 0.01. ***Least square means within sampling day are significantly different for P < 0.001.

Haematological profile
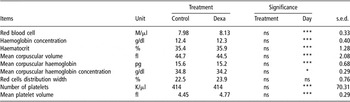
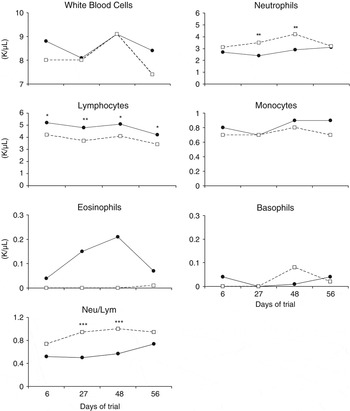
Dexamethasone administration provided no significant effect on the variables regarding erythrocytes such as RBC, HGB, HCT, MCV, MCH, MCHC and RDW, or platelets such as PLT and MPV (Table 1). As shown in Figure 2, dexamethasone treatment did not affect the concentration of several leukocyte parameters, such as WBC, MONO, EOS or BASO. Instead, the lymphocytic count was always lower in the Dexa group than for the Control bulls. Neutrophil concentration showed an opposite trend until the third sampling day, whereas at the last collection, performed 3 days after the suspension of treatment, no further difference was detected between the two groups. Treated animals showed an increase of the Neu/Lym ratio, which was significantly higher at 27 and 48 days of trial (Figure 2).
Haematological profile in Control bulls and in animals treated with dexamethasone per os (Dexa)

No significant differences were observed for treatment × day of sampling interaction.
ns = Least square means within row are not significantly different.
*Least square means within row are significantly different for P < 0.05.
***Least square means within row are significantly different for P < 0.001.
Plasma concentration of white blood cells (s.e.d. = 0.74), neutrophils (s.e.d. = 0.44), lymphocytes (s.e.d. = 0.38), monocytes (s.e.d. = 0.14), eosinophils (s.e.d. = 0.06), basophils (s.e.d. = 0.01) and neutrophils/lymphocytes ratio (s.e.d. = 0.13) in Control bulls (–●–) and in animals treated with dexamethasone per os (- -□- -) from day 5 to day 53 of the trial. *Least square means within sampling day are significantly different for P < 0.05. **Least square means within sampling day are significantly different for P < 0.01. ***Least square means within sampling day are significantly different for P < 0.001.

Oxidative parameters
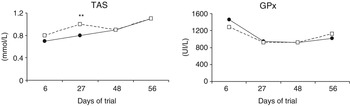
Although corticosteroid treatment had no effect on GPx concentration (Figure 3), a significant treatment per sample collection day interaction was observed for TAS as a result of the increased concentration measured in the Dexa group at sampling day 27 (Figure 3).
Plasma concentration of total antioxidant status (TAS; s.e.d. = 0.04) and glutathione peroxidase (GPx; s.e.d. = 82.03) in Control bulls (–●–) and in animals treated with dexamethasone per os (- -□- -) from day 5 to day 53 of the trial. **Least square means within sampling day are significantly different for P < 0.01.

Serum protein profile
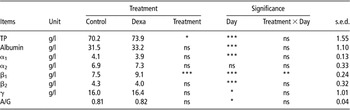
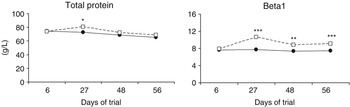
Significant differences between the Control and Dexa groups were observed for a number of serum profile parameters (Table 2). Total serum protein concentration increased in bulls receiving treatment at the second sampling day (Figure 4). Regarding β1 globulins, apart from the first sampling performed the day after treatment began, there was difference between the two groups showing another significant treatment per sample collection day interaction (Figure 4). The remaining variables were not modified by treatment, and in most cases, only a sample collection day effect was observed (Table 2).
Serum protein profile in Control bulls and in animals treated with dexamethasone per os (Dexa)

TP = total protein; A/G = albumin/globulin ratio.
ns = Least square means within row are not significantly different.
*Least square means within row are significantly different for P<0.05.
**Least square means within row are significantly different for P<0.01.
***Least square means within row are significantly different for P<0.001.
Serum concentration of total protein (s.e.d. = 1.55) and β1 globulin fraction (s.e.d. = 0.24) in Control bulls (–●–) and in animals treated with dexamethasone per os (- -□- -) from day 5 to day 53 of the trial. *Least square means within sampling day are significantly different for P < 0.05. **Least square means within sampling day are significantly different for P < 0.01. ***Least square means within sampling day are significantly different for P < 0.001.

Coagulation parameters
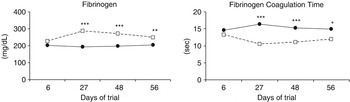
Fibrinogen concentration was significantly higher in the Dexa group from the second sample collection day until the end of the experimental period, and this explains the significant treatment per sample collection day interaction (P < 0.05) observed (Figure 5).
Plasma concentration of fibrinogen (s.e.d. = 32.70) and fibrinogen related coagulation time (s.e.d. = 1.93) in Control bulls (–●–) and in animals treated with dexamethasone per os (- -□- -) from day 5 to day 53 of the trial. *Least square means within sampling day are significantly different for P < 0.05. **Least square means within sampling day are significantly different for P < 0.01. ***Least square means within sampling day are significantly different for P < 0.001.

Fibrinogen coagulation time was lower in the animals treated and statistical differences occurred from the second sample until the end of the experimental period (Figure 5).
Discussion
A daily oral low dosage (0.75 mg/head) administration of dexamethasone to beef cattle has been shown to modify certain blood parameters used as animal welfare indicators (Broom and Johnson, Reference Broom and Johnson1993). Such treatment has been observed to lower the production of endogenous cortisol below physiological values in bovine species (Kaneko et al., Reference Kaneko, Harvey and Bruss1997) and this result is consistent with those obtained by Cagnasso et al. (Reference Cagnasso, Dotta, Aria, Monti and Prato1987) in calves, by Lopes et al. (Reference Lopes, Claus, Lacorn, Wagner and Mosenthin2004) in growing pigs and by Allersmeier et al. (Reference Allersmeier, Abraham, Schusser, Hoppen and Ungemach2005) in horses using pour-on posology. Dexamethasone, acting as endogenous cortisol, inhibits hypothalamus and hypophysis activities (Sacher and McPherson, Reference Sacher and McPherson2000), exerting a negative effect on ACTH secretion (Rijnberk and Mol, Reference Rijnberk and Mol1997). Low haematic cortisol levels usually indicate high-quality animal welfare and suggest satisfactory animal ability to cope with the surrounding environment (Moberg, Reference Moberg1985). This theory could not be applied in this study, however, because dexamethasone as a long-term stressor would have impaired adrenal function and animal welfare in consequence.
Moreover, both Cagnasso et al. (Reference Cagnasso, Dotta, Aria, Monti and Prato1987) and Allersmeier et al. (Reference Allersmeier, Abraham, Schusser, Hoppen and Ungemach2005), working, respectively, with calves and horses, described a negative effect on ACTH levels ascribed to dexamethasone administration. This effect was not unequivocally observed in our study, in which a significantly decreased ACTH concentration in the Dexa group was observed only on the first sampling day.
Considering erythrocyte and platelet variables, in this study their mean values fell all within the reference ranges (Kramer, Reference Kramer2000) in both treated and untreated animals. Several authors reported that short-term stressors such as transport, lairage at the slaughterhouse and slaughtering procedures have been shown to affect erythrocyte-related parameters in cattle (Dunn, Reference Dunn1990; Chacon et al., Reference Chacon, Garcia-Belenguer, Villarroel and Maria2005; Tadich et al., Reference Tadich, Gallo, Bustamante, Schwerter and van Schaik2005). If the prolonged low dosage dexamethasone administration used in this study is considered a long-term stressor, changes in these parameters would be logically expected in the bulls treated. No alteration in RBC parameters was observed, but this might be ascribed to either the low-dosage adopted or animal adaptation to the frequent handling required for daily oral corticosteroids administration. For this reason, haematological parameters do not appear to be a suitable welfare status indicator for cattle exposed to long-term stress. This hypothesis is also supported by Gupta et al. (Reference Gupta, Earley, Ting and Crowe2005), whose results did not show significant alterations in steer haematological parameters when animals were subjected to frequent re-penning and re-grouping.
Activation of the hypothalamic–pituitary–adrenal (HPA) axis has been shown to weaken the immune system and this could have a significant impact on animal welfare through the hyperactivity of the adrenal cortex (Raussi et al., Reference Raussi, Boissy, Andanson, Kaihilahti, Pradel and Veissier2006). As a corticosteroid, dexamethasone affects the HPA axis (Rijnberk and Mol, Reference Rijnberk and Mol1997), and several studies conducted on cattle and veal calves have shown that such molecules might lead to leukocytosis, neutrophilia, eosinopenia, lymphopenia and monocytosis, as well as to an increase in the Neu/Lym ratio (Lan et al., Reference Lan, Reddy, Chambers, Walker, Srivastava and Ferguson1995; Anderson et al., Reference Anderson, Watson and Colditz1999; Thanasak et al., Reference Thanasak, Jorritsma, Hoek, Noordhuizen, Rutten and Müller2004). Oldham and Howard (Reference Oldham and Howard1992) have shown that daily intramuscular injections of dexamethasone at 0.5 mg/kg per day in calves for 20 days resulted in neutrophilia and lymphopenia. In our study, the administration of Dexa per os at a low dosage led to a higher Neu/Lym ratio as a consequence of an increased number of neutrophils and a significant decrease of lymphocytes, even if their absolute values are in the physiological range reported by Kramer (Reference Kramer2000). The reversal of the leukocytic formula demonstrates that exogenous corticosteroid treatments can produce effects similar to those caused by environmental stress (Allen et al., Reference Allen, Pringle and Smith2000).
Neutrophil concentration seems to respond to dexamethasone treatment because it decreased in the Dexa group to the same level as that measured in Control bulls 3 days after the suspension of treatment. This result supports previous findings observed in calves by Lan et al. (Reference Lan, Reddy, Chambers, Walker, Srivastava and Ferguson1995), who demonstrated that the neutrophil count returned to physiological levels 3 days after the last 0.04 mg/kg injection of dexamethasone.
The limited effect of dexamethasone on both oxidative stress parameters considered in this study (GPx and TAS) might be explained by the animal’s attempt to maintain the balance between plasma pro-oxidant and antioxidant constituents (Miller et al., Reference Miller, Brzezinska-Slebodzinska and Madsen1993; Bourdon and Blanche, Reference Bourdon and Blanche2001), which implies a dynamic response. For this reason, GPx and TAS do not appear to be useful biochemical tools for the detection of cattle treated illegally by corticosteroids.
Confirming previous findings in dairy cows by Furll and Leidel (Reference Furll and Leidel2002), dexamethasone administration to the experimental bulls increased their total serum protein concentration. Our study showed that the highest levels of total protein in treated bulls might be related to the increase of β1 globulin fraction. This parameter might be affected either by the higher concentration of fibrinogen, an inflammatory acute phase protein stimulated by dexamethasone acting as a stressor or by an increase in other acute phase proteins (Sevaljevic et al., Reference Sevaljevic, Macvanin, Zakula, Kanazir and Ribarac-Septic1998; Sorrells et al., Reference Sorrells, Eicher, Harris, Pajor and Richert2007).
Conclusion
This study conducted on a large number of physiological parameters proposed as indicators of cattle welfare found that only a few are significantly affected by the low-dosage administration of dexamethasone. The main alterations induced by treatment were decreased cortisol concentration to the sub-physiological level, the reversal of the leukocytic formula, and increased total serum protein promoted by β1 globulins and fibrinogen levels. All these parameters appear useful in identifying suspected illegally treated bulls at the farm level. Other blood variables such as erythrocyte-related parameters or neutrophil counts were either unaltered by treatment or returned rapidly to physiological levels after suspension of treatment.
Low-dosage dexamethasone administration for a prolonged period of around 50 days produced chronic stress conditions and left evident metabolic traces in the bulls tested. Beef farmers should therefore take notice that illegal non-therapeutic dexamethasone treatment during the finishing period is easily detectable and can be confirmed by treatment residue investigations in organic matrices.
Acknowledgements
This study was financed by the Italian Ministry of Health. The authors are grateful to Dr Cristiano Ossensi, Mr Roberto Rampazzo and Mr Roberto Chimetto for their precious technical support.