Introduction
Major depressive disorder (MDD) is recognized as one of the most common and complex psychiatric disorders (Fried & Nesse, Reference Fried and Nesse2015; Kossakowski, Gordijn, Riese, & Waldorp, Reference Kossakowski, Gordijn, Riese and Waldorp2019). This disorder is characterized by feelings of sadness that affect a person's mood and behavior. Other physical functions such as appetite and sleep problems are also common. People with MDD often lose interest in things they typically enjoy and find it difficult to perform their daily activities. They may question whether life is worth living and contemplate possibly harming themselves (suicidal thoughts). Thus, MDD symptoms may not only be debilitating to the individual, but potential consequences (e.g. stigmatization and interpersonal rejection) can impact long-term physical and mental health. In fact, MDD is not just a psychiatric disorder but also a chronic illness that causes many physical ailments. People from different socioeconomic backgrounds, people of differing ages, ethnicities, and minorities are vulnerable to this disease. MDD imposes a heavy burden on the individual and has severe personal, social, and economic consequences and costs. Moreover, MDD is a leading cause of death, especially in young people, who end their lives by suicide (Kupferberg, Bicks, & Hasler, Reference Kupferberg, Bicks and Hasler2016; Reddy, Reference Reddy2010).
The severe consequences of MDD and the fact that it affects ~17% of the world's population at some point in their lives make it one of the major concerns for mental health services (Greden, Reference Greden2001; Van Borkulo, Reference Van Borkulo2018). Global studies indicate that MDD has been one of the leading mental health burdens since 1999 (Whiteford, Ferrari, Degenhardt, Feigin, & Vos, Reference Whiteford, Ferrari, Degenhardt, Feigin and Vos2015). According to predictions of the World Health Organization (WHO), MDD will be recognized as the main cause of disability worldwide by 2030 (World Health Organization, 2003). Data from WHO also indicate that approximately one million people die from suicide every year, the majority of which are people affected by MDD (World Health Organization, 2008).
Though MDD is prevalent in various parts of the world, treatments are still developing and only partially effective. Many experts in this field admit that we do not yet fully understand the pathogenesis of MDD and haven't been able to answer the following question: ‘What makes some people vulnerable to developing MDD?’ (Van Borkulo, Reference Van Borkulo2018). While there are numerous interventions available for MDD, and there is substantial evidence that they are effective in reducing symptoms severity, data show that more than 30% of all cases of MDD do not improve adequately after their first treatment (Kamenov et al., Reference Kamenov, Cabello, Neito, Bernard, Kohls, Rumme-Kluge and Ayuso-Mareos2017). Though the lack of early detection and timely treatment has been considered as the main reason for MDD's continuous burden (World Health Organization, 2008), the limited robust results of MDD treatment have raised concerns of whether the current methods for assessing and analyzing MDD are sufficient or should be improved (Kamenov et al., Reference Kamenov, Cabello, Neito, Bernard, Kohls, Rumme-Kluge and Ayuso-Mareos2017; Van Borkulo, Reference Van Borkulo2018; Whiteford et al., Reference Whiteford, Ferrari, Degenhardt, Feigin and Vos2015).
During the last decade, network modeling has been proposed as a viable approach for representing and analyzing psychiatric constructs (Borsboom, Reference Borsboom2008; Borsboom & Cramer, Reference Borsboom and Cramer2013; Cramer, Waldrop, Van Der Maas, & Borsboom, Reference Cramer, Waldrop, Van Der Maas and Borsboom2010; Schmittmann et al., Reference Schmittmann, Cramer, Waldrop, Epskamp, Kievit and Borsboom2013). The network perspective views the co-occurrence of observed indicators (i.e. symptoms) as a mereological part-whole relationship rather than one of measurement. This perspective does not consider observed symptoms as reflective indicators that ‘measure’ a construct but instead views the conditional partial correlations among the symptoms as the primary source of information to be analyzed (Borsboom, Reference Borsboom2008). The network approach defines psychiatric constructs as interconnected systems of observed indicators that mutually influence each other without introducing unobserved latent variables into the representation. By conceptualizing the symptoms of psychiatric disorders such as MDD as networks, an alternative way is available to characterize and understand the nature of these debilitating clinical disorders.
In network analysis, the relative importance of each symptom in the overall network can be quantified using different centrality indices (Hevey, Reference Hevey2018). High centrality symptoms are likely to have strong and numerous connections with other symptoms, whereas those with low centrality will tend to be located on the periphery of the network and have fewer and weaker connections (Robinaugh, Millner, & McNally, Reference Robinaugh, Millner and McNally2016). Symptoms with high centrality may have greater clinical relevance since it is assumed that activation of a highly central symptom may serve as a triggering mechanism for other symptoms in the networkFootnote †Footnote 1. Therefore, identifying such potentially influential symptoms may help in developing clinical interventions and inspire future research (Borsboom & Cramer, Reference Borsboom and Cramer2013; McNally, Mair, Mungo, & Reimann, Reference McNally, Mair, Mungo and Reimann2017b; Van Borkulo et al., Reference Van Borkulo, Borsboom, Epskamp, Blanken, Boschloo, Schoevers and Waldorp2014). However, several recent studies have raised concerns and cautions about the use and interpretation of centrality indices when network analysis is applied to psychological data (Bringmann, Reference Bringmann2016; Bringmann et al., Reference Bringmann, Elmer, Epskamp, Krause, Schoch, Wichers and Snippe2019; Epskamp, Reference Epskamp2017; Epskamp, Borsboom, & Fried, Reference Epskamp, Borsboom and Fried2018a; Robinaugh et al., Reference Robinaugh, Millner and McNally2016). As centrality measures were originally developed for social networks where nodes and connections can be easily identified, it is not clear to what extent these indices can adequately applied to psychological networks where connections need to be estimated from data. Therefore, other measures for evaluating the relative importance of symptoms, such as the expected influence (Robinaugh et al., Reference Robinaugh, Millner and McNally2016) and predictability (Haslbeck & Fried, Reference Haslbeck and Fried2017), have been recommended. In summary, centrality indices should be interpreted with caution in the context of psychological networks. Here, the centrality indexes are further investigated using Bayesian network results.
Most studies have used undirected network models to assess psychiatric disorders and constructs. According to undirected networks, it is not possible to infer the direction of relationships between nodes in such networks. For example, it is hard to tell whether symptom X predicts (or possibly causes) symptom Y, vice versa, or both (McNally, Heeren, & Robinaugh, Reference McNally, Heeren and Robinaugh2017a). To address this issue, a specific kind of directed network, known as Bayesian network (BN), has been proposed (McNally et al., Reference McNally, Heeren and Robinaugh2017a, Reference McNally, Mair, Mungo and Reimann2017b). BN is a probabilistic model equipped with algorithms capable of learning the underlying causal graphs from data (Moffa et al., Reference Moffa, Catone, Kuipers, Kuipers, Freeman, Marwaha and Bebbington2017). BNs can be used to identify the directional relationships among nodes in a network (Pearl, Reference Pearl2000). Due to BN's ability to provide a network structure with directed connections among nodes, BN can complement the more popular undirected networks in the context of psychological networks. BNs have been recently used to explore psychological disorders (Bird, Evans, Waite, Loe, & Freeman, Reference Bird, Evans, Waite, Loe and Freeman2018; Briganti, Scutari, & Linkowski, Reference Briganti, Scutari and Linkowski2021; Cernis, Evars, Ehlers, & Freeman, Reference Cernis, Evars, Ehlers and Freeman2021; Kuipers, Moffa, Kuipers, Freeman, & Bebbington, Reference Kuipers, Moffa, Kuipers, Freeman and Bebbington2019; Moffa et al., Reference Moffa, Catone, Kuipers, Kuipers, Freeman, Marwaha and Bebbington2017). Unlike undirected networks, BNs estimate and incorporate information about the possible direction of the conditional dependence relationships between variables. Researchers have begun to use this information to develop more refined hypotheses about possible causal relationships (Cernis et al., Reference Cernis, Evars, Ehlers and Freeman2021). Although BN should be used and interpreted with appropriate caveats and caution in the context of mental health data, it can also serve as a valuable exploratory method capable of visualizing and quantifying complex dependencies in the data (Robinaugh, Hoekstra, Toner, & Boorsboom, Reference Robinaugh, Hoekstra, Toner and Boorsboom2019).
In this paper, we used both undirected and directed networks to investigate the connectivity of the MDD symptoms in a population-based sample of female-female twins. Using these network models, the primary focus of this study was to identify those symptoms that are most central to the network connectivity structure as well as the possible directional relationships between MDD symptoms. This would help to identify potential tailored interventions. This is the first study to investigate the network structure of last year MDD symptoms in a large female-female twins subsample of VATSPSUD data using both undirected and directed network models. In the case of undirected networks, correlation networks were applied to a subsample of VATSPSUD data before (Cramer, Borsboom, Aggen, & Kendler, Reference Cramer, Borsboom, Aggen and Kendler2012).
Materials and Method
Sample
Data for this study came from ‘the Virginia Adult Twin Study of Psychiatric and Substance Use Disorders’ (VATSPSUD), an extensive data collection of multiple cohorts of twins and their parents (Kendler & Prescott, Reference Kendler and Prescott2006; Prescott, Aggen, & Kendler, Reference Prescott, Aggen and Kendler2000). The network analyses present here draw on data from N = 2163 American Caucasian female-female twins that were part of the initial VATSPSUD data assessment protocol. This general population-based female-female sample was followed-up longitudinally for a total of four-time points of non-overlapping one-year assessment periods. In this paper, we used data collected at the first time pointFootnote 2. In this VATSPSUD sample, each twin was queried about the presence or absence of each of the 14 disaggregated MDD symptoms. All N = 2163 participants were asked to provided responses to all 14 symptoms. These 14 disaggregated symptoms and the 9 aggregated symptoms are summarized in Table 1.Footnote 3 Symptoms were assessed using structured clinical interviews following the DSM-III-R. The Structured Clinical Interview for DSM Disorders (SCID) is a semi-structured clinical interview used to gather information about MDD symptoms and classify individuals as affected or unaffected. For collecting data on MDD symptoms, twins were asked to report whether they experienced any of the 14 disaggregated symptoms, for a period lasting at least 5 days, over the year prior to the interview date. Symptom information is recorded in a binary format (0 = not present, 1 = present). Additional detailed information was collected about whether each symptom interfered with the twins' daily lives and/or whether the symptom might have been the result of a physical illness or taking medication. Also, to ensure that symptoms occurred temporally together rather than being haphazardly experienced over the prior year, twins were asked via a follow-up question to confirm that the symptoms they endorsed over the past year were indeed experienced together. No skip-outs were used for this section of the interview.
Description of the VATSPSUD sample 14 disaggregated MDD symptoms

The sample proportions of the MDD symptoms are presented in Table 2. This basic descriptive information may be useful since some previous studies (e.g. Rodebaugh et al., Reference Rodebaugh, Tonge, Piccirillo, Fried, Horenstein, Morrison and Heimberg2018) have suggested that the most prevalent symptoms may be more informative rather than those with the highest centrality index values. Here, we presented the MDD symptoms prevalence alongside the centrality indices of symptoms to further investigate the results of centrality analysis.
The prevalence of MDD symptoms in VATSPSUD data

Note. See Table 1 for symptom abbreviation descriptions.
Statistical methods
Analyses were conducted using two different network models. First, we applied an Ising network model to estimate an undirected network whose edges represent conditional associations among the binary symptom nodesFootnote 4 (Dalege, Borsboom, Harreveld, & Van Der Mass, Reference Dalege, Borsboom, Harreveld and Van Der Mass2017; Van Borkulo et al., Reference Van Borkulo, Borsboom, Epskamp, Blanken, Boschloo, Schoevers and Waldorp2014). In the graphic representation of networks, an edge's thickness indicates the magnitude of the association between two nodes. Due to the large number of estimated parameters in a network, some edges may be false-positive that are unlikely to be replicated. To address this potential drawback, the network model can be estimated using regularization, which allows the user to set a penalty parameter that constrains the number of estimated node connections that will be retained in the final network model. Following Van Borkulo et al. (Reference Van Borkulo, Borsboom, Epskamp, Blanken, Boschloo, Schoevers and Waldorp2014), we used the eLasso methodology to impose sparsity. A sparse network accounts for the conditional dependencies among nodes while trying to minimize the number of false-positive edges (McNally et al., Reference McNally, Mair, Mungo and Reimann2017b). Regularized optimization seeks to identify only the strongest node connections, thus those links that may represent candidates for genuine and potentially causal connections between nodes. We used the R packages IsingFit (Van Borkulo et al., Reference Van Borkulo, Borsboom, Epskamp, Blanken, Boschloo, Schoevers and Waldorp2014) to estimate the regularized undirected networks and qgraph (Epskamp, Cramer, Waldorp, Schmittmann, & Borsboom, Reference Epskamp, Cramer, Waldorp, Schmittmann and Borsboom2012) to visualize the networks. The default settings of IsingFit have been used to obtain the regularized networks (Van Borkulo, Reference Van Borkulo2016).
To quantify the relative importance of each node in the network, several centrality indexes were computed. These centrality indexes capitalize on different information to summarize how nodes can relate to one another in the network. In the qgraph package, there are several centrality metrics including strength centrality, betweenness centrality, and closeness centrality (Epskamp et al., Reference Epskamp, Cramer, Waldorp, Schmittmann and Borsboom2012). Strength centrality for each node is calculated by summing the weights of all edges connected to that node. Betweenness centrality is an index of the number of times that a node lies on the shortest path between two other nodes. Closeness centrality indicates the average distance of a node from all other nodes in the network. Among these three measures, the strength centrality is considered to be the more appropriate one (McNally et al., Reference McNally, Heeren and Robinaugh2017a, Reference McNally, Mair, Mungo and Reimann2017b). It is also possible to draw a centrality plot using the qgraph package. This plot displays the standardized values of the three centrality metrics side-by-side enabling an easy comparison of nodes (symptoms) across these different centrality measures. To evaluate the stability and reliability of the calculated network, we used the R package bootnet (Epskamp et al., Reference Epskamp, Borsboom and Fried2018a). Using bootstrap simulations, we computed 1000 bootstrapped networks. We then checked the reliability of centrality metrics and the accuracy of edge weights based on these simulated networks.
In the second analysis, we estimated a Bayesian network (BN) using the hill-climbing algorithm in the bnlearn package (Scutari, Reference Scutari2010). The resultant BN is displayed as a Directed Acyclic Graph (DAG). The hill-climbing algorithm is one of several different scoring algorithms that can be used to learn or estimate BN structures. Structure learning of BN is achieved by creating different network structures from data. During this iterative process, a structure that is most consistent with the data is selected. This algorithm learns the BN structure from data based on 50 restarts and 100 permutations. To ensure the stability of the network derived from the iterative learning process, we then ran a bootstrap simulation study by generating 1000 samples with replacement, computing a network for each sample, and then averaging across these networks to obtain the final network. This process entails two steps. First, it is determined how often an edge appears in the 1000 bootstrapped networks. An edge that appears in at least 85% of the bootstrapped networks is retained in the final, averaged network. This process results in a sparse DAG, which depicts only those edges that are likely to be genuine. Second, the direction of each edge in the 1000 bootstrapped networks is evaluated. An edge that runs from symptom X to symptom Y in at least 51% of the bootstrapped networks remains in the final, averaged network (Benfer, Bardeen, Spitzer, & Rogers, Reference Benfer, Bardeen, Spitzer and Rogers2021; McNally et al., Reference McNally, Heeren and Robinaugh2017a, Reference McNally, Mair, Mungo and Reimann2017b; Scutari & Nagarajan, Reference Scutari and Nagarajan2013; Ucak, Reference Ucak2021).
To determine the network structure and specify which edges should remain in the BN, we followed the guidelines suggested by Scutari and Nagarajan (Reference Scutari and Nagarajan2013). They have developed a statistical method based on sensitivity (i.e. retaining ‘true’ edges) and specificity (i.e. rejecting ‘false’ edges). Their method leads to a sparse network with high values of sensitivity and specificity measures.
Results
Ising network model
An undirected network was estimated via an Ising model whereby edges represent conditional associations between symptoms (Fig. 1). In the resulting graph, the thickness of each edge indicates the magnitude of association between any two symptoms. Blue lines and red lines depict positive and negative associations, respectively. The estimated network node connectivity can also be presented as a weight adjacency matrix (Table 3). The number of rows and columns of a weight adjacency matrix equals the total number of nodes in the network. Values in each cell of the matrix display the edge weights between nodes. Each value below the diagonal indicates an edge from the node in the given column to the node in the given row. Since the network is undirected, the weight adjacency matrix is symmetric. The diagonal values represent self-loops of the nodes, which are all equal to zero because self-loops cannot be estimated in cross-sectional data modeling (Dalege et al., Reference Dalege, Borsboom, Harreveld and Van Der Mass2017). The strongest symptom associations are shown in Fig. 1 as well as Table 3.
Undirected Ising network model of connectivity between pairs of symptoms. Each symptom is represented as a node (circle) in the network and edges between symptoms represent conditional dependencies. The thickness of each edge indicates the strength of the association between symptoms. Blue-colored and red-colored edges denote positive and negative connections, respectively. Symptom abbreviation information is presented in Table 1. The spring layout function was used to generate the network graphic.

Weight adjacency matrix from the estimated Ising network model.

Note. See Table 1 for symptom abbreviation descriptions.
Figure 2 is a plot of the standardized centrality metrics for strength, closeness, and betweenness.Footnote 5 The symptoms with the highest strength centrality are depressed mood (dm), significant decrease in appetite (ad), were uninterested/unable to enjoy things (li), felt tired or fatigued (tf), and trouble sleeping nearly every night (sl), respectively. The symptoms with the highest betweenness centrality are depressed mood (dm), significant decrease in appetite (ad), significant increase in appetite (ai), and felt tired or fatigued (tf), respectively. Also, the symptoms with the highest closeness centrality are depressed mood (dm), were uninterested/unable to enjoy things (li), and thought about death/ harming self (td), respectively. The depressed mood symptom had the highest positive values across the centrality metrics. This shows the importance of depressed mood symptom in the estimated network, which is consistent with DSM-5 guidelines on MDD (Black & Grant, Reference Black and Grant2014; Tolentino & Schmidt, Reference Tolentino and Schmidt2018). The high centrality values for depressed mood (dm) align with symptoms prevalence (Table 2), which shows depressed mood as the most frequently endorsed symptom (%38.1) compared to the other MD symptoms in the sample.
Plot of the standardized centrality metrics (strength, closeness, betweenness) for MDD symptoms (symptom abbreviation descriptions are provided in Table 1). The y-axis represents the 14 MDD symptoms while the x-axis represents the standardized values of centrality metrics.

According to Fig. 1, two links between somatic weight and appetite symptoms (i.e. ai – wg and ad – wl) appeared as the strongest connections. Although they are located at the periphery of the main network graphic representation with fewer connections with other symptom nodes whereas depressed mood is located centrally in the network and is highly interconnected with the other symptoms. This is consistent with the summary of the centrality indices shown in Fig. 2.
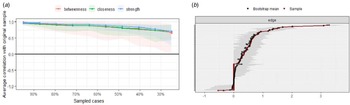
To investigate the stability of the network, 1000 bootstrap samples were generated to examine the reliability of the centrality metrics (Fig. 3a) and the accuracy of estimated edges in the network (Fig. 3b). Both reliability and accuracy are confirmed based on the bootstrap simulation results.
a. Stability of the centrality metrics (strength, closeness, betweenness); b. The accuracy of estimated edges. a, Graphic summary of the average correlation of a symptom's centrality using bootstrapping of centrality in the original estimated network as a function of percentages of the sample. Horizontal lines indicate mean correlations and vertical lines demarcate areas ranging from the 2.5th quantile to the 97.5th quantile. This plot shows that even when bootstrap samples are generated with only 70% of the original subjects, the correlations remain quite high. These bootstrapping results can be used as an index of the reliability of the centrality metrics (strength, closeness, betweenness). b, Summary of differences between network estimated and bootstrapped edges (x-axis). The black line, red line, and gray shaded area show the bootstrap mean, sample values, and their bootstrapped confidence intervals, respectively. Each horizontal line represents an edge of the network, ordered from the highest edge-weights to the lowest ones. Only differences in edge-weights at the extremes differ significantly from each other.

Bayesian network (BN)
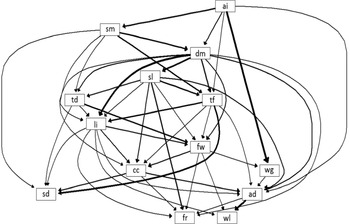
The hill-climbing algorithm was used to estimate a Bayesian network. It is displayed as a DAG in Fig. 4. The BN iterative estimation is carried out in such a way that only the strongest relationships remain in the network. The thickness of an edge indicates the probability that the depicted direction of the edge as shown in the DAG is more likely in the network than in the reverse directionFootnote 6. Symptoms placed at the top of the DAG graphic (Fig. 4) are more probable to affect other symptoms located lower in the graph. The magnitude of association between two symptoms is displayed by the thickness of an edge; the thicker the edge, the stronger the association between the symptoms. Table 4 shows the edge weights, listed from the strongest to the weakest association, respectively. These directional weights indicate the score gain/loss that would be expected if the arc were removed from the DAG. In other words, it is the difference between the score of the network in which the arc is not present and the score of the network in which the arc is present. Negative values correspond to decreases in the network score and positive values correspond to increases in the network score (the stronger the relationship, the more negative the difference) (Scutari, Reference Scutari2010). The strongest directional connections are shown in Fig. 4 and Table 4.
Bayesian network estimated using the hill-climbing algorithm displayed as a Directed Acyclic Graph (DAG). Symptoms are presented as nodes with edge thickness indicating the magnitude of the directional influences between nodes; the thicker the edge, the stronger the effect size. Edge weights ordered from the strongest to the weakest are presented in Table 4.

Estimated edge weights in Bayesian network

Note. See Table 1 for symptom abbreviation descriptions.
Figure 4 shows that the symptom of significant increase in appetite (ai) directly affects the following symptoms: significant increase in weight (wg), slept considerably more nearly every day (sm), depressed mood (dm), felt tired or fatigued (tf), and significant decrease in appetite (ad). Each of these symptoms in turn activates other symptoms. It can be seen that at the upper part of the DAG shown in Fig. 4, among the strongest associations, the depressed mood (dm) symptom affects many other symptoms in the network. This is consistent with the results of the centrality plot (Fig. 2) and the prevalence of the symptoms (Table 2), where the highest centrality and prevalence values are reported for depressed mood (dm). It is also consistent with DSM-5 guidelines on MDD in that depressed mood and/or loss of interest are designated as core symptoms of MDD and are required for assigning a positive diagnosis (Kennedy, Reference Kennedy2008; Tolentino & Schmidt, Reference Tolentino and Schmidt2018).
To investigate the stability of the estimated DAG, we conducted a bootstrap simulation using 1000 bootstrap samples. From these 1000 generated networks, networks with edge weights greater than 0.85 and directional probabilities exceeding 0.5 are selected. Then, by averaging over these selected networks, a final network is calculated. To build the mean network, we used the proposed method of Scutari and Nagarajan (Reference Scutari and Nagarajan2013), which leads to a scattered network with high sensitivity (probability of retaining ‘true’ edges) and specificity (probability of rejecting ‘false’ edges) indices. The resultant mean network is similar to the estimated DAG obtained from data, but is less sparse, meaning that it includes more edges.
Discussion and conclusions
The general aim of applying network analysis in the field of psychopathology is to understand the overall structure of the connectivity between individual symptoms and discern possible directional relationships between the symptoms that characterize episodes of disorders such as major depression.
In this study, we applied two network models to identify and detect symptoms with the highest centrality values and those symptoms that may take precedence within the network for activating other symptoms. Comparing Figs 1 and 4 shows that the strongest connections in the undirected network also emerged as strong links in BN DAG analyses. Furthermore, most of the directed edges in DAG are also present in the undirected network. However, the DAG graphic is sparser, which means fewer edges were retained in the final bootstrapped averaged model. Although, in the case of strong associations, the two networks are consistent in their profiles of connectivity. In fact, the edges present in DAG are high-weight edges in the undirected network. The results of the centrality plot are also consistent with the DAG graphic. The symptom of depressed mood (dm), having the highest centrality metrics, is located at the upper part of the DAG and shows strong connectivity with other symptoms. There appears to be an evident correspondence of the results of the symptom centrality indices for the undirected network with the directional influence in the BN DAG model. The results of two network models on depressed mood symptom (dm) are also consistent with the results of the prevalence of MDD symptoms in Table 2, which shows that depressed mood (dm) is the most prevalent symptom in the population. This is also consistent with the clinical precedence given depressed mood in the DSM-5 guidelines for determining an MDD diagnosis (Kennedy, Reference Kennedy2008; Tolentino & Schmidt, Reference Tolentino and Schmidt2018).
Furthermore, our results are consistent with those reported by Huey et al. (Reference Huey, Guan, Gill, Hui, Sulaiman and Kanagasundram2018). Their investigation set out to identify the most important symptoms of MDD. They found that the depressed mood (dm) was the most common and most important symptom. The highest centrality values for depressed mood (dm) are also consistent with the results of some recent studies including Margaroli, Calderon, & Bonanno (Reference Margaroli, Calderon and Bonanno2021), Castellanos, Ausín, Bestea, González -Sanguino, and Muñoz (Reference Castellanos, Ausín, Bestea, González -Sanguino and Muñoz2020), and Berlim, Richard-Devantoy, Dos Santos, and Turecki (Reference Berlim, Richard-Devantoy, Dos Santos and Turecki2020). According to their findings, depressed mood (dm) was identified as the most central symptom.
Depressed mood (dm) emerged from the network analyses as the symptom with the highest centrality metrics and was located at the upper part of Bayesian network graph. These results suggest that depressed mood (dm) may be a viable target for interventions if the same network structures can be replicated in different samples, both non-clinical and clinical. Given the current concerns about reproducibility and replicability (Borsboom, Robinaugh, Rhemtulla, & Cramer, Reference Borsboom, Robinaugh, Rhemtulla and Cramer2018), it is imperative that the findings reported here regarding both the undirected Ising and directed Bayesian network structure of MDD symptoms be replicated in other samples.
DAG structures derived from Bayesian network modeling can provide information about potential intervention strategies. In a DAG structure, symptoms placed higher in the graphic representation are given greater priority for their activation potential, while symptoms located lower in the BN carry less activation potential and are considered to be less likely to influence other symptoms in the network. Therefore, the DAG structure suggests that symptoms at the top of the DAG – e.g. significant increase in appetite (ai), slept considerably more nearly every day (sm), depressed mood (dm) – could be considered as primary targets for interventions.
Furthermore, our BN DAG analyses uncovered an apparent contradiction between the homogeneity assumption of the causal process of this modeling approach and the within-person dependencies for the disaggregated increase/decrease weight and appetite MDD symptoms for a given depressive episode. Extended mixture models that can accommodate for person heterogeneity seem like a possible way to address this condition.
Another result worth emphasizing from both network models is that the strongest connections in both networks are the association between significant increase in appetite (ai) and significant increase in weight (wg), and association between significant decrease in appetite (ad) and significant decrease in weight (wl). Thus, these somatic symptoms appeared to be strongly connected but were located on the periphery of the Ising network. This result is consistent with latent modeling structures of MDD symptoms (Bi et al., Reference Bi, Wang, Cao, Fang, Li, Liu and Hall2021), in which the somatic symptoms often constitute their own factor in the disaggregated form.
Therefore, it is useful to combine the undirected and directed Bayesian networks to study MDD and other psychological disorders. The results of the two networks can be used to generate hypotheses for future research.
Our findings should be interpreted in light of several potential limitations. Only females were studied, so no sex differences could be examined. The female-female twin sample was ascertained from the general population. Thus, the female twins MD symptoms are representative of symptom expression in the general population rather than in a selected clinical population. Results presented here may differ from those obtained by applying network analyses to more severely ill individuals (as would be the case in a clinically ascertained sample), so the network results should be interpreted appropriately. We emphasize that our network results provide information about how the MD symptoms operate in the general population. This may not accurately reflect how the MD symptoms operate in a clinical population. Further studies are needed to investigate whether similar conclusions hold in clinical samples.
There are several limitations of the present study that should be noted. Most involve the assumptions underlying the Bayesian network DAGs methodology. The fundamental DAG assumption of acyclicity states that no feedback loops are present in the graphical structure. However, when applying DAGs to psychological disorders symptom data (e.g. depression), nonrecursive relations may occur that cause certain symptoms to activate each other and create cyclical loops. Also, causal claims derived from connections between nodes in a DAG assume an absence of confounding and sampling bias. Based on the assumption that the formal causality embedded in DAGs accurately reflects real-world causal structure, some argue that the application of DAGs is only appropriate when the underlying causal structure is well understood. Although we acknowledge that any inferential claims based on results from BN DAG modeling should be stated cautiously, particularly in the context of psychological phenomena such as MD symptoms, we still believe that DAGs can be noteworthy exploratory methods to visualize complex dependencies in psychological data. As Robinaugh et al. (Reference Robinaugh, Hoekstra, Toner and Boorsboom2019) said DAGs can ‘provide valuable but incomplete information about the relationships between symptoms [nodes]’. Furthermore, the similarities between the undirected and DAG network results suggest that our findings need further exploration in future studies.
In summary, network analysis – especially Bayesian network – seems to be a promising approach for psychopathology and other fields of psychometrics. So far, mental health network analysis has mostly been performed using cross-sectional data. Cross-sectional data analysis using DAG assumes that all relevant variables are included and longitudinal effects between variables cannot be incorporated. The undirected network models have been recently considered based on longitudinal data (Borsboom et al., Reference Borsboom, Deserno, Rhemtulla, Epskamp, Fried, McNally and Waldorp2021; Epskamp, Reference Epskamp2020; Epskamp, Waldorp, Mõttus, & Borsboom, Reference Epskamp, Waldorp, Mõttus and Borsboom2018b; Van Borkulo, Reference Van Borkulo2018; Bringmann, Lemmens, Huibers, Borsboom, & Tuerlinchks, Reference Bringmann, Lemmens, Huibers, Borsboom and Tuerlinckx2015). Using a longitudinal design, it is possible to incorporate a temporal dimension to network analysis, which reveals how symptom interaction unfolds over time. In the future research, we will explore VATSPSUD data using longitudinal network models.
Supplementary material
The supplementary material for this article can be found at https://doi.org/10.1017/S0033291722002604
Acknowledgements
The authors affirm that they have no financial support. The work was not directly funded. This paper is taken from the PhD thesis of Sheida Moradi.
Conflict of interest
The authors declare that there is no conflict of interests.