
Introduction
From an evolutionary perspective, natural selection should favour any trait increasing the probability of parasite transmission from one host to another (Bush et al., Reference Bush, Fernández, Esch and Seed2001; Combes, Reference Combes2001). For example, many parasite species with complex life cycles (i.e. parasites with successive host species), have evolved strategies of releasing infective forms at times of the day when the definitive host is most likely to be present in the environment (Théron, Reference Théron1984; Combes et al., Reference Combes, Fournier, Moné and Théron1994; Combes, Reference Combes2001 and references therein). Such a phenomenon of diurnal periodicity is also observed in parasites with simple life cycles (i.e. parasites with a single host species). Coccidia from the genus Isospora (Protozoa, Apicomplexa) are intracellular intestinal parasites of birds, and typically peak oocyst release in the late afternoon (Boughton, Reference Boughton1933; Kruszewicz, Reference Kruszewicz, Pinowski, Kavanagh and Pinowska1995; Brawner and Hill, Reference Brawner and Hill1999; Dolnik, Reference Dolnik1999a, Reference Dolnik1999b; Hudman et al., Reference Hudman, Ketterson and Nolan2000; Brown et al., Reference Brown, Ball and Holman2001; Misof, Reference Misof2004). These protozoans exhibit both sexual and asexual phases. In most species, one or more asexual multiplication cycles are completed in the intestinal epithelium of the host, before sexual development occurs (Olsen, Reference Olsen1974). Zygotes produced during the sexual phase transform into oocysts that are then released into the host's intestinal tract and excreted within feces. To complete their development, oocysts must sporulate outside the host to become infective before being ingested by their new host (see e.g. Abd-Al-Aal et al., Reference Abd-Al-Aal, Ramadan and Al-Hoot2000).
In birds, coccidian oocyst shedding shows a strong circadian pattern that appears to be ubiquitous since in all species tested to date (16 species), oocyst shedding has been found to peak in the afternoon (Knight et al., Reference Knight, Ewen, Brekke, Santure, Rollinson and Stothard2018), whatever the latitude considered, from the tropics zone to arctic area (Dolnik et al., Reference Dolnik, Metzger and Loonen2011). Even in an extreme environment with permanent daylight like the arctic, this periodicity is conserved despite the absence of diurnal periodicity in hosts' activity (Dolnik et al., Reference Dolnik, Metzger and Loonen2011). The peak in oocyst shedding late in the afternoon is considered an adaptative trait providing resistance to desiccation and ultraviolet (UV) radiation for oocysts in the external environment (Martinaud et al., Reference Martinaud, Billaudelle and Moreau2009). Indeed, a single hour of exposure of the host's feces to natural sunlight reduces the viability of oocysts by ca. 50%, which further decreases with continued exposure (Martinaud et al., Reference Martinaud, Billaudelle and Moreau2009). Therefore, releasing oocysts throughout the day would result in a large proportion quickly dying due to sunlight exposure, and a decrease in transmission probability to the next host. Interestingly, all bird species showing temporal variation in the shedding of coccidia oocysts with a peak late in the afternoon roughly have in common one characteristic of their environment: a ground exposed to strong solar radiation including the arctic area (Knight et al., Reference Knight, Ewen, Brekke, Santure, Rollinson and Stothard2018). However, an exciting question that remains open is whether oocysts shedding in an environment where the sun reaching the ground is dramatically reduced throughout the year still shows diurnal periodicity. Indeed, in such environments, the selective pressure of desiccation and UV exposure of oocysts during the daytime would be relieved. One would, therefore, predict periodicity in oocyst shedding either not to evolve or be lost as it would reduce transmission probability without the benefits of increasing oocysts viability and should thus be selected against.
Although tropical rainforests receive 12 h of sunlight daily, it is generally assumed that <2% of radiation ever reach the ground. Tropical rainforests have dense vegetation, often forming three different layers including a dense canopy that blocks out ca. 95% of sunlight (Brinkmann, Reference Brinkmann1971; Bourgeron, Reference Bourgeron and Golley1983; Chazdon and Fetcher, Reference Chazdon and Fetcher1984; Vazquez-Yanes et al., Reference Vazquez-Yanes, Orozco-Segovia, Rincon, Sanchez-Coronado, Huante, Toledo and Barradas1990). Therefore, the rainforest ground rarely receives direct sunlight. Also, tropical rainforests are characterized by high air humidity, ranging on average from 80 to 90% relative humidity (RH; Freiberg, Reference Freiberg1997; Bruno et al., Reference Bruno, Rocha, Freitas, Goulden and Miller2006) and soil moisture. By combining low direct sunlight and high RH, this environment provides feces shed by birds with very favourable conditions to allow oocyst sporulation and survival. If temporal variation in shedding of coccidial oocysts is under natural selection to avoid desiccation and UV radiation as hypothesized, we may predict that no circadian rhythm should be observed in tropical forests contrary to temperate forests. Indeed, temperate forests are exposed to a stronger irradiance and lower soil moisture compared to tropical forests since the vegetation canopy is moderately dense and allows light to penetrate (Szwagrzyk et al., Reference Szwagrzyk, Szewczyk and Bodziarczyk2001). However, to our knowledge, temporal variation in the shedding of coccidia oocysts has never been investigated in a tropical rain forest environment.
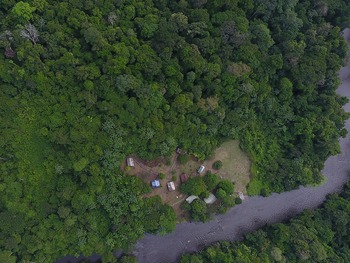
To investigate whether periodically synchronized release of coccidia oocysts from the genus Isospora may be absent in tropical forests, consistent with the hypothesis of relaxed natural selection linked to UV radiation and desiccation, we compared patterns of oocyst shedding from birds living in the primary rain forest in French Guyana (low luminosity and high humidity and moisture) and that from birds living in open temperate forests in mainland France (high ground luminosity and low humidity and moisture). The generality of this expected difference in the patterns of oocyst shedding across the diversity in host ecology and life history was assessed by sampling a variety of bird species belonging to different families within both habitat types. We expected marked temporal variation in the shedding of coccidia oocysts for host species living in open forest and no or weak temporal variation for hosts living inside the dark rain forest. Besides, we took advantage of the spatial heterogeneity in vegetation cover existing around the field station located in the tropical rain forest to study variation in oocyst-shedding patterns at a smaller scale. Indeed, a large area has been maintained open at the edge of the field station for more than 30 years (Fig. 1) and has selected bird species specialists of open habitats. We, therefore, expected temporal variation in the shedding of coccidia oocysts from host species inhabiting this open area, contrary to those inhabiting the close by rain forest.
Location of the open area inside the Tropical Forest 1 – French Guyana, Nouragues French research, Saut-Pararé station (copyright: Florian Jeanne).

Materials and methods
Trapping birds and sampling feces
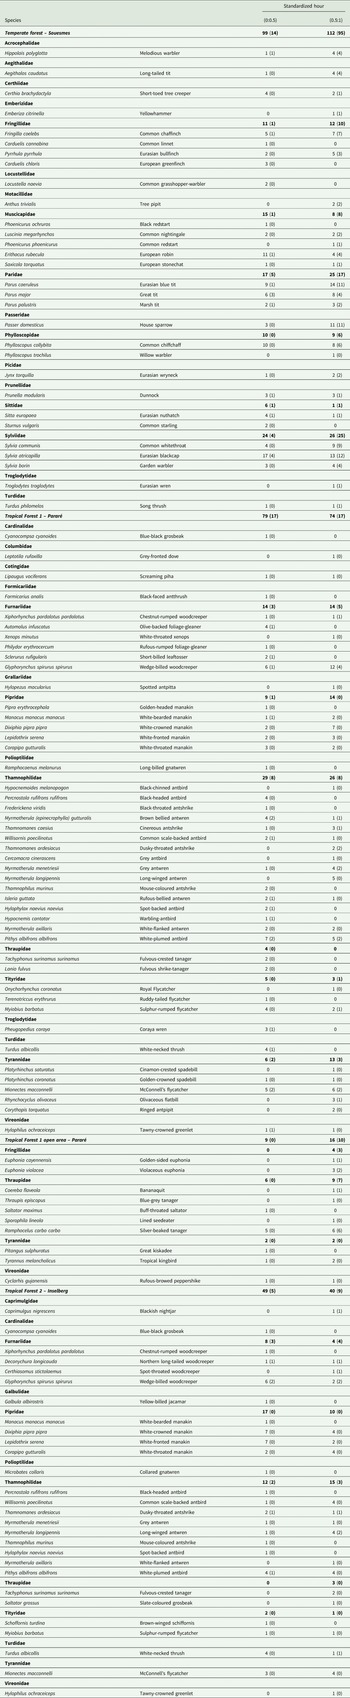
Adult males and females of different bird species (1-year-old and older, identified by plumage characteristics) were caught using mist-nets from sunrise to sunset in both tropical and temperate areas. Species and age were determined according to handbooks (Hilty, Reference Hilty2002; Restall et al., Reference Restall, Rodner and Lentino2006a, Reference Restall, Rodner and Lentino2006b). The full list of species and the number of individuals caught are given in Table 1. In the temperate forest habitat, we sampled birds in a young deciduous forest located in Sologne (thereafter called Temperate Forest, France, 47°26′N, 2°13′E) during spring 2019 (10 sampling days). At that time of the season, sunrise occurred at 06:00 am and sunset around 09:00 pm. In the tropical forest, we sampled birds in the Amazonian primary rain forest during July and August 2018 and October 2019 (15 and 11 sampling days in total) in the two field sites of the Nouragues French research station: Saut-Pararé (thereafter Tropical Forest 1, French Guyana, 4°02′N, 52°41′W, 8 sampling days in 2018 and 11 sampling days in 2019) and Inselberg (thereafter Tropical Forest 2, French Guyana, 4°05′N, 52°41′W, 7 sampling days in 2018) where sunrise occurred at 06:00 am and sunset at 06:00 pm. In the first site, we sampled birds both within the forest undergrowth and at its edge in the open area close to the field camp (Fig. 1). On one typical sunny day, we measured abiotic parameters at the ground level in these two areas (open and undergrowth): temperature (°C), UV index and luminosity intensity (in lux). These measures were performed five times over the course of the day (08:00 am, 10:00 am, 12:00 am, 15:00 pm and 17:30 pm), using a CROSCAAL phone – Trekker – X4 equipped with software X4 sensors in ten different spots randomly chosen to take spatial heterogeneity into account.
Complete list of bird species included in this study, showing prevalence of infection by Isospora spp. (total number of birds caught and number of birds infected in brackets) separately for birds caught in the morning (hours standardized <0.5) and in the afternoon (hours standardized >0.5)

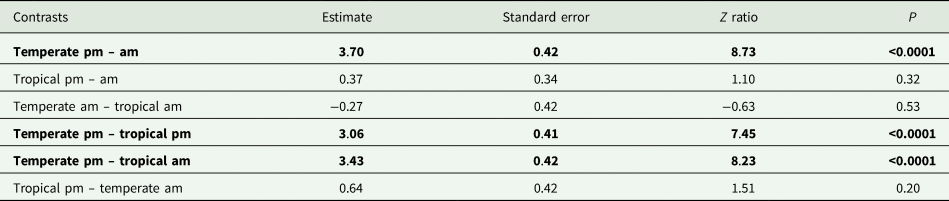
Birds were caught in three different environments: Temperate Forest (Souesmes), Tropical Forest 1 (Nouragues, Pararé) undergrowth and open area and Tropical Forest 2 (Nouragues, Inselberg). Differences in parasite prevalence in host feces between morning and afternoon differed between tropical and temperate species (B-GLMM: effect of morning vs afternoon: χ 21 = 76.21, P < 0.0001, effect of the site: χ 21 = 55.41, P < 0.0001, effect of their interaction: χ 21 = 38.03, P < 0.0001). In the Temperate Forest, the prevalence of Isospora was higher in the afternoon than in the morning, whereas prevalence did not differ between morning and afternoon in the Tropical Forest (Table 2).
Post hoc tests based on the B-GLMM for the comparisons of morning (am) and afternoon (pm) prevalence in temperate and tropical areas (corrected for multiple comparisons, see text for details)

Significant differences are in bold.
For birds that can be kept in captivity throughout their lives such as poultry, the preferred method to track temporal patterns of oocysts release as accurately as possible is to collect feces every 2 h from sunrise to sunset for each bird maintained in an individual cage (Filipiak et al., Reference Filipiak, Mathieu and Moreau2009). However, under field conditions, enclosing wild birds in a cage for an entire day is not acceptable from an ethical point of view, due to the stress of capture and prolonged restraint, which may alter both their subsequent survival and ability to reproduce, as birds might have been breeding at the time of capture. To limit the stress imposed on birds, we followed the protocol adopted in snow bunting (Dolnik et al., Reference Dolnik, Metzger and Loonen2011). Birds were placed in individual cages, the bottom of which was lined with aluminium foil, at any time of capture during the day, for a maximum of 1 h before being released at their site of capture, had the birds shed feces or not. All fresh feces present on the aluminium foil were collected and homogenized with a small spoon and stored at 4°C in 15 mL Falcon tubes labelled with the date, time of the day and bird species. To avoid repeated sampling of the same individuals, birds having shed feces were marked with a drop of nontoxic nail varnish on the tarsus and in the case of recapture, were not subjected again to feces collection and were thus immediately released.
Prevalence and intensity of parasite infection by Isospora spp.
At the end of each field session in the two habitats (temperate/tropical), feces samples were weighted to the nearest 0.01 g using an electronic balance and a solution of Sheater (45% sugar in water) was added to a concentration of 1 mg of feces for 4 mL of sheater, after which samples were gently homogenized. We sampled 600 μL of this solution on a McMaster chamber and allowed oocysts to float to the top for 10 min. All the oocysts of Isospora spp. under the grid of each chamber in the McMaster were counted using 10× magnification. Two counts were obtained for each individual fecal sample, and the average concentration, expressed as the number of oocysts per gram of fecal sample, was used as an estimate of oocyst production rate.
Statistical analyses
The time of feces collection was first calculated for each bird as the average hour between entrance and release from the cage. This time was standardized in the proportion of daily sunshine duration to take differences in daylength between tropical and temperate sites into account as follows:

with h average the average hour of collection and h sunrise and h sunset the sunrise and sunset time. Additionally, to compare morning and afternoon prevalence and infection intensity, daylength was divided into two parts: morning: standardized hour <0.5 and afternoon: standardized hour >0.5. All statistical analyses were performed with R software (v.4.0.4, R Core Team, 2021) implemented with packages MASS, car for model comparison and for unbalanced design and emmeans for post hoc pairwise comparison tests including the Benjamini and Hochberg' correction for multiple comparisons (Benjamini and Hochberg, Reference Benjamini and Hochberg1995).
Differences in prevalence and parasite load between temperate (Temperate Forest) and tropical environments (Tropical Forest 1 + Tropical Forest 2) in birds sampled in the forest (birds caught in the open area in Tropical Forest 1 were excluded from this analysis) were analysed using a generalized linear mixed-effects model with binomial distribution (B-GLMM, using glmer function) and negative binomial distribution (NB-GLMM, using glmmTMB function), respectively, including either the standardized hour or part of the day, habitat (temperate vs tropical) and their interaction as fixed effects. Species identity was included as a random effect. The slopes of fitted lines/curves were provided assorted with their 95% confidence interval (CI) from the models. Similar models were run to compare the two sites in the tropical habitat (i.e. Tropical Forest 1 vs Tropical Forest 2).
The same procedures were used to investigate differences in prevalence and parasite load in birds from open area vs surrounding undergrowth in Tropical Forest 1.
Differences in abiotic factors during the day (temperature, UV radiation and luminosity) between these two habitats were analysed including the standardized hour of the day as a quadratic effect to test for a potential maximal effect at midday and the location and their interaction. The temperature was analysed using a Gaussian GLM (glm function) whereas UV radiation and luminosity were analysed using NB-GLM (glm.nb function).
For all GLMs and GLMMs, model comparisons were made using a deviance analysis for unbalanced design based on the likelihood ratio χ 2-statistics or F-ratio for Gaussian GLM to test the contribution of the variable. Interactions were discarded when non-significant.
Results
Differences in temporal patterns of parasite prevalence in species from temperate and tropical forests
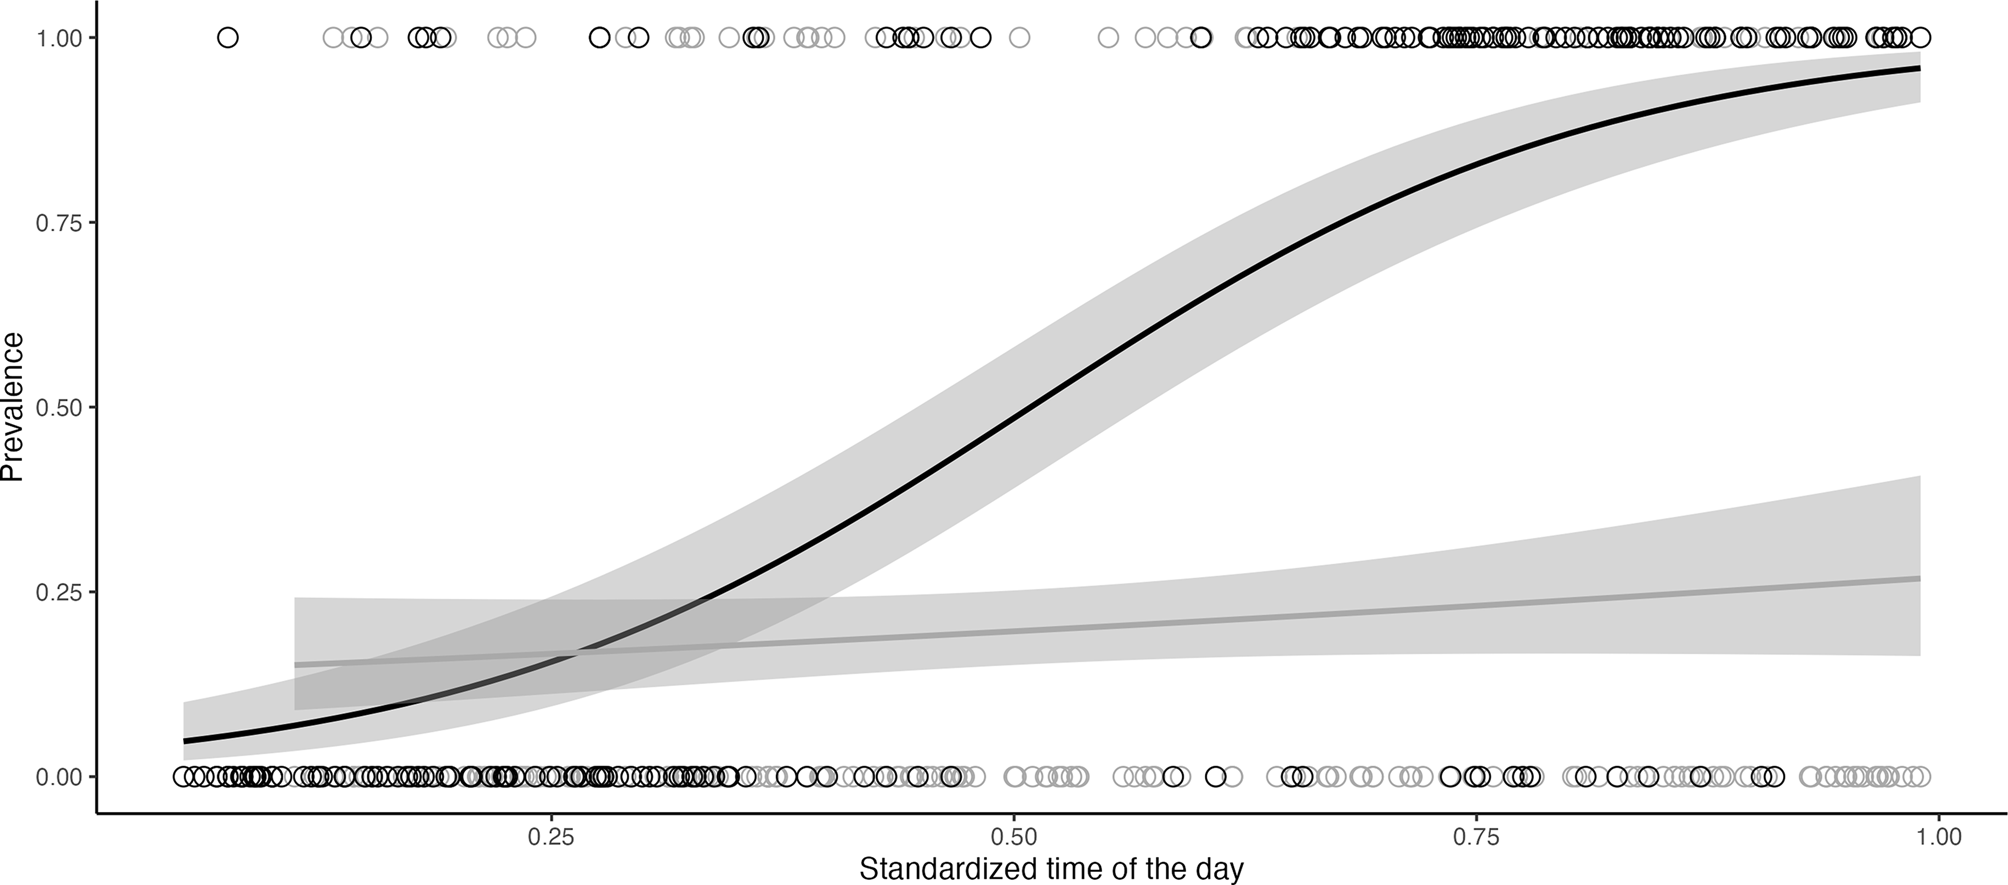
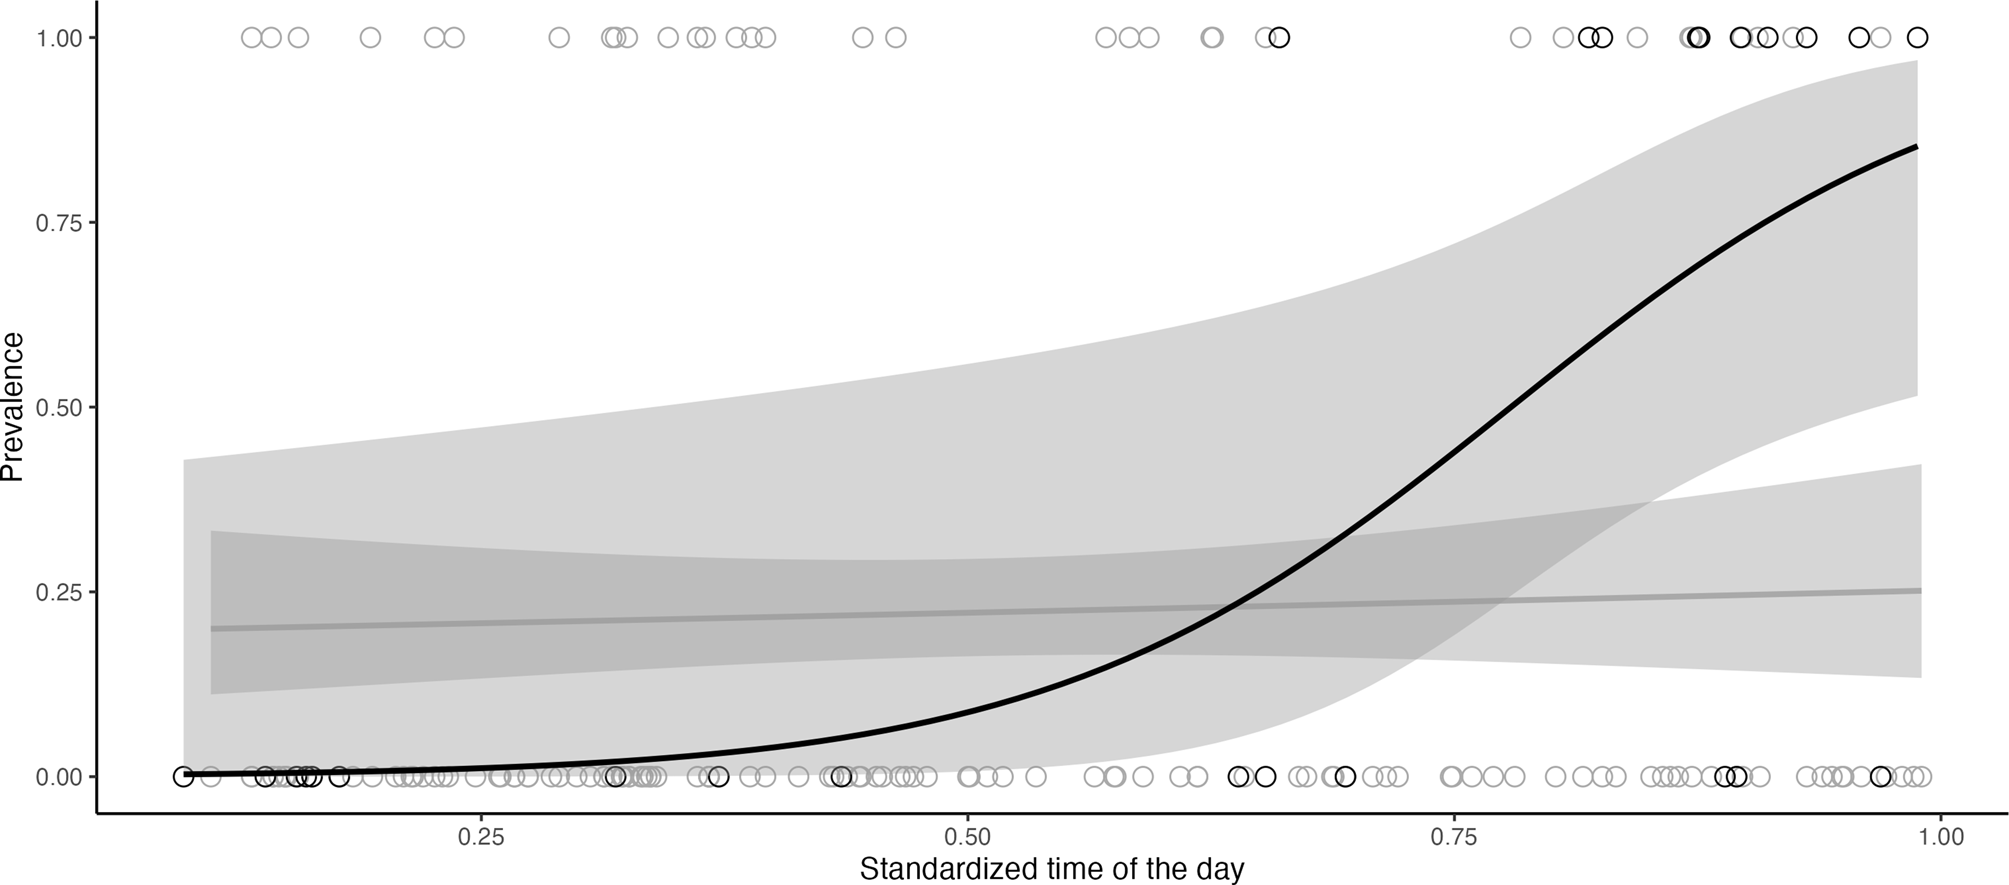
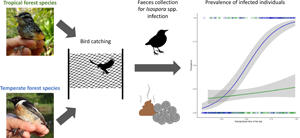
The prevalence of Isospora spp. oocysts in bird feces increased dramatically as the day progressed for species inhabiting temperate forest to reach a maximum of 90% of infected individuals [slopeTemperate-Forest (95% CI) = 6.89 (5.27; 8.50)] whereas in the same time the prevalence for species living in tropical forest remained unchanged around 25% of infected individuals [slopeTropical-Forest (95% CI) = 0.86 (−0.40; 2.12)] (B-GLMM: effect of time: χ 21 = 69.76, P < 0.0001, effect of location: χ 21 = 6.65, P < 0.01, effect of their interaction: χ 21 = 33.72, P < 0.0001) (Fig. 2). The prevalence of Isospora spp. oocysts in bird feces did not differ between the two tropical forest sites [B-GLMM: effect of time: χ 21 = 2.47, P = 0.12, effect of sites: χ 21 = 1.70, P = 0.19, effect of their interaction: χ 21 = 0.98, P = 0.32, slopeTropical-Forest 1 (95% CI) = 0.43 (−1.18; 2.05) and slopeTropical-Forest 2 (95% CI) = 1.87 (−0.42; 4.20)]. Complementary analyses of parasite prevalence contrasting morning and afternoon data are presented in Table 1 and yielded the same results.
Prevalence of Isospora spp. (i.e. probability of infection, 1: infected, 0: not infected) in fecal samples from different bird species as a function of time elapsed through the day (standardized time of the day from 0 corresponding to sunrise to 1 corresponding to sunset) and of sampling site (Temperate Forest in black and Tropical Forest 1 + 2 in grey). Data points show actual prevalence, and predicted values fitted with the GLM model are in plain lines assorted with 95% CI in light grey.

Differences in temporal patterns of infection intensity between species of temperate and tropical forests
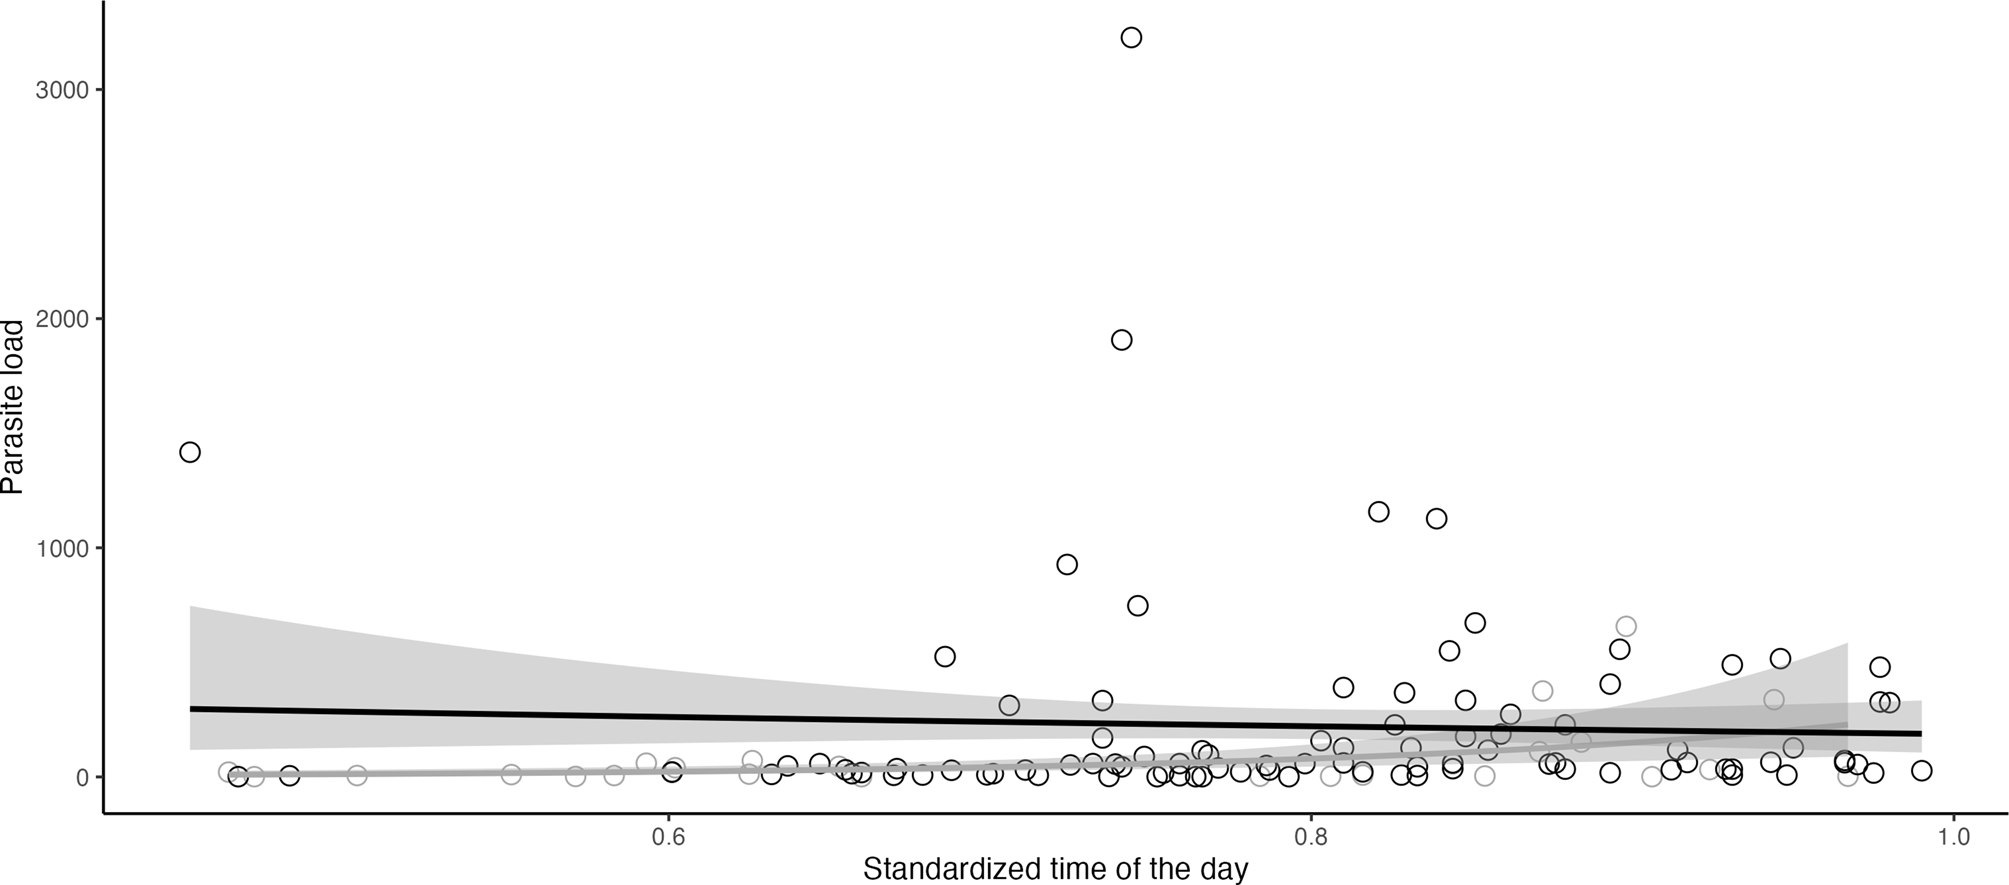
Pre-analyses showed differences in infection intensity, measured by parasite load in the host feces, between morning and afternoon in Temperate Forest (Wilcoxon test: W = 983.5, P = 0.004), and in Tropical Forest 1 (Wilcoxon test: W = 206.5, P = 0.01) but not in Tropical Forest 2 (Wilcoxon test: W = 29.5, P = 0.38) (mean ± s.e. of number of Isospora spp. shed in feces in the morning vs in the afternoon respectively: Temperate Forest: 35.36 ± 15.95 vs 222.81 ± 46.01, Tropical Forest 1: 29.71 ± 24.88 vs 91.06 ± 44.13 and Tropical Forest 2: 27.20 ± 23.25 vs 62.33 ± 37.92). Therefore, analyses of differences in parasite load were restricted to data from infected birds sampled in the afternoon (excluding birds from the open area in Tropical Forest 1). Parasite load remained constant all the afternoon in species living in the temperate habitat [slopeTemperate-Forest (95% CI) = −0.002 (−3.01; 3.01); mean ± s.e. parasite load: 222.81 ± 46.01 oocysts per bird]. In contrast, parasite load increased over time from 0 to around 200 oocysts per bird at sunset [slopeTropical-Forest (95% CI) = 5.98 (2.27; 9.69), mean ± s.e. parasite load: 80.72 ± 30.97 oocysts per bird] (NB-GLMM: effect of time: χ 21 = 0.00, P = 1.00, effect of location: χ 21 = 7.86, P < 0.01, effect of their interaction: χ 21 = 5.84, P < 0.05) (Fig. 3). In the Tropical Forest, the number of oocysts released in bird feces increased through the afternoon and did not differ between the two sites and [NB-GLMM: effect of time: χ 21 = 6.94, P < 0.01, effect of sites: χ 21 = 0.14, P = 0.71, effect of their interaction: χ 21 = 0.02, P = 0.89, slopeTropical-Forest 1 (95% CI) = 6.18 (1.73; 10.6) and slopeTropical-Forest 2 (95% CI) = 6.64 (1.36; 11.9)].
Parasite load of Isospora spp. (number of oocysts per gram of feces) in different bird species as a function of time elapsed through the afternoon (standardized time of the day ranging from 0.5 corresponding to midday to 1 corresponding to sunset) and of sampling site (Temperate Forest in black and Tropical Forest 1 + 2 in grey). Data points show actual parasite loads, and predicted values fitted with the GLM model are in plain lines assorted with 95% CI in light grey. Data presented here is restricted to infected birds sampled after a standardized hour of 0.5 (see text for more details).

Differences in temporal patterns of prevalence and intensity between open field and undergrowth in the Tropical Forest 1
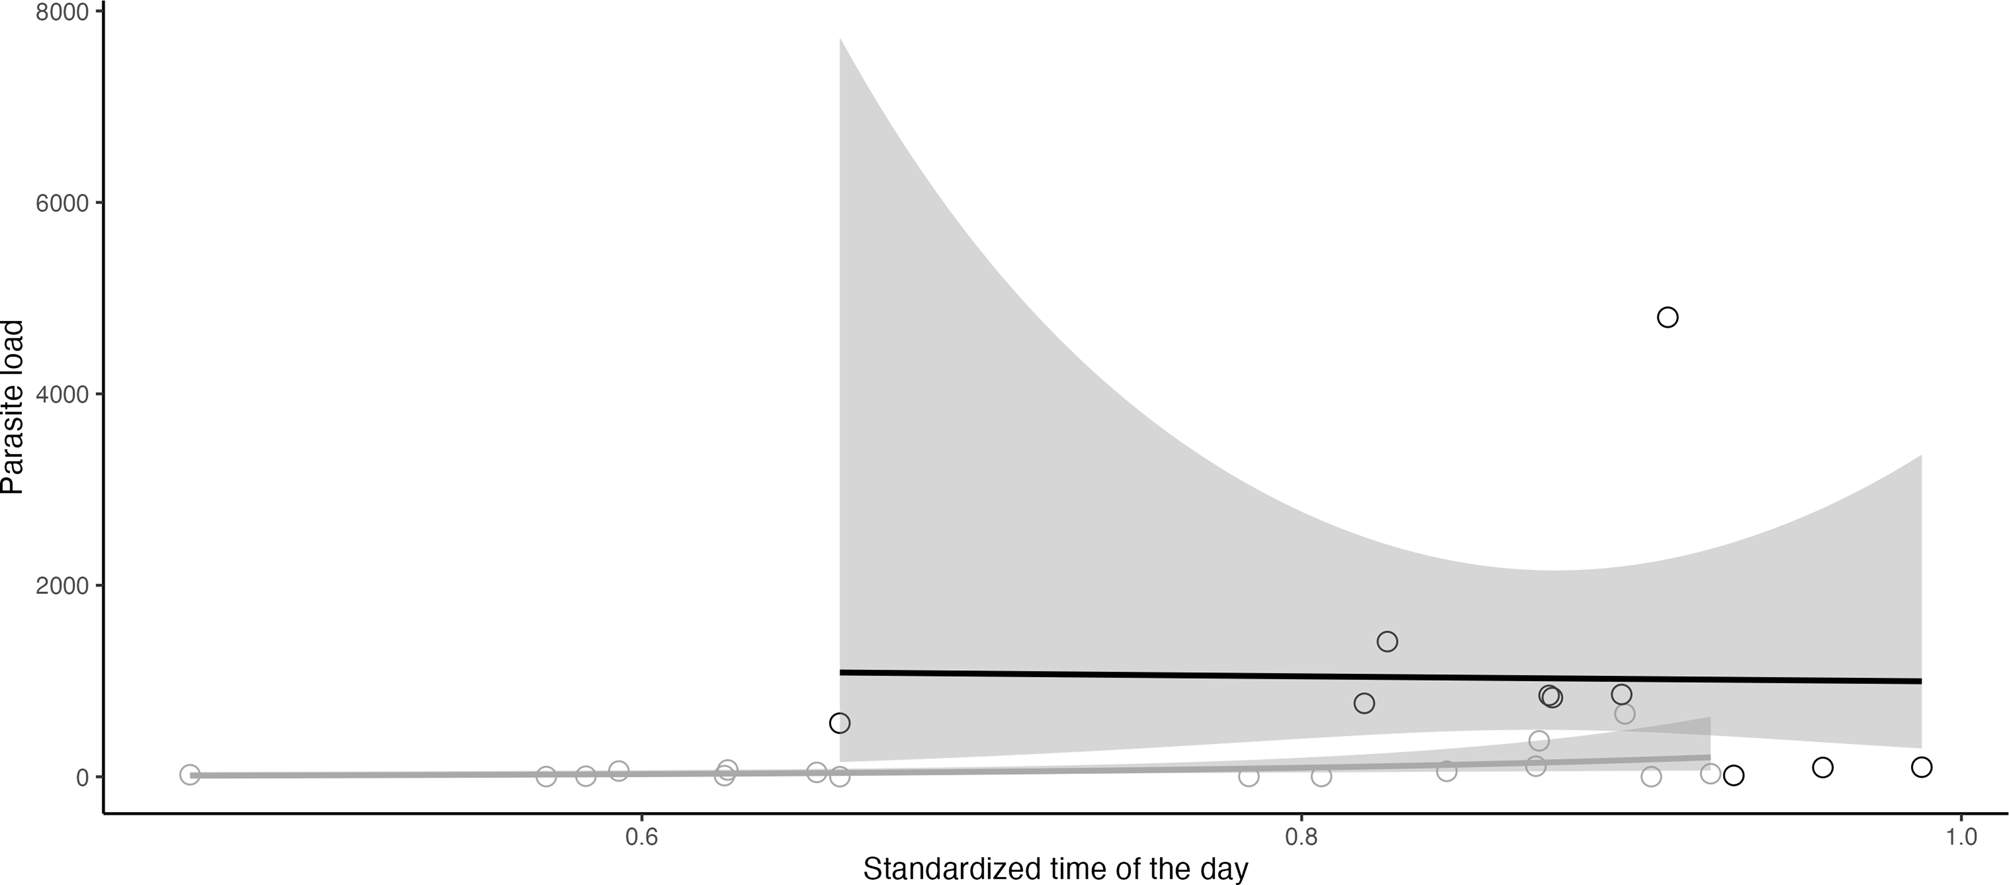
Prevalence of Isospora infection increased in the open area but remained stable inside the Tropical Forest throughout the day [B-GLMM: effect of time: χ 21 = 4.90, P < 0.05; effect of area: χ 21 = 2.66, P = 0.10, effect of their interaction: χ 21 = 4.30, P < 0.05; slopeopen area (95% CI) = 8.87 (1.02; 16.72) vs slopeundergrowth (95% CI) = 0.47 (−1.09; 2.02)] (Fig. 4). For example, in the most abundant species captured in this open area (silver-beaked tanager), all individuals caught in the afternoon shed oocyst in their feces whereas no individual caught in the morning did (Table 1). Considering only infected birds in the afternoon (standardized hour >0.5), parasite load was higher in the open area than that in the undergrowth (NB-GLMM: effect of time: χ 21 = 1.08, P = 0.30; effect of area: χ 21 = 5.35, P < 0.05, mean ± s.e. parasite load open area: 1028.70 ± 441.20 oocysts/bird and forest undergrowth: 91.06 ± 44.13 oocysts/bird) (Fig. 5).
Prevalence of Isospora spp. (probability of infection, 1: infected, 0: not infected) in fecal samples for different bird species as a function of time elapsed through the day (standardized time of the day from 0 corresponding to sunrise to 1 corresponding to sunset) and of sampling location within the Tropical Forest 1 site (open area in black, surrounding undergrowth in grey). Data points show actual prevalence (1: infected, 0: not infected), and predicted values fitted with the GLM model are in plain lines assorted with 95% CI in lighter grey.

Parasite load of Isospora spp. (number of oocysts per gram of feces) in different bird species as a function of time elapsed through the afternoon (standardized time of the day from 0.5 corresponding to midday to 1 corresponding to sunset) and of sampling location within the Tropical Forest 1 site (open area in black and surrounding undergrowth in grey). Data points show actual parasite loads, and predicted values fitted with the GLM model are in plain lines assorted with 95% CI in light grey. Data presented here is restricted to infected birds sampled after a standardized hour of 0.5 (see text for more details).

Comparison of abiotic factors between the forest undergrowth and open area
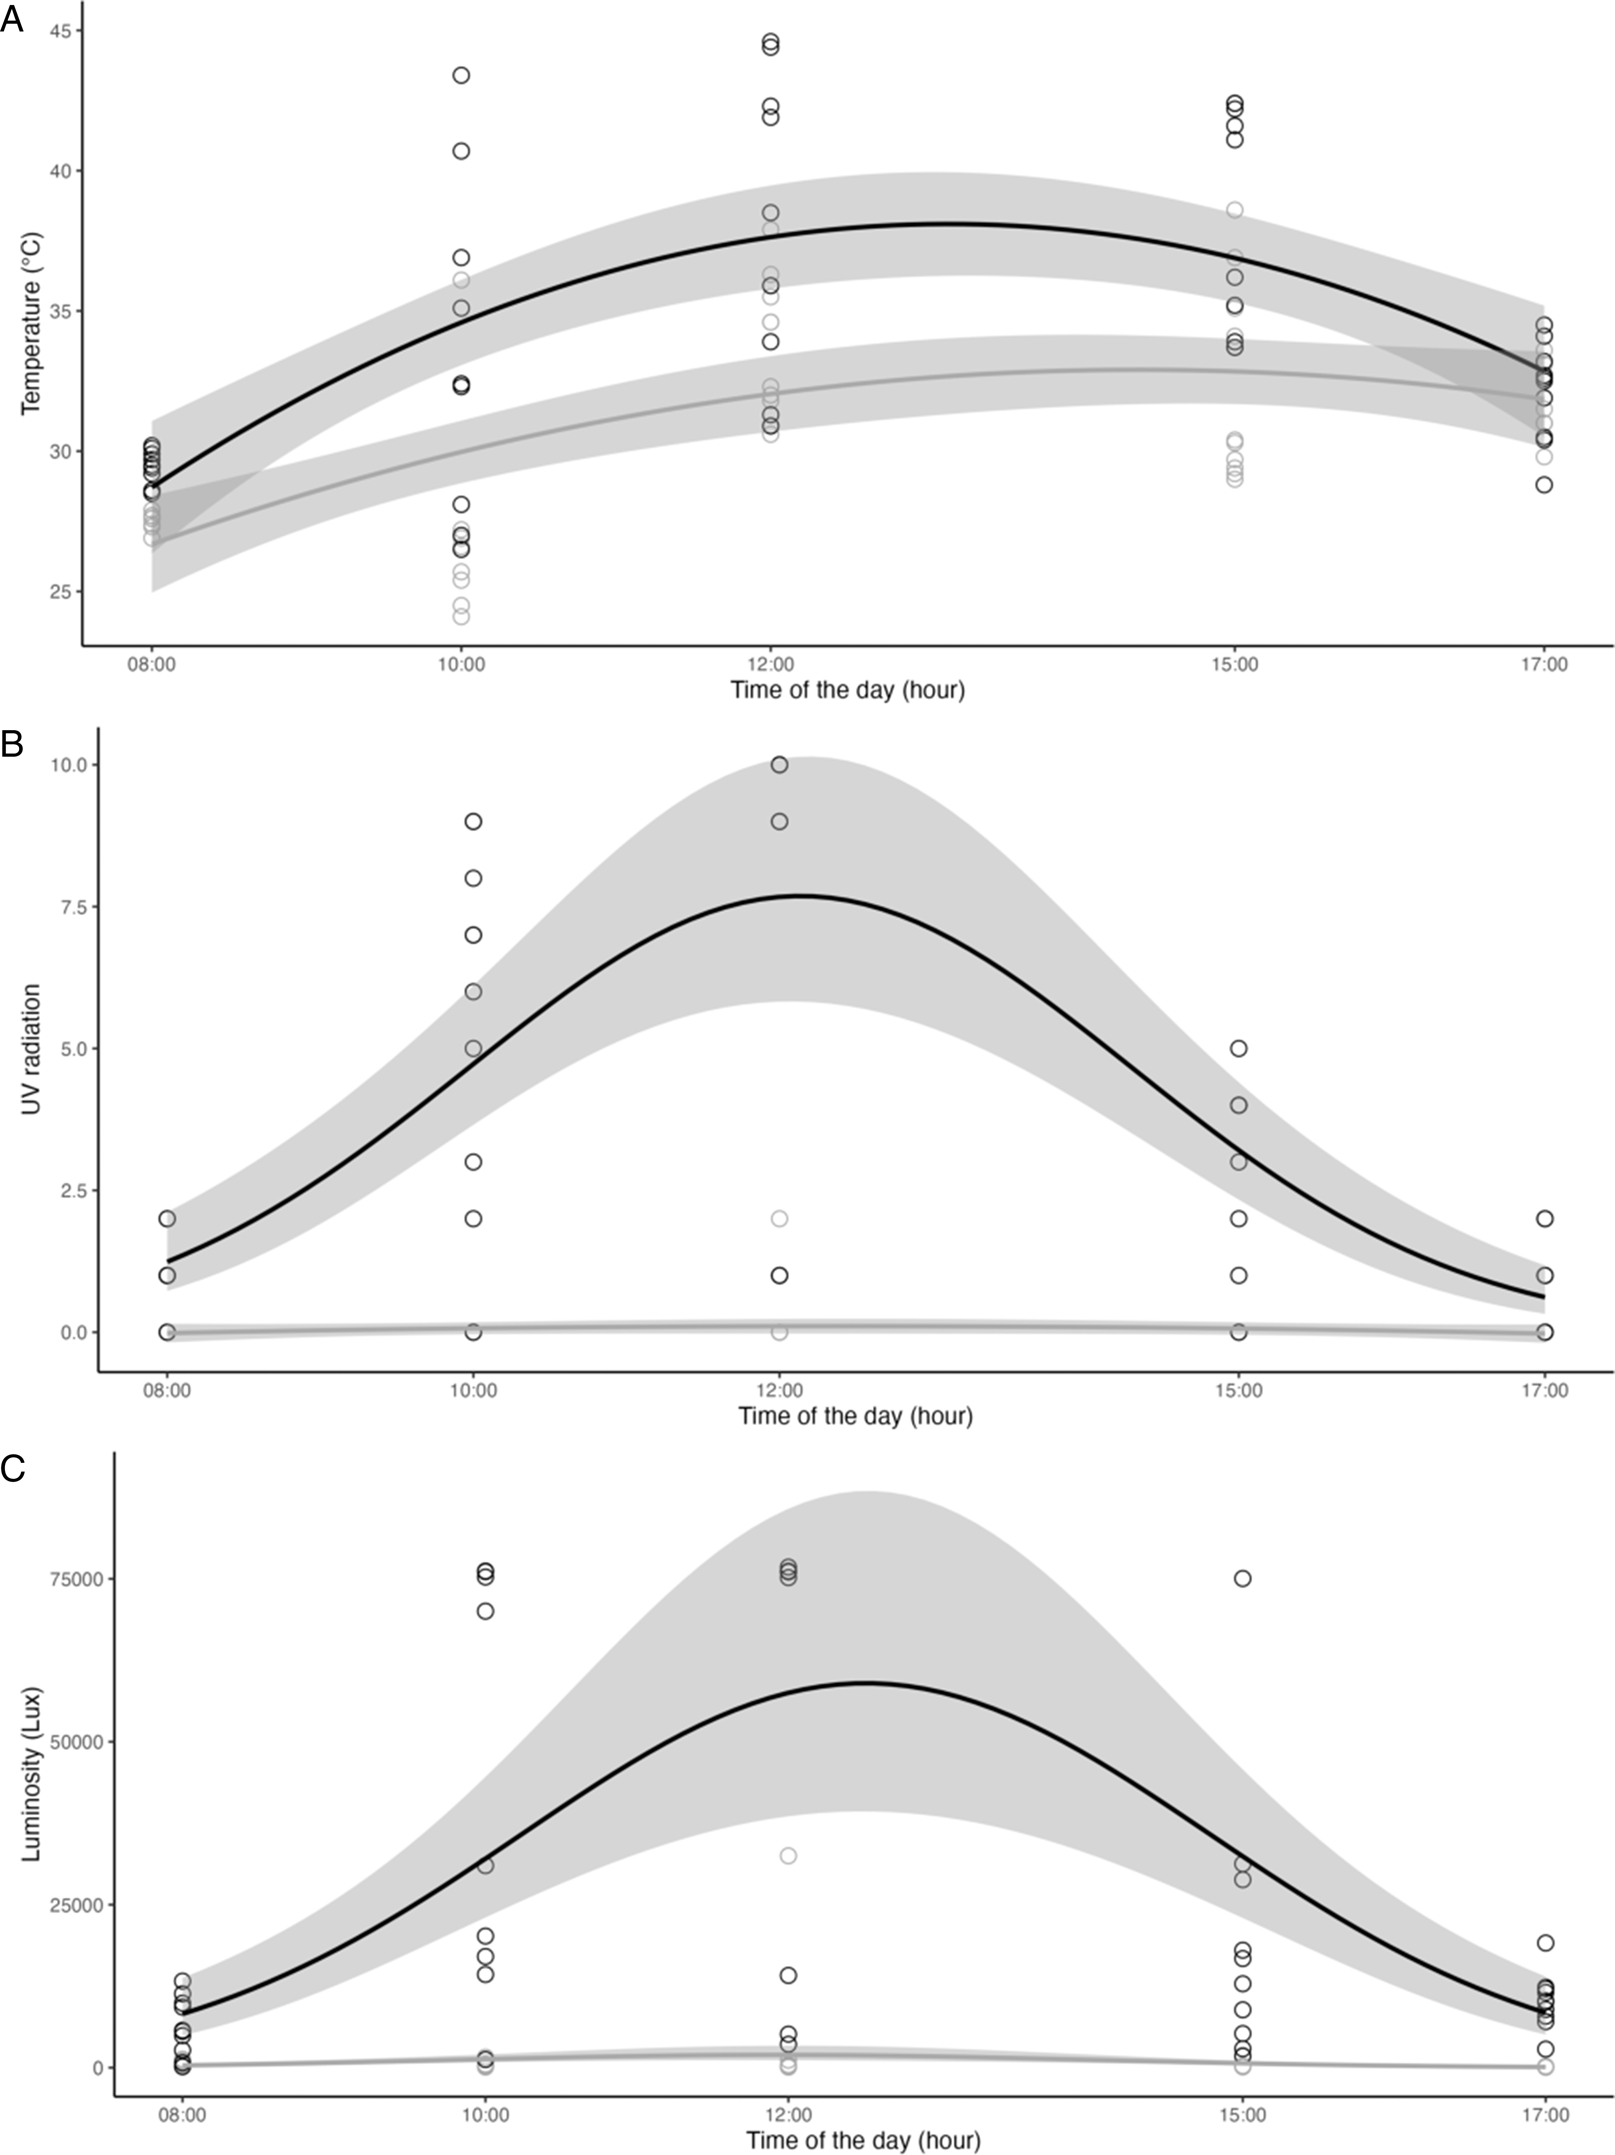
Variation in temperature showed a curvilinear relationship with time elapsed since sunrise, with a peak around 35°C in open area and only around 30°C in the forest undergrowth between 12:00 and 15:00 (Gaussian GLM: time × area: F 1,94 = 4.88, P = 0.03, time2 × area: F 1,94 = 5.20, P = 0.02, Fig. 6a). In open area, UV radiation and luminosity showed a similar relationship with time from the morning to midday to reach a high intensity of UV radiation and luminosity intensity before a strong decrease until the sunset. In contrast, in the forest undergrowth UV radiation and luminosity intensity remains at very low level throughout the day (NB-GLM for UV radiation: time: χ 21 = 56.39, P < 0.0001; time2: χ 21 = 59.99, P < 0.0001; location: χ 21 = 169.08, P < 0.0001, Fig. 6b and NB-GLM for luminosity: time: χ 21 = 52.01, P < 0.0001; time2: χ 21 = 57.30, P < 0.0001; location: χ 21 = 188.73, P < 0.0001, Fig. 6c).
(a) Temperature (°C), (b) UV radiation index and (c) luminosity intensity (lux) as a function of time elapsed through the day and of sampling location within Tropical Forest 1 site (open area in black and surrounding undergrowth in grey). At the time of sample collection, sunrise occurred at 06:00 am and sunset around 06:00 pm. Data points show actual values, and predicted values fitted with the GLM model are in plain lines assorted with 95% CI in light grey.

Discussion
In this study, we expected circadian variation in coccidial oocysts shedding to be found in temperate, but not in tropical forest habitat, consistent with the hypothesis that this trait in parasites is maintained by natural selection to avoid desiccation and UV radiation, to which oocysts are sensitive before sporulation. We predicted that in an environment where solar radiation reaching the ground is dramatically reduced, like in the dense undergrowth of a tropical forest, the circadian output of oocysts typically found in bird coccidia would disappear. Our results clearly confirmed this prediction since circadian variation in coccidian oocysts was high in the temperate forest (i.e. 90% of birds were infected in the late afternoon and almost none in the morning) and absent in the tropical forest (approximately 20% of birds shed oocyst in their faces whatever the hour of trapping). Furthermore, at a smaller spatial scale in the Tropical Forest 1 site, a similar result was found, as birds captured in the open area showed a strong circadian variation contrary to bird species from the surrounding undergrowth of the rain forest.
The main goal of this study was to go one step further regarding the adaptive significance of circadian variation in coccidial oocysts shedding in birds, demonstrated in all tested species including birds living in the arctic area (see Knight et al., Reference Knight, Ewen, Brekke, Santure, Rollinson and Stothard2018 for a review). Ten years earlier, Martinaud et al. (Reference Martinaud, Billaudelle and Moreau2009) experimentally demonstrated that the release of oocysts in the late afternoon was an adaptative trait to avoid desiccation and UV radiation, thus reducing mortality of oocysts in the external environment. Before our study, such a circadian pattern appeared to be a ubiquitous phenomenon in intestinal bird parasites, since all studies showed that oocyst shedding peaks in the late afternoon (reviewed in Knight et al., Reference Knight, Ewen, Brekke, Santure, Rollinson and Stothard2018). To our knowledge, this study is the first to document the absence of circadian variation in coccidial oocysts shedding in a large set of species inhabiting the undergrowth of a rain forest. This environment is characterized by low luminosity and low UV radiation levels reaching the ground, combined with high soil and air moisture (Chazdon and Fetcher, Reference Chazdon and Fetcher1984; Vazquez-Yanes et al., Reference Vazquez-Yanes, Orozco-Segovia, Rincon, Sanchez-Coronado, Huante, Toledo and Barradas1990). All these abiotic characteristics are favourable for the survival of oocysts in host feces (Allen and Fetterer, Reference Allen and Fetterer2002). If temporal variation in the shedding of coccidial oocysts is a trait that has evolved under a natural selection to avoid desiccation and UV radiation as commonly thought (Martinaud et al., Reference Martinaud, Billaudelle and Moreau2009), such a pattern should not be observed in an environment where these abiotic selective pressures are relaxed. Contrary to the continuous multi-layered vegetation canopy of rain forests, the canopy in temperate forests is moderately dense and allows greater and seasonally varying light penetration (Anderson, Reference Anderson1964; Koizumi and Oshima, Reference Koizumi and Oshima1985; Szwagrzyk et al., Reference Szwagrzyk, Szewczyk and Bodziarczyk2001). Moreover, most temperate forests are managed and affected by human activities, and light intensities reaching the ground may differ greatly according to the stage in the forest management (Canham and Marks, Reference Canham, Marks, Pickett and White1985; Buckley, Reference Buckley1992; McElrone et al., Reference McElrone, Choat, Gambetta and Brodersen2013). For example, in most recent cuts (1-year-old), light intensity was 3.5–5 times higher than that in uncut plots, and rapidly decreased over time following selection cutting, especially at the ground level (Beaudet et al., Reference Beaudet, Messier and Leduc2004). Therefore, temperate forests are exposed to a stronger and more variable irradiance compared to tropical rain forest. We observed marked temporal variation in the shedding of coccidial oocysts in birds from the temperate forest, consistent with previous studies (Knight et al., Reference Knight, Ewen, Brekke, Santure, Rollinson and Stothard2018). On the contrary, bird species living in the tropical forest did not show this diurnal variation. These results suggest that natural selection (evolutionary costs and benefits) may indeed shape release rhythms in Isospora spp. of birds like in many other parasite species (Reece et al., Reference Reece, Prior and Mideo2017).
In addition, comparing circadian variation in coccidial oocysts shedding within the tropical habitat between species exclusively living in the open area and those living in the surrounding undergrowth further supports this hypothesis. This open area was created at the construction of the field camp, more than 30 years ago, and has since selected bird species specialized in open habitats. Indeed, species captured in the open field were never caught in the undergrowth, like silver-beaked tanager (Ramphocelus carbo carbo), golden-sided euphonia (Euphonia cayennensis), violaceous euphonia (Euphonia violacea), tropical kingbird (Tyrannus melancholicus), great kiskadee (Pitangus sulphuratus), buff-throated saltator (Saltator maximus) and rufous-browed peppershike (Cyclarhis gujanensis). A review of the literature (Handbook of the Birds of the World Series) confirms that these bird species are specialists of open habitats. Unlike the surrounding undergrowth, this open area is characterized by strong level of luminosity and UV radiation reaching the ground. Indeed, during a typical day in the tropical environment, light intensity and UV radiation reaching the ground measured in the open area were on average 100 times higher compared to the ground in the undergrowth, at any time but in particular at midday. Furthermore, the field camp is located near the Equator, a place where the annual UV doses reach their maximum (Marks and Plewig, Reference Marks and Plewig1991), increasing the selective pressure towards a marked circadian variation in coccidial oocysts shedding. Therefore, Isospora sp. infecting birds living in this open area have likely been selected to evolve strong temporal variation in oocysts shedding allowing oocyst survival in such a harsh external environment.
Regarding variation in the intensity of Isospora spp. infection, we found that parasite load remained stable in temperate species through the day while it increased in tropical areas, to reach by the end of the afternoon approximately the same parasite load as in temperate species. This increase in oocyst release during the day confirms previous results on two species (Serinus serinus and Sylvia borin) in which coccidial parasite load in the feces peaked in the late afternoon (Lopez et al., Reference Lopez, Figuerola and Soriguer2007). The mechanisms underlying this process, however, are still unclear. After different phases of multiplication inside the intestinal tractus of its host, oocysts are released from its host cell and shed into the environment with the feces. The proximal factors triggering coccidian oocyst discharge are not identified yet but it is known that they are linked to host physiology (Boughton, Reference Boughton1933; Dolnik, Reference Dolnik1999a, Reference Dolnik1999b) and potentially mediated by melatonin, which regulates daily activity patterns in vertebrates. Indeed, outside polar regions with constant daylight, avian Isospora species use cyclic changes in melatonin concentration in their host blood to synchronize oocyst output (Dolnik et al., Reference Dolnik, Metzger and Loonen2011 and references therein). Therefore, we may hypothesize that the threshold of physiological signals inducing oocyst discharge is very low for tropical species inhabiting the dense undergrowth, allowing oocysts discharge early in the morning. The accumulation of these signals as the day progressed may induce the slight but continuous increase in parasite load observed in our data over the afternoon. Another but not exclusive hypothesis would be that the amount of feces produced could be higher in the late afternoon allowing a higher discharge in oocyst in the same time.
Finally, our results meet an interesting methodology issue for researchers interested in working on intestinal parasites like Isospora spp. in wild birds’ species (Biard et al., Reference Biard, Monceau, Motreuil and Moreau2015, Reference Biard, Saulnier, Gaillard and Moreau2010). Due to circadian rhythm in oocyst shedding in temperate habitat, there is a large difference in the number of Isospora sp. oocysts shed between the morning and afternoon for a given individual (Filipiak et al., Reference Filipiak, Mathieu and Moreau2009). Hence, to accurately assess, and make meaningful comparisons in, the prevalence of Isospora infection, sampling of feces must be standardized at the same time of the day, as already demonstrated in previous studies (Filipiak et al., Reference Filipiak, Mathieu and Moreau2009; Dolnik et al., Reference Dolnik, Dolnik and Bairlein2010). In the tropical rain forest where this circadian rhythm in oocyst shedding is absent, prevalence of infection may be assessed from feces collected at any time of the day. This makes it easier to work on the effects of intestinal parasites on bird host life-history traits such as sexually selected traits for instance (Brawner et al., Reference Brawner, Hill and Sundermann2000; Hõrak et al., Reference Hõrak, Saks, Karu, Ots, Surai and McGraw2004). However, as parasite load increases as the day progresses, we emphasize the need to precisely record the time of day at which samples are collected. If Isospora spp. parasite loads are to be compared, then sampling time should be standardized at the same time of day.
Concluding remarks
We believe that studying tropical birds improved our knowledge of the ecology of Isospora spp. in natural populations of hosts and the adaptive significance of daily rhythm in oocyst shedding. The available information on intestinal parasites in tropical birds to date is scarce as research has often focused on blood parasites (Ricklefs, Reference Ricklefs1992; Durrant et al., Reference Durrant, Beadell, Ishtiaq, Graves, Olson, Gering, Peirce, Milensky, Schmidt, Gebhard and Fleischer2006; Ricklefs and Sheldon, Reference Ricklefs and Sheldon2007; Merino et al., Reference Merino, Moreno, Vásquez, Martínez, Sánchez-Monsálvez, Estades, Ippi, Sabat, Rozzi and Mcgehee2008; Svensson-Coelho et al., Reference Svensson-Coelho, Ellis, Loiselle, Blake and Ricklefs2014). Our study clearly showed that the knowledge on the interaction between parasites and hosts in the temperate area cannot be transposed for birds in tropical area. Therefore, future investigations are needed to reveal more information on host–parasite interactions concerning the probability to be infected in the two different ecosystems. A comparative analysis with a large set of species would be very useful to investigate the ecological factors and host life-history traits underlying parasite diversity across different ecological contexts (tropical vs temperate).
Data
Once the paper has been accepted, data will be deposited in the Dryad.
Acknowledgements
This study has been conducted within the French natural reserve of Nouragues. We acknowledge the Nouragues CNRS research field station (USR mixte LEEISA, CNRS; Cayenne) and the staff dedicated. We thank all the people who contributed to the fieldwork.
Author contributions
CB, KM and JM conceived and designed the study. CB, MT, SM, SBA, LD and JM conducted data gathering. KM and JM performed statistical analyses. CB, KM and JM wrote the article.
Financial support
We acknowledge the Nouragues CNRS research field station, which benefits from ‘Investissement d'Avenir’ grants managed by Agence Nationale de la Recherche (AnaEE France ANR-11-INBS-0001; Labex CEBA ANR-10-LABX-25-01).
Conflict of interest
The authors declare there are no conflicts of interest.
Ethical standards
This work conforms to French legal requirements, and accepted international ethical standards, including those relating to conservation and welfare, and to the journal's policy on these matters. We thank the Direction Régionale de l'Environnement, de l'Aménagement et du Logement (DREAL) de la Guyane, de la Nouvelle-Aquitaine et du Loir et Cher for delivering legal authorizations of catching birds (authorization nos.: R03-2018-07-17-002, R03-2019-03-14-005, 128/2017, 2019D/2323 and 41-2018-04-03-002).