



1. Introduction
The breakup of stretching ligaments is a common phenomenon in everyday life experience, e.g. animal drinking strategies (Reis et al. Reference Reis, Jung, Aristoff and Stocker2010; Kim & Bush Reference Kim and Bush2012; Gart et al. Reference Gart, Socha, Vlachos and Jung2015), drop formations (Villermaux Reference Villermaux2007; Javadi et al. Reference Javadi, Eggers, Bonn, Habibi and Ribe2013; Rubio-Rubio, Sevilla & Gordillo Reference Rubio-Rubio, Sevilla and Gordillo2013) or pathogen aerosolizations (Abkarian & Stone Reference Abkarian and Stone2020). Various industrial applications are based on the stretching process, such as the manufacture of glass or polymer fibres (Griffiths & Howell Reference Griffiths and Howell2008; Bechert & Scheid Reference Bechert and Scheid2017), gravure printing (Kumar Reference Kumar2015), tip streaming for single or double emulsification (Evangelio, Campo-Cortés & Gordillo Reference Evangelio, Campo-Cortés and Gordillo2016), measurement of extensional viscosity (Spiegelberg, Ables & McKinley Reference Spiegelberg, Ables and McKinley1996) or food processing (Jimenez, Martínez Narváez & Sharma Reference Jimenez, Martínez Narváez and Sharma2020). In printing processes such as roll coating, stretching ligaments have been shown to be at the origin of misting, which is the undesirable formation of aerosol droplets (Owens et al. Reference Owens, Vinjamur, Scriven and Macosko2011).
In different geometries, there are mainly three axisymmetric stretching configurations: (i) ligaments stretched out of a nozzle, (ii) ligaments stretched between disks, and (iii) ligaments drawn out of a liquid bath. (i) The properties of ligaments stretched out of a nozzle by gravity (Padday et al. Reference Padday, Pétré, Rusu, Gamero and Wozniak1997; Clanet & Lasheras Reference Clanet and Lasheras1999; Henderson et al. Reference Henderson, Segur, Smolka and Wadati2000; Javadi et al. Reference Javadi, Eggers, Bonn, Habibi and Ribe2013; Rubio-Rubio et al. Reference Rubio-Rubio, Sevilla and Gordillo2013; Martínez-Calvo, Rubio-Rubio & Sevilla Reference Martínez-Calvo, Rubio-Rubio and Sevilla2018) or by viscous stresses (Dewandre et al. Reference Dewandre, Rivero-Rodriguez, Vitry, Sobac and Scheid2020) have been extensively studied, and three distinct regimes can be identified by the flow rate provided by the nozzle: a periodic dripping regime for low flow rates, a dripping faucet regime for intermediate flow rates and a jetting regime for high flow rates. (ii) Ligaments stretched between two disks, mainly one of the disks being pulled up at a constant velocity or acceleration, have been studied by Zhang, Padgett & Basaran (Reference Zhang, Padgett and Basaran1996), Vincent, Duchemin & Villermaux (Reference Vincent, Duchemin and Villermaux2014b), Zhuang & Ju (Reference Zhuang and Ju2015), Wylie, Bradshaw-Hajek & Stokes (Reference Wylie, Bradshaw-Hajek and Stokes2016) and Brulin, Tropea & Roisman (Reference Brulin, Tropea and Roisman2020). Two different regimes depending on the Ohnesorge number can be observed: the breakup length stays nearly constant or even decreases with the stretching velocity for low Ohnesorge numbers, whereas it keeps increasing for high Ohnesorge numbers. (iii) Ligaments drawn out of a bath have more involved boundaries, namely an upward moving boundary and a bath exchange boundary. It has received less attention, the few investigations being reported by Marmottant & Villermaux (Reference Marmottant and Villermaux2004), Reis et al. (Reference Reis, Jung, Aristoff and Stocker2010), Gart et al. (Reference Gart, Socha, Vlachos and Jung2015), Zheng, Liu & Luo (Reference Zheng, Liu and Luo2013), and more recently, by Kim, Kim & Jung (Reference Kim, Kim and Jung2018). In all these works, ligaments characterized by small Ohnesorge numbers have been studied, whose breakup times are approximately the capillary instability time scale. In the present paper we consider ligaments drawn out of a pure-liquid bath with large Ohnesorge numbers, and unravel the drawing dynamics from the initial static meniscus to the final pinch-off.
When the drawing velocity is very slow, the subject is reduced to a quasi-static problem, namely the rod-in-free-surface problem, as referred by Padday & Pitt (Reference Padday and Pitt1973). As we consider ligaments between a perfectly wetting rod bottom and an infinite pure-liquid bath, a fixed contact line condition at the rod boundary and a constant pressure condition at the bath boundary should be imposed. Unlike static menisci of films (Heller Reference Heller2008), there is no apparent analytical solution for the rod-in-free-surface meniscus. Profiles and stabilities of axisymmetric menisci have been extensively studied (Padday & Pitt Reference Padday and Pitt1973; Kovitz Reference Kovitz1975; Pitts Reference Pitts1976; Benilov & Oron Reference Benilov and Oron2010; Benilov & Cummins Reference Benilov and Cummins2013). In particular, Pitts (Reference Pitts1976) put forward the analytical proof of the unstable region; Benilov & Oron (Reference Benilov and Oron2010) pointed out there could be two solutions for a certain height, and only one is stable. Two limits exist in the problem, respectively for very large and very small rods. The former can be described analytically by omitting the radial curvature (Benilov & Oron Reference Benilov and Oron2010), while the latter is much more difficult, the analytical attempts are given by Kovita (Reference Kovitz1975) and James (Reference James1974), but only at the leading order in the expansion of the small rod radius. The first objective of this work is to describe the static, and, therefore, the quasi-static meniscus for very small rods by numerical and analytical methods.
When the drawing velocity is higher, the breakup height of ligaments results from the interaction of ductility and capillarity (Ide & White Reference Ide and White1976). By ductility we mean the diameter reduction caused by viscous stretching in the absence of capillary forces, which has been widely studied in non-Newtonian stretching problems (Ide & White Reference Ide and White1976; Zhu & Wang Reference Zhu and Wang2013). By capillarity we mean capillary instability, pioneered by Rayleigh (Reference Rayleigh1878, Reference Rayleigh1892) and later extended by Keller, Rubinow & Tu (Reference Keller, Rubinow and Tu1973) and Huerre & Monkewitz (Reference Huerre and Monkewitz1990). Drawing or ductile effects on capillarity have attracted much attention, as first considered by Tomotika & Taylor (Reference Tomotika and Taylor1936). Frankel & Weihs (Reference Frankel and Weihs1985, Reference Frankel and Weihs1987) and Henderson et al. (Reference Henderson, Segur, Smolka and Wadati2000) pointed out that the most amplified wavelength is no longer constant for a drawing ligament or jet. These works are based on the linear stability analysis, which does not allow us to account for the transient dynamics of drawing. Hence, the second objective of this work is to unravel the transient drawing dynamics considering both ductile and capillary effects.
The last stage of the ligament drawing dynamics is the pinch-off leading to breakup. Due to the highly nonlinear effect, it is not until the last few decades that mathematical descriptions of pinch-off phenomena have been carried out by using similarity methods. Eggers (Reference Eggers1993) first found a universal solution in the viscous-inertial regime for Newtonian ligaments, which is independent of the initial and outside conditions. Later followed the solutions in the viscous regime (Papageorgiou Reference Papageorgiou1995) and in the inertial regime (Day, Hinch & Lister Reference Day, Hinch and Lister1998) for viscous and inviscid ligaments, respectively. An extensive literature exists on transitions of pinch-off regimes (Li & Sprittles Reference Li and Sprittles2016; Verbeke et al. Reference Verbeke, Formenti, Vangosa, Mitrias, Reddy, Anderson and Clasen2020), and a good overview can be found in Eggers (Reference Eggers2005). The third objective of this work then is to determine the role of the pinch-off stage in the drawing dynamics.
In this paper we present a non-stationary one-dimensional model to describe the ligaments drawn out of a pure-liquid bath. A one-dimensional model based on a long-wavelength description has been widely used in breakup problems (Eggers Reference Eggers1993; Eggers & Dupont Reference Eggers and Dupont1994; Eggers Reference Eggers2005; Augello Reference Augello2015), which gives huge savings in the computer time and simplifies the analysis compared with the two-dimensional axisymmetric model. After obtaining the numerical results, we investigate the drawing dynamics around the above three objectives by analytical and quantitative analyses. Experimental and two-dimensional results are also presented to validate the one-dimensional model and analyse the deviations. This paper will be organized in the following sequence. The one-dimensional model is presented in § 2. Static results and dynamic results are shown and discussed in §§ 3 and 4, respectively. Then we compare the one-dimensional model with the experiments in § 5 and with the two-dimensional model in § 6. The entrained liquid volume is presented in § 7 as an application, and conclusions are finally given in § 8.
2. One-dimensional model
2.1. Problem settings
We consider a liquid ligament drawn out of a pure-liquid bath by a perfectly wetting rod at a constant velocity  $U$. The liquid under consideration is incompressible and Newtonian, of dynamic viscosity
 $\mu$, density
 $\rho$ and surface tension
 $\gamma$. As shown in figure 1, a cylindrical coordinate system is built, the centre is fixed at the initial position of the rod bottom. The rod has a circular cross-section of radius
 $R$, the meniscus then is pinned at
 $r=R$. During the whole drawing process the ligament is assumed to be axisymmetric with respect to the
 $z$-axis, so that the interface is defined at
 $r=f(z,t)$, with
 $t$ the time. According to the one-dimensional model built by Eggers & Dupont (Reference Eggers and Dupont1994), the two-dimensional axisymmetric partial differential system presented in § 6.1, can be reduced to a system of three equations:
Sketches of the liquid ligament under consideration, showing the notations, in particular the locations  $z_d$,
 $z_s$, and
 $L(t)$ where the boundary conditions are imposed. The origin of the cylindrical coordinate system is fixed at the initial position of the rod bottom. The initial configuration is presented in
 $(a)$, where a static meniscus is formed between the rod (located at
 $z=0$) and the bath (located at
 $z=-H_s$, dotted line) with a static meniscus angle
 $\theta _s = {\rm \pi}/2$,
 $g$ is gravity. The configuration in
 $(b)$ represents the liquid ligament at a later time, with a dynamic meniscus angle
 $\theta (t)$. The distance between the bath and the rod bottom is defined as the height
 $H(t)$, whereas the distance travelled by the rod is defined as the length
 $L(t)$.

(i) mass conservation equation
(2.1) \begin{equation} \partial_t \,f^2 + \partial_z \left(\,f^2 u \right)= 0, \end{equation}
(ii) momentum equation
(2.2)\begin{equation} f^2 \rho \left(\partial_t u + u \partial_z u \right) + f^2 \gamma \partial_z K + f^2 \rho g - 3 \mu \partial_z \left( f^2 \partial_z u \right)= 0, \end{equation}(iii) mean curvature
(2.3)\begin{equation} K(z,t) = \frac{1}{f \left[1 + (\partial_z f)^2 \right]^{1/2}} - \frac{\partial_{zz} f}{\left[1 + (\partial_z f)^2 \right]^{3/2}}, \end{equation}


where  $u=u(z,t)$ is the extensional velocity and
 $K$ is the mean curvature. The first two terms in (2.2) account for inertia while the rest account, respectively, for capillary pressure, gravity and the extensional viscous stress (Trouton Reference Trouton1906). Note that we keep the full expression of the curvature in the one-dimensional model, as it allows us to have a full description of the ligament including the regions close to the bath and the rod. The same approaches have proven to provide good agreement with experimental results for ligaments (Eggers & Dupont Reference Eggers and Dupont1994; Clasen et al. Reference Clasen, Eggers, Fontelos, Li and Mckinley2006; van Hoeve et al. Reference van Hoeve, Gekle, Snoeijer, Versluis, Brenner and Lohse2010; Vincent, Duchemin & Le Dizès Reference Vincent, Duchemin and Le Dizès2014a; Martínez-Calvo et al. Reference Martínez-Calvo, Rubio-Rubio and Sevilla2018) and films (Champougny et al. Reference Champougny, Rio, Restagno and Scheid2017; Kofman et al. Reference Kofman, Rohlfs, Gallaire, Scheid and Ruyer-Quil2018). In particular, in Martínez-Calvo et al. (Reference Martínez-Calvo, Rubio-Rubio and Sevilla2018) the authors used it for the same geometry: a ligament and a liquid bath, with remarkable agreement.
2.2. Non-dimensionalised problem
Applying the following transformations,
 \begin{gather} f \rightarrow R f , \quad z \rightarrow R z , \quad H \rightarrow R H , \quad L \rightarrow R L , \end{gather}
 \begin{gather} K \rightarrow \frac{1}{R}K , \quad u \rightarrow \frac{\gamma}{\mu} u , \quad t \rightarrow \frac{\mu R}{\gamma} t , \end{gather}
the non-dimensional system of equations becomes
 \begin{gather} \partial_t\, f^2 + \partial_z (\,f^2 u)= 0, \end{gather}
 \begin{gather} \frac{1}{Oh^2} f^2 \left(\partial_t u + u \partial_z u \right) + f^2 \left( \partial_z K + Bo \right) - 3 \partial_z \left( f^2 \partial_z u \right)= 0, \end{gather}
 \begin{gather} K(z,t) = \frac{1}{f \left[1 + (\partial_z f)^2 \right]^{1/2}} - \frac{\partial_{zz} f}{\left[ 1 + (\partial_z f)^2 \right]^{3/2}} , \end{gather}
where  $Bo$ and
 $Oh$ are the Bond and Ohnesorge numbers, respectively, defined as
 \begin{equation} Bo= \frac{\rho g R^2}{\gamma}\text{ and} \quad Oh = \frac{\mu}{\sqrt {\rho \gamma R}}. \end{equation}
2.3. Initial and boundary conditions
The dynamic system requires two initial conditions respectively for  $f$ and
 $u$. Naturally, we consider the static meniscus shown in figure 1 as the initial profile, with a static meniscus angle
 $\theta _s$ at the rod bottom, which is located at a dimensionless height
 $H_s$ above the bath. Simplified from (2.6) and (2.7), the non-dimensional static system is
 \begin{gather} K_{s}^\prime ={-} Bo , \end{gather}
 \begin{gather} K_{s} = \frac{1}{f_{s} \left(1 + \,f_{s}^{\prime 2} \right)^{1/2}} - \frac{f_{s}^{\prime \prime}}{\left(1 + \,f_{s}^{\prime 2} \right)^{3/2}} , \end{gather}
where  $\,f_{s}(z)$ represents the static profile,
 $K_{s}(z)$ the static curvature and the prime denotes the derivative with respect to the
 $z$-coordinate. It is an ordinary differential equation system requiring three boundary conditions,
 $$\begin{gather} K_{s} ( - H_{s} ) = 0, \end{gather}$$
 $$\begin{gather}f_{s}^{\prime} ( - H_{s} ) ={-} \infty , \end{gather}$$
 $$\begin{gather}f_{s}(0) = 1 , \end{gather}$$
where  $-H_{s}$ is the position of the flat bath. However, an analytical solution does not obviously exist and a numerical method should be applied. Firstly, integrating (2.9) with respect to
 $z$ and using the boundary condition (2.11a) yields
 \begin{equation} K_{s} ={-} Bo \left( z + H_{s} \right) . \end{equation}
Substituting (2.10) into (2.12), we obtain
 \begin{equation} f_{s}^{\prime \prime} = Bo \left( z + H_{s} \right) \left( 1+ \,f_{s}^{\prime 2} \right)^{3/2} + \frac{1}{f_{s}} \left( 1 + \,f_{s}^{\prime 2} \right) . \end{equation}
To avoid the infinite boundary condition (2.11b), a position  $z_s$ (see figure 1) close to the bath is used as the new boundary, i.e.
 $f_{s}^\prime (-H_{s})$ is replaced by
 $\,f_{s}^\prime ( z_s)$. According to Benilov & Oron (Reference Benilov and Oron2010), the asymptotic solutions of
 $f_s$ and
 $f_s^\prime$ close to the bath are
 $$\begin{gather} f_{s} (z_s) = \frac{1}{\sqrt{Bo} } \left[ -\ln(a(z_s+H_{s})) - \frac{ \ln (-\ln(a(z_s+H_{s}))) }{2} - \frac{ 2 \ln (-\ln(a(z_s+H_{s})))-1 }{8 \ln(a(z_s+H_{s})) } \right] \nonumber\\ +\,O\left[ \frac{1}{\sqrt{Bo} } \left( \frac{ \ln(-\ln(a(z_s+H_{s}))) }{ \ln(a(z_s+H_{s})) } \right)^2 \right], \end{gather}$$
 $$\begin{gather}f_{s}^\prime (z_s) ={-}\frac{1}{\sqrt{Bo} (z_s + H_{s})} \left[ 1+ \frac{1}{2 \ln ( a(z_s+H_{s}))} + \frac{3-2\ln(-\ln(a(z_s+H_{s})))}{8 \left( \ln(a(z_s+H_{s})) \right)^2} \right] \nonumber\\ +\,O\left[ \frac{2\ln(-\ln(a(z_s+H_{s}))) \left( 1- \ln(-\ln(a(z_s+H_{s})))\right)}{\sqrt{Bo} (z_s+H_{s}) \left( \ln a(z_s+H_{s})\right)^3} \right], \end{gather}$$
for  $z_s \rightarrow -H_{s}$, where
 $a$ is a positive constant parameter. To obtain the static solution for a certain
 $Bo$ and a certain
 $H_s$, we seek for the corresponding parameter
 $a(Bo, H_s)$, namely shooting
 $f_s$ using (2.14) and adjusting the parameter
 $a$ until
 $f_s$ satisfies (2.11c). After obtaining the solutions, we calculate the static meniscus angles
 $\theta _s$ using
 $f_s^{\prime } (0)$ and find that two solutions with two
 $\theta _s$ (equivalently
 $a$) exist for most of the cases. Instead, we found it more convenient to parametrize the profile, the meniscus height and the parameter
 $a$ with
 $Bo$ and
 $\theta _s$ henceforth, namely
 $f_{s} (z, Bo, \theta _s)$,
 $H_{s} (Bo, \theta _s)$ and
 $a (Bo, \theta _s)$. For the following, we define the static meniscus height with a right angle meniscus as
 $H_{{\rm \pi} /2,s} (Bo) = H_s (Bo, {\rm \pi}/2)$, the maximum static meniscus height of a certain
 $Bo$ as
 $H_{b,s} (Bo)$, and the corresponding static meniscus angle as
 $\theta _{b,s}$, hence
 $H_{b,s} (Bo)=H_s (Bo,\theta _{b,s})$ and
 $\partial _{\theta _s} H_s (Bo, \theta _{b,s})=0$.
As presented in figure 1, one can draw ligaments from static menisci with various initial  $\theta _s$. We show in Appendix A that the contraction stages are reasonably independent of the initial
 $\theta _s$, while the preliminary stages can be significantly influenced by
 $\theta _s$. We also show in § 6.2 that strong two-dimensional effects exist for ligaments close to the bath. Hence, to focus on the contraction dynamics and avoid the two-dimensional effects, we consider ligaments drawn from static menisci with
 $\theta _s={\rm \pi} /2$, i.e. from an initial height
 $H_{{\rm \pi} /2,s}$, in the present paper. The dimensionless initial conditions and the initial guess for
 $K$ are
 $$\begin{gather} f(z,0) = \,f_{s} (z, Bo, {\rm \pi}/2), \end{gather}$$
 $$\begin{gather}u(z,0) = \frac{Ca}{ f_{s}^2 (z,Bo,{\rm \pi}/2)} , \end{gather}$$
 $$\begin{gather}K(z,0) = K_{s} (z, Bo, {\rm \pi}/2) , \end{gather}$$
where the capillary number  $Ca$ is defined as
 \begin{equation} Ca = \frac{\mu U}{\gamma} . \end{equation}
According to the dimensionless transformations (2.4),  $Ca$ henceforth is also mentioned as the dimensionless drawing velocity. We approximate the initial condition (2.15b) on
 $u$ by solving the stationary version of the conservation equation (2.5), using the constant speed at the rod as the boundary condition (see (2.17b)).
For the boundary conditions, using the same strategy as Champougny et al. (Reference Champougny, Rio, Restagno and Scheid2017), four boundary conditions are required, two at the rod side,
 $$\begin{gather} f ( L(t) , t ) = 1 , \end{gather}$$
 $$\begin{gather}u ( L(t) , t ) = Ca , \end{gather}$$
where  $L(t)=Ca\, t$ is the dimensionless position of the rod, and two at a position
 $z_d$ close to the bath,
 $$\begin{gather} \partial_z f(z_d,t) = \partial_z \,f_{s} (z_d, Bo, {\rm \pi}/2), \end{gather}$$
 $$\begin{gather}K (z_d,t) = K_{s} (z_d, Bo, {\rm \pi}/2) . \end{gather}$$
The boundary conditions (2.18) impose that the profile sufficiently close to the bath ( $-H_s < z < z_d$) generally remains static and can translate horizontally, as we only fix the slope and the curvature at that boundary. This quasi-static approach will later be validated in § 6.2, and can also be found in simulations of fibres (Ryck & Quéré Reference Ryck and Quéré1996), plates (Scheid et al. Reference Scheid, Delacotte, Dollet, Rio, Restagno, van Nierop, Cantat, Langevin and Stone2010) and films (Champougny et al. Reference Champougny, Rio, Restagno and Scheid2017) pulled out of a liquid bath. Note that, now there are two near-bath boundary positions
 $z_s$ and
 $z_d$ respectively for the static and the dynamic systems, with the relationship
 $-H_s < z_s < z_d <0$ (see figure 1). The reasons we do not keep
 $z_s$ in the dynamic system are: on the one hand,
 $-\partial _z \,f_{s} \approx 1/( Bo^{1/2} (z_s+H_s) )$ inferred from (2.14b) can be quite large for small
 $Bo$ and brings convergence difficulties for the partial differential equation (PDE) system; on the other hand, we show in Appendix B that the results are independent of the boundary position for
 $-\partial _z \,f_{s} \gtrsim 100$. In practice, we first solve the static system with
 $z_s = -0.999 H_{s}$ (ensuring the three decimal accuracy for
 $H_{s}$), obtaining
 $f_s$,
 $\partial _z f_s$ and
 $K_s$, then solve the dynamic system with
 $\partial _z f_s$ and
 $K_s$ at the position
 $z_d$ where
 $\partial _z \,f_{s} = -100$.
Based on the above, it results that the problem is governed by three independent parameters, the Bond number  $Bo$, the capillary number
 $Ca$ and the Ohnesorge number
 $Oh$. Finally, the Ohnesorge number can also be expressed as a function of
 $Bo$,
 \begin{equation} Oh= \frac{\mu}{Bo^{1/4} \sqrt{\rho \gamma \ell_c }} , \end{equation}
such that only  $Bo$ and
 $Ca$ should be varied independently for a given liquid. The dimensional physicochemical parameters we implement in the simulations (except Appendix C) are those of the
 $V5000$ silicone oil that we used in the experiments presented in § 5, namely
 $\mu = 4.92\ \text {Pa}\,\text {s}$,
 $\rho = 970\ \text {kg}\,\text {m}^{-3}$,
 $\gamma = 21.1\ \text {mN}\,\text {m}^{-1}$. We will show both numerically in Appendix C and experimentally in § 5 that drawing processes are reasonably independent of the Ohnesorge number for large-viscosity liquids with
 $\mu \geq 0.5\ \text {Pa}\,\text {s}$. The following parameter space is therefore considered in the present paper:
 $$\begin{gather} 10^{{-}4} \leq Bo \leq 1 , \end{gather}$$
 $$\begin{gather}10^{{-}5} \leq Ca \leq 1 , \end{gather}$$
 $$\begin{gather}2.86 \leq Oh . \end{gather}$$
The static system of ordinary differential equations (2.13), (2.14) and (2.11c) is solved using MATLAB R2019b. The dynamic system of partial differential equations (2.5)–(2.7), supplemented by the initial conditions (2.15) and boundary conditions (2.17)–(2.18), is solved using the direct solver MUMPS in COMSOL 5.4. The computational domain  $(z_d \le z \le L(t))$ is deforming with time due to the moving rod boundary, thus, the arbitrary Lagrangian–Eulerian (ALE) algorithm is applied for the moving mesh computation.
3. Static results
In this section we present the numerical results obtained when solving the static system in § 2. In particular, we focus on the mathematical formulation in the small rod configuration corresponding to the low gravity case. Furthermore, it should be noted in the dimensionless momentum equation (2.6) that  $Bo \rightarrow 0$ implies the disappearance of gravity, referred hereafter to as the agravic limit.
3.1. Basic results
We first consider the static meniscus height  $H_s (Bo, \theta _s)$, the results of which are shown in figure 2
 $(a)$. For a certain
 $Bo$,
 $H_s$ first increases with
 $\theta _s$ and reaches the maximum value
 $H_{b,s}$ when
 $\theta _s=\theta _{b,s}$, then decreases with
 $\theta _s$. Note that, as given in (2.4), we non-dimensionalise the meniscus height with the rod radius
 $R$, the square of which appears in
 $Bo$. To show the dependence of meniscus heights on
 $R$ or equivalently on
 $Bo$, we present
 $\sqrt {Bo}\, H_{s}$ in figure 2
 $(b)$, namely the meniscus height non-dimensionalised by the capillary length
 $\ell _c$ (
 $\ell _c=\sqrt {\gamma /\rho g}$). It can be observed that though
 $H_{s}$ decreases with
 $Bo$,
 $\sqrt {Bo}\, H_{s}$ increases with
 $Bo$. The maximum height curve, as shown by the dashed line in figure 2, shows
 $\theta _{b,s}$ varying between 0 for
 $Bo \rightarrow \infty$ and
 ${\rm \pi} /2$ for
 $Bo \rightarrow 0$ (Padday & Pitt Reference Padday and Pitt1973). This critical curve further separates the static menisci into the unstable (
 $\theta _s < \theta _{b,s}$), the stable (
 $\theta _s > \theta _{b,s}$) and the neutral (
 $\theta _s = \theta _{b,s}$) regions (Padday & Pitt Reference Padday and Pitt1973; Pitts Reference Pitts1976; Benilov & Oron Reference Benilov and Oron2010). The static meniscus with
 $\theta _s = {\rm \pi}/2$ is therefore always stable, i.e. for all values of
 $Bo$. It thus appears as the suitable choice for the initial solution of the dynamic system of equations, as set up in § 2.3. Figure 3
 $(a)$ shows
 $H_s$ varying with
 $Bo$ for various
 $\theta _s$,
 $H_{s}$ tends to be linear to
 $\ln Bo$ with different slopes depending on
 $\theta _s$. The first derivative of
 $H_s$ with respect to
 $\ln Bo$ is presented in figure 3
 $(b)$, showing that the linear relationship holds when
 $Bo \lesssim 10^{-2}$, and the slopes tend to be the same for supplementary angles. This relationship is mentioned as the Derjaguin–James formula in the literature Tang (Reference Tang and Cheng2019), which has been analysed analytically James (Reference James1974), but only at the leading order. A similar behaviour was reported by Kovitz (Reference Kovitz1975), the author having observed that the envelope of menisci of various radii behaves like
 $y \sim - x \ln x$ with
 $y = \sqrt {Bo} (z+H_{s})\, {\rm and}\ x = \sqrt {Bo} \,f_{s}$, when
 $Bo \rightarrow 0$.
Dimensionless height of the static meniscus  $H_{s}$ in
 $(a)$, and rescaled height
 $\sqrt {Bo}\, H_{s}$ in
 $(b)$, varying with static meniscus angle
 $\theta _s$ for different values of
 $Bo$. The dashed lines represent the maximum height cases for
 $\theta _s = \theta _{b,s}$.

Dimensionless height of the static meniscus  $H_{s}$ in
 $(a)$ and first derivative of
 $H_s$ with respect to
 $\ln Bo$ in
 $(b)$, varying with
 $Bo$ for different values of the static meniscus angle
 $\theta _s$. The dashed lines represent the maximum height cases
 $H_{b,s}$ for
 $\theta _s = \theta _{b,s}$, the squares in
 $(b)$ represent the analytical values of
 $(\sin \theta _s )/2$ (see (3.11a)).

3.2. Static meniscus in the low gravity case
As suggested by the results in the previous section, some simplifications can arise in the low gravity case corresponding to  $Bo \lesssim 10^{-2}$. To unravel the underlying mechanism, we introduce the radial curvature
 $K_r$, the axial curvature
 $K_a$ and define
 $K_g$ as the gravity term,
 \begin{equation} K_r = \frac{1}{f_{s} \left(1 + \,f_{s}^{\prime 2} \right)^{1/2}}, \quad K_a ={-} \frac{f_{s}^{\prime \prime}}{\left(1 + f_{s}^{\prime 2} \right)^{3/2}} , \quad K_g ={-} Bo ( z + H_{s}) . \end{equation}
Then the static system (2.12) can be written as a balance between the three components of pressure,  $K_r + K_a = K_g$. Typical profiles and comparisons of the three terms for
 $\theta _s={\rm \pi} /2$ are presented in figure 4. At the rod boundary (
 $z=0$), we have boundary conditions
 $f_{s} = 1$ and
 $f_{s}^\prime = \cot \theta _s$, leading to a finite radial curvature
 $K_r$. On the other hand, the gravity term
 $K_g$ is at least one order of magnitude smaller than
 $K_r$ for
 $Bo \lesssim 10^{-2}$. In fact, not only at the rod boundary but also from a position slightly above the bath, the relationship
 $K_r \approx - K_a \gg K_g$ holds, as shown in figure 4
 $(b)$. The top region of the static meniscus therefore can be described as
 \begin{equation} \frac{1}{f_{s} \left(1 + \,f_{s}^{\prime 2} \right)^{1/2}} - \frac{f_{s}^{\prime \prime}}{\left(1 + \,f_{s}^{\prime 2} \right)^{3/2}} \approx 0 \quad \text{for } Bo \lesssim 10^{{-}2} \text{ and }z \gnsim -H_{s}, \end{equation}
in which  $O(Bo)$ terms have been omitted. Note that we use the symbol
 $\gnsim -H_{s}$ to represent the position away from the bath, we will later use the opposite symbol
 $\lnsim 0$ to represent the position away from the rod, namely the top region and the bottom region, respectively. The solution of the top region static meniscus with
 $\theta _s={\rm \pi} /2$ can be found in de Gennes, Brochard-Wyart & Quéré (Reference de Gennes, Brochard-Wyart and Quéré2004), which turns out to be a catenoid. In Appendix D we derive the solutions for arbitrary
 $\theta _s$, obtaining
 $$\begin{gather} f_{s, top} (z, \theta_s) \approx \cos^2 \left( {\frac {\theta_s}{2} } \right) \exp \left(\frac{z}{\sin \theta_s}\right) + \sin^2 \left({\frac {\theta_s}{2} }\right) \exp \left(\frac{- z}{\sin \theta_s}\right) \nonumber\\ \text{for } Bo \lesssim 10^{{-}2} \text{ and }z \gnsim -H_{s} . \end{gather}$$
This profile being independent of  $Bo$, it automatically describes the entire meniscus profile in the agravic limit, i.e. for
 $Bo \rightarrow 0$.
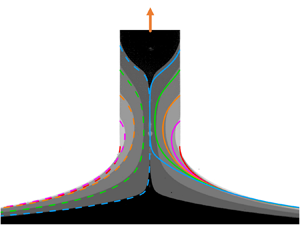
Typical results of static menisci for  $\theta _s = {\rm \pi}/2$ and different values of
 $Bo$.
 $(a)$ Static profiles in solid lines as compared with the static meniscus in the agravic limit (see (3.3)) as a dashed line.
 $(b)$ The radial curvatures
 $K_r$ in solid lines, the axial curvature
 $-K_a$ in dashed lines and the gravity term
 $K_g$ in dotted lines.

In the meniscus region away from the rod the derivative  $f_{s}^\prime$ becomes large, i.e.
 $\,f_{s}^{\prime 2} \gg 1$. Following the work of Benilov & Oron (Reference Benilov and Oron2010), the bottom region of the static meniscus can then be described as
 \begin{equation} - \frac{1}{f_{s} \,f_{s}^\prime} + \frac{f_{s}^{\prime \prime}}{f_{s}^{\prime 3}} \approx{-} Bo ( z + H_{s})\quad \text{for } z \lnsim 0 . \end{equation}
The solution of the bottom region has the form
 \begin{equation} f_{s} (z, Bo, \theta_s) \approx \frac{1}{\sqrt Bo} F (x) \quad \text{for } x >0 , \end{equation}
where  $x = a (z+H_{s})$, in which
 $a=a (Bo, \theta _s)$ is the positive parameter in (2.14b), and
 $F(x)$ is a certain function to be determined. As shown in figure 5
 $(a)$,
 $a(Bo, \theta _s)$ tends to be symmetric around
 ${\rm \pi} /2$ and converges to a certain
 $a(\theta _s)$ for
 $Bo \lesssim 10^{-2}$, where the explicit expression for
 $a(\theta _s)$ is derived below. Meanwhile the numerical result of
 $F(x)$ in figure 5
 $(b)$ shows that
 $\ln F(x)$ is linear to
 $x$ for
 $x \gnsim 0$, namely
 \begin{equation} F (x) = \exp(m x +n) \quad \text{for } x \gnsim 0 , \end{equation}
where  $m = -1.251$ and
 $n = 0.108$ are fitted from the numerical results. We then obtain the bottom region static meniscus,
 \begin{equation} f_{s, bot} (z, Bo, \theta_s) \approx \frac{1}{\sqrt Bo} F ( a (\theta_s) ( z+H_{s}) ) \quad \text{for } Bo \lesssim 10^{{-}2} \text{ and }z \lnsim 0 . \end{equation}


In addition to the top and bottom regions, there is the middle region that should satisfy both conditions, namely,  $K_r \approx -K_a \gg K_g$ and
 $\,f_{s}^{\prime 2} \gg 1$. The middle region of the static meniscus therefore can be described as
 \begin{equation} - \frac{1}{f_{s} \,f_{s}^\prime} + \frac{f_{s}^{\prime \prime}} {f_{s}^{\prime 3}} \approx 0 \quad \text{for } Bo \lesssim 10^{{-}2} \text{ and } -H_{s} \lnsim z \lnsim 0 . \end{equation}
The analytical solution can be obtained as
 \begin{equation} f_{s, mid} (z, Bo, \theta_s) \approx \exp( k z + b ) \quad \text{for } Bo \lesssim 10^{{-}2} \text{ and }-H_{s} \lnsim z \lnsim 0 , \end{equation}
where  $k$ and
 $b$ are parameters depending on
 $Bo$ and
 $\theta _s$. Equations (3.3), (3.7) and (3.9) represent the three regions of the static meniscus in the low gravity case, and as shown in figure 4
 $(a)$, the middle region becomes longer with smaller
 $Bo$. To match the different regions, we compare the logarithms of (3.3), (3.7), (3.9), and use (3.6), yielding
 $$\begin{gather} k \approx{-} \frac{1}{\sin \theta_s} \approx m a , \end{gather}$$
 $$\begin{gather}b \approx 2 \ln \sin {\frac{\theta_s}{2}} \approx m a H_{s} + n - \frac{1}{2}\ln Bo , \end{gather}$$
for  $Bo \lesssim 10^{-2}$, where only the second term of (3.3) is used here since the first term is negligible for
 $z \lnsim 0$. Combining (3.10) gives the relationships
 $$\begin{gather} H_{s} (Bo, \theta_s) \approx{-} \frac{1}{2} \sin \theta_s \ln Bo + \sin \theta_s \left( n- 2 \ln \sin {\frac{\theta_s}{2}} \right) , \end{gather}$$
 $$\begin{gather}a(Bo, \theta_s) \approx a(\theta_s) ={-}\frac{1}{m \sin \theta_s} , \end{gather}$$
for  $Bo \lesssim 10^{-2}$. Equation (3.11a) is actually the Derjaguin–James formula, which reveals the linear relationship between
 $H_{s}$ and
 $\ln Bo$ we observed in figure 2
 $(b)$ for
 $Bo \lesssim 10^{-2}$, while (3.11b) gives the explicit expression of the parameter
 $a$ in this low gravity case reproduced in figure 5
 $(a)$. Finally, we derive from (3.11a) the explicit expression for
 $H_{{\rm \pi} /2,s}$,
 \begin{equation} H_{{\rm \pi}/2,s} (Bo) \approx{-}\dfrac{1}{2}\ln Bo+ \ln 2 + n \quad \text{for } Bo \lesssim 10^{{-}2}. \end{equation}
4. Dynamic results
In this section we present the numerical results of the non-stationary one-dimensional model described in § 2. We show in Appendix C and § 5 that inertia has little effect on the breakup height, provided  $Oh\geq 2.86$, making the results independent of
 $Oh$, such as the breakup height can be expressed as
 \begin{equation} H_b (Bo, Ca )=H_{{\rm \pi}/2,s}(Bo)+L_b (Bo, Ca ), \end{equation}
where  $L_b$ is defined as the breakup length. As
 $H_{{\rm \pi} /2,s}$ only depends on
 $Bo$, we consider
 $L_b$ as the main variable to describe the drawing dynamics.
4.1. Basic results
Typical profiles  $f(z,t)$ and axial velocities
 $u(z,t)$ are presented in figure 6, at different lengths
 $L(t)$ during drawing. At
 $L=0$, a static meniscus forms between the liquid bath and the rod, the bottom of which is initially located at
 $z=0$, and set into motion at a constant dimensionless velocity
 $Ca$. As the rod goes up, the ligament extends axially and contracts radially, whereas the bottom profile remains static. In a first stage for
 $L \lesssim 2.3$, the ligament evolves with the following behaviour: the middle part of the profile is generally tangent to the dashed line in figure 6
 $(b)$, and the velocity stays in the range
 $0 \lesssim u \lesssim Ca$ as seen in figure 6
 $(c)$. The dashed line corresponds to (3.9) with
 $\theta _s = {\rm \pi}/2$, namely
 $f_{s, mid}=\exp (-z-\ln 2)$. The instability effect is not clearly observable in the first behaviour, which is thus referred to as the ductility stage. As the rod is drawn higher for
 $L > 2.3$, it enters the capillarity stage, in which the former ductility behaviour fails due to the observable capillary instability. As shown in figure 6
 $(b)$, the middle part of the profile departs from the dashed line and develops into a local symmetric shape around the thinnest position, while the axial velocity forms a bimodal shape with a peak value
 $u > Ca$ and a trough value
 $u < 0$. The ligament length at which the ductility/capillarity transition occurs is defined as the transition length
 $L_t$. We here use the result
 $L_t \approx 2.3$ of the agravic limit obtained in § 4.2 to approximately identify the transition, marked by the squares in figure 6. Finally, when the thinnest radius
 $\,f_{ min} \ll 1$, the process enters the pinch-off stage. As we are concerned with large-viscosity ligaments for
 $Oh \geq 2.86$, the process first enters the viscous regime (Papageorgiou Reference Papageorgiou1995; Eggers Reference Eggers2005) with the well-defined dimensionless relationship
 $\,f_{ min} = 0.0709 (t_b-t)$. The first derivative of
 $\,f_{ min}$ with respect to
 $t$ is shown in figure 7, for a typical Bond number
 $Bo=10^{-2}$ and different velocities in
 $(a)$, and a typical dimensionless velocity
 $Ca=0.1$ and different
 $Bo$ in
 $(b)$. The derivative converges to
 $-0.0709$ when
 $t_b-t \lesssim 0.1$. Hence, the drawing length
 $L_p$ within the pinch-off stage of duration
 $t_b-t$ verifies
 \begin{equation} L_{p} \lesssim 0.1 Ca \ll 0.1 L_b , \end{equation}
since  $Ca \ll L_b$ as observed below in figure 8
 $(a)$. As the ligament continues contracting, it will later enter the final viscous-inertial regime (Eggers Reference Eggers1993, Reference Eggers2005). Now, we do not elaborate more on the pinch-off stage as the additional length (4.2) indicates it has a negligible contribution to the breakup length. The pinch-off stage is here used as the stop criterion for the simulation, i.e. when the minimum radius reaches
 $10^{-5}$, which ensures a numerical accuracy of three decimals for
 $L_b$.
Dimensionless profiles  $f(z,t)$ in
 $(a)$ linear and
 $(b)$ log scales, axial velocities
 $u(z,t)$ in
 $(c)$ at different drawing lengths
 $L(t)=Ca \, t$ during the drawing for
 $Bo=10^{-2}$ and
 $Ca=0.3$. The bath is located at
 $-H_{ {\rm \pi}/2,s}=-3.111$, as shown as a dotted line in
 $(a)$. The ligament breakup, defined as the instant when the minimum dimensionless profile radius reaches
 $10^{-5}$, occurs at
 $L_b=3.065$ (presented in the inset of
 $b$). The inset in
 $(a)$ shows the dynamic meniscus angle
 $\theta$ varying with
 $L(t)$, with the minimum value
 $\theta _{ min}$ marked by a circle. The squares indicate the ligament length
 $L_t \approx 2.3$ when the ductility/capillarity transition occurs. The dashed line in
 $(b)$ represents the line of the middle region static meniscus in the agravic limit, the dash–dotted line in
 $(c)$ represents
 $u=Ca$.

First derivative of  $\,f_{ min}$ with respect to
 $t$, converges to
 $-0.0709$ when it enters the viscous pinch-off regime.
 $(a)\ $ Bound number
 $Bo=10^{-2}$ with different Ca,
 $(b)$ the dimensionless drawing velocity
 $Ca=0.1$ with different
 $Bo$.

 $(a)$ Breakup lengths
 $L_b (Bo,Ca)$ vs
 $Ca$ for different values of
 $Bo$ in solid lines, the static limit
 $L_{b,s} (Bo)$ in dotted lines, the agravic limit
 $L_{b,a} (Ca)$ as a dashed line. The inset shows
 $L_b$ vs
 $Bo$ for
 $Ca=1$.
 $(b)$ Breakup heights
 $H_b (Bo,Ca)$ vs
 $Ca$ for different values of
 $Bo$ in solid lines, the maximum static meniscus height
 $H_{b,s} (Bo)$ in dash–dotted lines.

We also present the development of the dynamic meniscus angle  $\theta$ in the inset of figure 6
 $(a)$, showing that
 $\theta$ first decreases then increases with
 $L$, and the minimum dynamic meniscus angle
 $\theta _{ min}=41.4^\circ$ occurs at
 $L= 1.20$. This result validates the hypothesis that the liquid ligament remains pinned at the edge of the rod bottom, provided the receding contact angle of the liquid on the rod bottom is smaller that
 $\theta _{ min}$, which is the case in the experiments presented in § 5.
Breakup lengths  $L_b$ varying with
 $Ca$ for typical values of
 $Bo$ are presented in figure 8
 $(a)$, compared with the static limit
 $L_{b,s}$ and the agravic limit
 $L_{b,a}$, the corresponding regimes are shown in figure 9. The static breakup length is defined as
 $L_{b,s}(Bo) = H_{b,s}(Bo) - H_{{\rm \pi} /2,s} (Bo)$. The agravic limit
 $L_{b,a}(Ca)$ is obtained numerically by omitting the gravity term in the dimensionless momentum equation (2.6) and starting with the agravic static meniscus (3.3). As one can expect intuitively, the breakup length increases with the drawing velocity. For very slow drawing, i.e.
 $Ca \rightarrow 0$,
 $L_b$ tends to
 $L_{b,s}$ such as the drawing of ligaments can be regarded as a quasi-static process. As shown in figure 8
 $(a)$,
 $L_b$ converges to
 $L_{b,a}$ for
 $Bo \lesssim 10^{-2}$ (see the inset) and
 $Ca \gtrsim Bo$, indicating that gravity has a negligible influence on the drawing dynamics, since
 $Bo \lesssim 10^{-2}$ ensures that the initial meniscus approximates the agravic static meniscus, while
 $Ca \gtrsim Bo$ ensures the extensional viscous forces to dominate the gravitational drainage (Champougny et al. Reference Champougny, Rio, Restagno and Scheid2017). These cases with low gravity and not slow drawing velocities are defined as the agravic drawing (see figure 9), whose results are thus identical to the agravic limit
 $L_{b,a}$,
 \begin{equation} L_b (Bo, Ca) \approx L_{b,a} (Ca) \quad \text{for } Bo \lesssim 10^{{-}2} \text{ and } Ca \gtrsim Bo . \end{equation}
Note that, for convenience,  $L_{b,a}$ can be fitted by
 $4.661Ca^{0.609}+1.072Ca^{0.157}$ (without physical background). Breakup heights
 $H_b$ are shown in figure 8
 $(b)$, which generally increases with the same law for the dimensionless drawing velocity
 $Ca$, and generally decreases linearly with
 $\ln Bo$. For the agravic drawing regime, substituting (3.12) and (4.3) into (4.1) yields
 \begin{equation} H_{b} (Bo, Ca) \approx H_{{\rm \pi}/2,s}(Bo) + L_{b,a}(Ca) \quad \text{for } Bo \lesssim 10^{{-}2} \text{ and } Ca \gtrsim Bo. \end{equation}
Regimes of ligaments drawn out of a pure-liquid bath in our parameter space, the static limit for  $Ca \rightarrow 0$, the agravic limit for
 $Bo \rightarrow 0$, the low gravity case for
 $Bo \lesssim 10^{-2}$ and the agravic drawing for
 $Bo \lesssim 10^{-2}$ and
 $Ca \gtrsim Bo$.

4.2. Transient drawing dynamics
It is a fact that the breakup length (height) does result from the interaction of ductility and capillarity (Ide & White Reference Ide and White1976). However, the transient dynamics of ligaments drawing have rarely been studied. As presented in figure 8 and (4.3), the agravic drawing cases represent the main feature of the drawing dynamics, it is therefore reasonable to focus on the agravic limit  $L_{b,a}$ (with no gravity) to unravel its mechanism. To describe the development of the ligament quantitatively, we define the contraction and the contraction velocity as
 $$\begin{gather} \eta (Ca, L(t)) = 1 - \,f_{ min} (Ca, L(t)) , \end{gather}$$
 $$\begin{gather}\xi (Ca, L(t)) = \frac{\partial \eta}{\partial t} = Ca \frac{\partial \eta}{\partial L} . \end{gather}$$
Contractions  $\eta$ for different
 $Ca$ are presented in figure 10
 $(a)$, starting at 0 and breaking at 1. Note that the squares in figure 10 are the transition lengths
 $L_t (Ca)$ which are later obtained by (4.10). For
 $Ca \lesssim 10^{-2}$,
 $\eta$ first increases slowly with
 $L$ in the ductility stage (
 $L \lesssim L_t$) and then suddenly increases more rapidly (
 $L > L_t$) in the capillarity stage. This transition corresponds to the failure of the ductility behaviour (see figure 6
 $b{,}c$), whereas it is less clear for
 $Ca > 10^{-2}$. The corresponding contraction velocities
 $\xi$ are shown in figure 10
 $(b)$, with
 $\xi = 0.0709$ when it enters the pinch-off stage, as shown in the inset of figure 10
 $(b)$ and discussed in § 4.1. Transitions in the slope of
 $\xi$ can also be clearly observed when
 $Ca \lesssim 10^{-2}$.
Results of the agravic limit ( $Bo = 0$) with different dimensionless drawing velocity
 $Ca$. Dimensionless contractions in
 $(a)$, numerical results
 $\eta$ in solid lines and the ductility solution
 $\eta _{d}$ is a dashed line. Dimensionless contraction velocities in
 $(b)$, numerical results
 $\xi$ in solid lines (final values in the inset), the ductility-induced
 $\xi _d$ in dashed lines and the capillarity-induced
 $\xi _c$ is a dash–dotted line. The squares represent the transition lengths
 $L_t$ (obtained by solving
 $\xi _d=\xi _c$, i.e. the lengths corresponding to the intersections of the dashed lines and the dash–dotted line), separating the whole process into a ductility stage (
 $0 < L \lesssim L_t$) and a capillarity stage (
 $L_t < L < L_b$).

4.2.1. Determining the transition length
Obviously, determining the transition length  $L_t$ is the principal step of unravelling the transient drawing dynamics. We assume the capillary instability to be determined by the transient profile, which corresponds to the ductility profile in the ductility stage (see figure 6
 $b$). Notice the ductility behaviour could be observed in all cases, indicating that they could be approximately described in an identical spatial function
 $f_d(z,L)$ for all
 $Ca$, which can help us to obtain the ductility-induced and capillarity-induced contraction velocities independently. We therefore first seek the approximate ductility solution and then determine the ductility/capillarity transition by comparing the respective contraction velocities.
For the agravic limit, the initial profile can be derived by substituting  $\theta _s={\rm \pi} /2$ into the agravic static meniscus (3.3), yielding
 \begin{equation} f (z,0) = \tfrac{1}{2} \left( e^z +e^{{-}z} \right) , \end{equation}
which is a catenoid. As presented in figure 6 $(b)$, the bottom profile remains quasi-static during the whole process. We thus assume the approximate ductility solution in the form
 \begin{equation} f_{d} (z,t) = \tfrac{1}{2} \left( E(t) e^z +e^{{-}z} \right) , \end{equation}
where  $E(t)$ is a new function depending on
 $t$. Substituting (4.7) into the boundary condition (2.17a) at the rod bottom, we obtain the approximate ductility solution, written in the spatial form
 \begin{equation} f_{d} (z,L) = \frac{1}{2} \left( \frac{ 2 e^L -1}{e^{2L}} e^z +e^{{-}z} \right) . \end{equation}
Notice  $f_d(z,L)$ is referred hereafter to as the ductility solution. The corresponding contraction and contraction velocity could be derived by minimizing (4.8) and substituting the result into (4.5), which gives
 $$\begin{gather} \eta_{d} (L) = 1 - \frac{\sqrt {2 e^L -1}}{e^L} , \end{gather}$$
 $$\begin{gather}\xi_{d} (L, Ca) = Ca \left( \frac{\sqrt{2 e^L -1}}{e^L} - \frac{1}{\sqrt{2 e^L -1}} \right) . \end{gather}$$
As shown in figure 10 $(a)$,
 $\eta _{d}$ is a spatial function identical for all
 $Ca$, while figure 10
 $(b)$ shows that
 $\xi _{d}$ is a family of curves proportional to
 $Ca$. They fit well the numerical results in the ductility stage for
 $Ca \lesssim 10^{-3}$, and approach the tendency for
 $Ca >10^{-3}$.
After the ligament is drawn for a while in the ductility stage, the profile can be approximately described by  $f_d(z,L)$, which is then used to infer the capillarity-induced contraction. We consider the process starting from
 $\,f_{d}(z,L)$ with zero drawing speed, and use the numerical method described in § 2 to solve the nonlinear transient problem with modified initial and boundary conditions, obtaining the capillarity-induced contraction velocity
 $\xi _c (L)$, as detailed in Appendix E. Results are presented in figure 10
 $(b)$ as a dash–dotted line, showing that
 $\xi _{c}$ increases rapidly with
 $L$.
With contraction velocities  $\xi _{d}$ and
 $\xi _{c}$, the transition length
 $L_t(Ca)$ can be obtained by solving
 \begin{equation} \xi_{d} (Ca, L_t) = \xi_{c} (L_t) , \end{equation}
i.e. the intersections of the dashed lines and the dash–dotted line shown in figure 10 $(b)$. In figure 10
 $(a{,}b)$,
 $L_t$ for typical values of
 $Ca$ are marked by squares on the one-dimensional solutions in solid lines. They fit the numerical ductility/capillarity transition regions quite well, indicating that the transition indeed results from the competition of contraction velocities induced by ductility and capillarity.
4.2.2. Capillary instability for the stretched ligaments
We show in the following that the transient drawing dynamics can be further explained by the transient development of the growth rate. Defining  $\sigma (L)$ as the estimate of the transient growth rate for each ductility profile
 $f_d(z,L)$, yielding
 $\sigma (L) = \xi _c (L)/ \eta _d (L)$. We show
 $\sigma (L)$ in figure 11
 $(a)$, compared with the analytical solution
 $\sigma _{cy}$ of a viscous cylindrical ligament whose dimensionless radius is unity. We observe that
 $\sigma \rightarrow 0$ when
 $L \rightarrow 0$, which agrees with the neutrally stable property of the initial static meniscus. As
 $L$ increases,
 $\sigma$ increases while the profile becomes thinner and longer, and
 $\sigma$ gradually tends to the same magnitude as
 $\sigma _{cy}$ for
 $L \gtrsim 1$. To understand the underlying mechanism, we display the characteristic curvatures of
 $f_d (z,L)$ at the
 $\,f_{ min}$ position, namely
 $K_{c,r}$ for the radial curvature,
 $-K_{c,a}$ for the axial curvature and
 $K_c$ for the mean curvature, as shown in figure 11
 $(b)$. The radial curvature destabilizes the ligaments: for
 $L\lesssim 1$,
 $K_{c,r} \approx -K_{c,a}$, leading to very small
 $K_c$ and
 $\sigma$; for
 $L > 1$,
 $K_{c,r}$ dominates the mean curvature
 $K_c$, leading to
 $\sigma$ close to
 $\sigma _{cy}$. Related findings can be found in Rubio-Rubio et al. (Reference Rubio-Rubio, Sevilla and Gordillo2013), Gordillo, Sevilla & Campo-Cortés (Reference Gordillo, Sevilla and Campo-Cortés2014) and Martínez-Calvo et al. (Reference Martínez-Calvo, Rubio-Rubio and Sevilla2018), where the authors pointed out the essential stabilizing role played by the axial curvature. In particular, Martínez-Calvo et al. (Reference Martínez-Calvo, Rubio-Rubio and Sevilla2018) found that the growth rate tends to a very small value when the ligament profile tends to a neutral meniscus, while it tends to a finite value when the ligament is quite long, which is similar to our results in figure 11
 $(a)$.
 $(a)\ $Estimate of the transient growth rate
 $\sigma (L)$ for different profiles
 $f_d(z,L)$, compared with the analytical maximum growth rate
 $\sigma _{cy}$ of a viscous cylindrical ligament (of unit dimensionless radius).
 $(b)$ Characteristic values of the radial curvature (
 $K_{c,r}$), of the axial curvature (
 $-K_{c,a}$), and of the mean curvature (
 $K_c$), for
 $f_d(z,L)$ at the
 $f_{ min}$ position.

5. Experiments
In the following we show the experimental results of ligaments drawn out of a pure-liquid bath in order to test our numerical results presented in § 4. In particular, we investigate the independence of viscosities, and the influences of the drawing velocity and the rod radius.
5.1. Experimental set-up
Ligaments are drawn out of a pure-liquid bath by a steel cylindrical rod of radius  $R = 75$, 250 or
 $750\ \mathrm {\mu }\textrm {m}$. As sketched in figure 12
 $(a)$, the rod is attached on a vertical translation plate, which can be lifted at a constant velocity
 $0.01\ \text {mm}\,\text {s}^{-1} \leq U \leq 10\ \text {mm}\,\text {s}^{-1}$ by a motorised screw stage. The acceleration distance is tested to be less than
 $3 \ \mathrm {\mu }\textrm {m}$ even for the highest velocity of
 $10\ \text {mm}\,\text {s}^{-1}$, which is negligible compared with the rod radius. A liquid container with diameter
 $120\ \text {mm}$ and depth
 $40 \ \text {mm}$ is put on a fixed platform. We use silicone oil to form the ligaments, which can be considered as a model Newtonian pure liquid. Table 1 shows the physicochemical parameters of the different silicone oils used in the experiments, the viscosities and surface tensions are respectively measured with a viscosimeter (NDJ-5S, LICHEN) and a tensiometer (MC-1021, MINCEE) at the temperature
 $25\,^{\circ }\textrm {C}$. The results of ligament drawing are recorded by a high-speed camera (Phantom V2512, USA) fitted with a Nikkro 100 mm microlens at frame rates ranging from 2000 to 5000 frames per second and resolution of
 $3 - 13 \ \mathrm {\mu }\textrm {m}$ per pixel, with flickerless backlighting produced by a high-intensity LED lamp.
 $(a)$ Sketch of the experimental set-up.
 $(b - d)$ Sketches (top) and experimental pictures (bottom, for
 $R= 750\ \mathrm {\mu }\textrm {m}$,
 $Ca=0.108$) of the critical states with respectively the dimensional height
 $H^*=0$,
 $H_{{\rm \pi} /2,s}^*$ and
 $H_{b, exp}^*$. The dotted lines (top) and the bottom edges (bottom) represent the flat surface of the bath.

Main physicochemical parameters of the silicone oils used in the experiments, all parameters are given at  $25\,^{\circ }\textrm {C}$.

We use symbols with the superscript  $()^*$ to represent the dimensional experimental variables. The rod is initially just attached to the flat surface of the bath, namely at the dimensional height
 $H^*=0$, as shown in figure 12
 $(b)$. The liquid climbs up along the outside of the rod and forms an outside static meniscus (James Reference James1974), which is different from the static meniscus we considered in the present paper, namely the meniscus attached to the edge of the rod bottom. The experiments are operated in the following three steps: (i) lift the rod up from
 $H^*=0$ slowly at a constant velocity
 $U = 0.01\ \text {mm}\,\text {s}^{-1}$, until it reaches a dimensional height
 $H_{{\rm \pi} /2,s}^*$ (see figure 12
 $(c)$,
 $H_{{\rm \pi} /2,s}^*$ is defined as
 $H_{{\rm \pi} / 2,s} R$, inferred from the static solution); (ii) stop the rod at the position for 20 s; (iii) lift the rod up at a prescribed constant velocity
 $0.01\ \text {mm}\,\text {s}^{-1} \leq U \leq 10\ \text {mm}\,\text {s}^{-1}$, the ligament breaks at a dimensional height
 $H_{b, exp}^*$ (see figure 12
 $d$). During step (i), the outside meniscus gradually retreats from the rod side and transforms into the static meniscus considered in this paper as the initial condition. By doing this, we obtain a perfectly wetting rod with a very small receding contact angle (ideally zero), meaning that the dewetting phenomenon will not occur in our experiments, which is also validated in the experimental results. In order to ensure that the meniscus we start with in step (iii) is the static one, we stop the rod in step (ii) for a duration much larger than the typical time scale
 $\mu R / \gamma$, which is at most
 $2.04\ \text {s}$ for the largest rod (
 $R= 750\ \mathrm {\mu }\textrm {m}$) and the most viscous oil (
 $V60000$). Step (iii) corresponds to the ligament drawing considered in the present paper. The dimensional breakup heights
 $H_{b, exp}^{*}$ are identified from the final breakup images, the corresponding dimensionless breakup heights
 $H_{b, exp}$ are obtained by
 $H_{b, exp}=H_{b, exp}^{*}/R$. The experimental errors are
 $\lesssim 0.5\,\%$ for the breakup height,
 $2\,\%$ for the viscosity and
 $0.05\,\%$ for the surface tension.
5.2. Experimental results
We first investigate the influence of the drawing velocity, using the silicone oils of various viscosities shown in table 1 and the same rod of radius  $R= 750\ \mathrm {\mu }\textrm {m}$ (
 $Bo=2.5\times 10^{-1}$). The dimensionless results
 $H_{b, exp}$ are shown in figure 13
 $(a)$, compared with the one-dimensional prediction
 $H_b$. Data points are obtained with viscosities varying over two orders of magnitude and drawing velocities varying over three orders of magnitude. Each point is the average value over three measurements, with the standard deviation being smaller than the size of the symbols. As shown in figure 13
 $(a)$,
 $H_{b, exp}$ for all three oils collapse onto a single master curve when plotted vs
 $Ca$, indicating that inertia has little effect on the drawing dynamics (see also Appendix C). This was also the case for films (Champougny et al. Reference Champougny, Rio, Restagno and Scheid2017), but with a different destabilizing mechanism taking its origin in van der Waals forces while ligaments are destabilized by capillary forces. Data for
 $V60000$ lie slightly above those of
 $V500$ and
 $V5000$, which should be attributed to the coating effect during step (i) in experiments (see § 6.2). The experimental results
 $H_{b, exp}$ agree well with the one-dimensional predictions
 $H_b$, while small deviations could be observed:
 $H_{b, exp}$ are lower than
 $H_b$ for
 $Ca \lesssim 0.2$, while higher for
 $Ca > 0.2$.
 $(a)$ The dimensionless breakup heights
 $H_{b, exp}$ in symbols for three different silicone oils, using the same rod of radius
 $R = 750\ \mathrm {\mu }\textrm {m}$ (
 $Bo=2.5\times 10^{-1}$), compared with the corresponding one-dimensional predictions
 $H_b$ shown as a solid line.
 $(b)$ The dimensionless breakup heights
 $H_{b, exp}$ in symbols for
 $V5000$ silicone oil, using rods of radii
 $R=75\ \mathrm {\mu }\textrm {m}$ (
 $Bo=2.5\times 10^{-3}$),
 $250\ \mathrm {\mu }\textrm {m}$ (
 $Bo=2.8\times 10^{-2}$) and
 $750 \ \mathrm {\mu }\textrm {m}$ (
 $Bo=2.5\times 10^{-1}$), compared with the corresponding one-dimensional predictions
 $H_b$ in solid lines.

The influences of the rod radius are then investigated, using the  $V5000$ silicone oil, and rods of different radii
 $R= 75\ \mathrm {\mu }\textrm {m}$ (
 $Bo=2.5\times 10^{-3}$),
 $250\ \mathrm {\mu }\textrm {m}$ (
 $Bo=2.8\times 10^{-2}$) and
 $750 \ \mathrm {\mu }\textrm {m}$ (
 $Bo=2.5\times 10^{-1}$). Results are presented in figure 13
 $(b)$, each point is again repeated three times. For all three rods,
 $H_{b, exp}$ agree well with the corresponding
 $H_b$, showing small deviations similar to those observed in figure 13
 $(a)$. We will show in § 6 that, except for the slight elevation of the
 $V60000$ silicone oil, the deviations between
 $H_{b, exp}$ and
 $H_b$ are mainly due to two-dimensional effects but not the coating effect.
6. Comparison with the two-dimensional model
In this section we first introduce a two-dimensional model, then compare its results with the one-dimensional results presented in § 4 and the experimental results presented in § 5, next rationalize the deviations.
6.1. Two-dimensional model
The flow in the liquid ligament and inside the bath can be modelled with the dimensionless mass conservation and the dimensionless momentum equations
 $$\begin{gather} \boldsymbol{\nabla} \boldsymbol{\cdot} \boldsymbol{v} = 0, \end{gather}$$
 $$\begin{gather}\frac{1}{Oh^2} \left(\partial_t \boldsymbol{v} + \boldsymbol{v} \boldsymbol{\cdot} \boldsymbol{\nabla} \boldsymbol{v} \right)= \boldsymbol{\nabla} \boldsymbol{\cdot} \textsf{$\mathbf{\tau}$} - Bo \boldsymbol{e}_z, \quad \text{at}\ \mathcal{V} , \end{gather}$$
where  $\textsf{$\mathbf{\tau}$} =-p \boldsymbol{\mathsf{I}} + \boldsymbol {\nabla } \boldsymbol {v} + (\boldsymbol {\nabla } \boldsymbol {v})^T$ is the stress tensor,
 $\boldsymbol {v}$ is the velocity and
 $p$ is the pressure. These equations hold at any position,
 $\boldsymbol {x}$, of the deformable axisymmetric domain
 $\mathcal {V}(t)$ occupied by the liquid. To deal with the deformable domain, the ALE method is used, as in Martínez-Calvo et al. (Reference Martínez-Calvo, Rivero-Rodríguez, Scheid and Sevilla2020), and Rivero-Rodriguez, Perez-Saborid & Scheid (Reference Rivero-Rodriguez, Perez-Saborid and Scheid2021). In this method, any point
 $\boldsymbol {X}$ of a reference domain
 $\mathcal {V}_{ ref}$ is transformed into a point in the actual domain, such that
 $\boldsymbol {x}=\boldsymbol {x}(\boldsymbol {X},t) \in \mathcal {V}$. We choose the mapping
 $\boldsymbol {q} = \boldsymbol {x}-\boldsymbol {X}$ to fulfil
 \begin{equation} \nabla^2 \boldsymbol{q} = 0 \quad\text{at}\ \mathcal{V}, \end{equation}
for which boundary conditions must be imposed. The boundary of  $\mathcal {V}$ consists of the truncation boundary of the infinite bath,
 $\varSigma _{\infty }$, the interphase between the rod and the liquid,
 $\varSigma _{ rod}$, and the free surface,
 $\varSigma$. The truncation boundary is sufficiently far to avoid influence on the dynamics. The truncation boundary is fixed whereas we use a Lagrangian description for the displacement of the rod and an Eulerian description for the velocity of the free surface,
 $$\begin{gather} \boldsymbol{q} = \boldsymbol{0} \quad\text{at}\ \varSigma_{\infty} , \end{gather}$$
 $$\begin{gather}\boldsymbol{q} = Ca \, t \boldsymbol{e}_z \quad\text{at}\ \varSigma_{ rod} , \end{gather}$$
 $$\begin{gather}\partial_t \boldsymbol{q} = v_n \boldsymbol{n} \quad\text{at}\ \varSigma , \end{gather}$$
where  $v_n=\boldsymbol {v} \boldsymbol {\cdot } \boldsymbol {n}$ is the normal component of the velocity. The quality of the mesh is ensured by remeshing when the distortion exceeds a certain value and the independence of the results with respect to the mesh and remeshing criteria has been checked.
Initially, the system is started from rest,
 \begin{equation} p={-}Bo (z+H_s) , \quad \boldsymbol{v} = \boldsymbol{0} , \quad\text{at}\ \mathcal{V}_{ ref} , \end{equation}
where  $z=-H_s$ is the reference in the
 $z$ coordinate of the bath level,
 $z=0$ is the initial position of the rod, and the domain occupied by the liquid at static equilibrium is set to the reference one. Thus, at the initial time, the identity mapping holds,
 $\boldsymbol {x}(\boldsymbol {X},0)=\boldsymbol {X}$. Hydrostatic pressure is imposed at the truncation boundary, the liquid follows the movement of the rod and surface tension is considered at the free surface,
 $$\begin{gather} \textsf{$\mathbf{\tau}$} \boldsymbol{\cdot} \boldsymbol{n} = Bo (z+H_s) \boldsymbol{n} \quad\text{at}\ \varSigma_\infty , \end{gather}$$
 $$\begin{gather}\boldsymbol{v} = Ca \, \boldsymbol{e}_z \quad\text{at}\ \varSigma_{ rod} , \end{gather}$$
 $$\begin{gather}\textsf{$\mathbf{\tau}$} \boldsymbol{\cdot} \boldsymbol{n} ={-} \boldsymbol{n} \boldsymbol{\nabla}_s \boldsymbol{\cdot} \boldsymbol{n} \quad\text{at}\ \varSigma . \end{gather}$$
The system of (6.1)–(6.5) has been solved in COMSOL 5.4, coupled with the moving mesh and weak form PDE modules. Linear Lagrangian interpolants are used for the pressure and quadratic ones for the velocity and geometry.
6.2. Deviations: the two-dimensional effect
In figure 14 $(a)$ we show the one-dimensional breakup height
 $H_b$, the two-dimensional breakup height
 $H_{b, 2D}$ and the experimental breakup height
 $H_{b, exp}$, for the rod of radius
 $R= 250\ \mathrm {\mu }\textrm {m}$ (
 $Bo=2.8\times 10^{-2}$) and the
 $V5000$ silicone oil. The two-dimensional model is stopped at a minimum dimensionless radius 0.005, which is then in the pinch-off stage and, thus, accurate enough for
 $H_{b, 2D}$. The agreement with
 $H_{b, exp}$ is almost perfect, which validates the two-dimensional model. We can thus state that the deviations between
 $H_b$ and
 $H_{b, exp}$ observed in figures 13 and 14
 $(a)$ are mainly due to the two-dimensional effects and not the coating effect as explained hereafter. In experiments, as we lift the rod at a small constant velocity
 $U=0.01\ \text {mm}\,\text {s}^{-1}$ in step (i), a liquid layer is coated on the rod side during the retreat of the outside meniscus, as shown in figure 14
 $(b)$. Following the works of Landau & Levich (Reference Landau and Levich1942) and Champougny et al. (Reference Champougny, Rio, Restagno and Scheid2017), the effective rod radius can be estimated quantitatively as
 $R_{ eff} = (1+1.34Ca^{2/3})R$, namely
 $R_{ eff}=1.024R$ for
 $Ca=2.33\times 10^{-3}$. The dimensionless effective experimental breakup height, defined as
 $H_{b, eff}=H_{b, exp}^*/R_{ eff}$, is presented in figure 14
 $(a)$. Note that
 $H_{b, eff}$ actually corresponds to a new Bond number
 $Bo_{ eff}=1.05Bo$. According to (4.4), the dimensionless breakup heights
 $H_{b, 2D}$ and
 $H_b$ for
 $Bo_{ eff}$ should be quite close to those for
 $Bo$, which are thus not presented in figure 14
 $(a)$. It can be observed that the influence of the coating effect on the breakup height is negligible compared with that of two-dimensional effects, and is thus not the main reason for the deviations between
 $H_b$ and
 $H_{b, exp}$.
 $(a)$ The dimensionless experimental breakup height
 $H_{b, exp}= H_{b, exp}^*/R$ and the dimensionless effective experimental breakup height
 $H_{b, eff}= H_{b, exp}^*/R_{ eff}$, using the rod radius
 $R=250\ \mathrm {\mu }\textrm {m}$ (
 $Bo=2.8\times 10^{-2}$) and the
 $V5000$ silicone oil. The dashed line and the solid line represent respectively the two-dimensional breakup height
 $H_{b, 2D}$ and the one-dimensional breakup height
 $H_b$, both for
 $Bo=2.8\times 10^{-2}$.
 $(b)$ Sketches of the rod boundary, the ideal condition considered in the models (top) and the practical condition coated with oils in the experiments (bottom).

The profile developments of all three methods are presented in figure 15 $(a)$, showing an almost perfect agreement between the two-dimensional and experimental results, and good agreement for the one-dimensional results. The deviations of the one-dimensional model mainly occur at the position close to the bath, where the one-dimensional profiles remain static for
 $z < -1.5$ while the experimental and the two-dimensional profiles actually fall down. To show the underlying mechanism of this bath side deviation, we plot streamlines in figure 15
 $(b)$. The one-dimensional streamlines are obtained by plotting the isocontours of the dimensionless streamfunction
 $\psi$ by integrating
 $u r$ with respect to
 $r$. They coincide well with the two-dimensional ones in the region higher than the minimum radius position, but turns different for the lower region. Here, we find that the liquid drains from the ligament into the quasi-static meniscus (which actually could translate horizontally) in the one-dimensional model, but not as much as in the two-dimensional model that includes the bath volume. We further show in figure 16 that it is reasonable to impose the quasi-static bath boundary conditions (2.18) in the one-dimensional model, as the profile close enough to the bath also remains static in the two-dimensional model (see figure 16a–c). Therefore, the two-dimensional effects are two-fold: (i) a two-dimensional convective effect inside the ligament, leading to a longer ligament by expanding the dynamic region (see figure 16a–c compared with figure 16d–f); (ii) a two-dimensional drainage effect at the bath boundary, decreasing the breakup height by reducing the liquid volume inside the ligament, thus promoting its contraction. In the case of ligaments drawn out of a liquid bath, the two-dimensional drainage effect wins when
 $Ca \lesssim 0.2$, and the two-dimensional convective effect wins when
 $Ca > 0.2$. For ligaments stretched between disks, only the two-dimensional convective effect works since the two-dimensional drainage effect is prevented by the bottom disk; hence, the one-dimensional model always predicts a lower breakup height (Yildirim & Basaran Reference Yildirim and Basaran2001). Despite the two-dimensional effects, the one-dimensional model predicts the drawing process quite well. As shown in figure 16, the ductility stage and the capillarity stage we find using the one-dimensional model are observed similarly in the two-dimensional model, as discriminated by the dashed lines.
 $(a)$ Ligament profiles during the drawing for the rod radius
 $R=250\ \mathrm {\mu }\textrm {m}$ (
 $Bo=2.8\times 10^{-2}$) and the dimensionless drawing velocity
 $Ca=0.342$: experimental pictures with
 $H_{b, exp}=6.126$; two dimensional (2D) on the left in dashed lines, with
 $H_{b, 2D}=5.961$; one dimensional (1D) on the right in solid lines, with
 $H_b=5.817$. The two-dimensional simulation is stopped when
 $\,f_{ min}=0.005$, the one-dimensional simulation is stopped when
 $\,f_{ min}=10^{-5}$.
 $(b)$ Streamlines for the case shown in
 $(a)$, at the length
 $L=1.701$ (top) and the breakup states (bottom), two dimensional on the left and one dimensional on the right. The bath is located at
 $-H_{{\rm \pi} /2,s}=-2.594$, namely the bottom edge of
 $(a)$ and the red dotted lines in
 $(b)$.

Profiles  $f(z,t)$ in log scales for different
 $Bo= 1$,
 $10^{-2}$,
 $10^{-4}$ with the same dimensionless drawing velocity
 $Ca=0.342$ for
 $(a{-}c)$ the two-dimensional model and
 $(d{-}f)$ the one-dimensional model. Dashed lines represent the line of the middle region static meniscus in the agravic limit, generally discriminating the ductility and the capillarity stages. The bath positions for
 $Bo=1$,
 $10^{-2}$,
 $10^{-4}$ are
 $-H_{{\rm \pi} /2,s}=-0.997, -3.111, -5.411$, respectively, shown in dotted lines.

7. Entrained liquid volume
One of the applications is determining the entrained liquid volume attached to the rod after the ligament breakup. The numerical dimensionless entrained volumes are defined as  $V_e$ and
 $V_{e, 2D}$, non-dimensionalised by
 $R^3$, respectively for the one-dimensional and two-dimensional models. Since we consider large-viscosity liquids, we observed experimentally that no satellite occurs after the breakup, the numerical dimensionless entrained volumes are therefore obtained by integrating
 ${\rm \pi} f^2$ from
 $z_p$ to
 $L_b$ for the final breakup profile, where
 $z_p$ represents the pinch-off position. The comparison between
 $V_e$ and
 $V_{e, 2D}$ is shown in figure 17
 $(a)$ for
 $Bo=2.8 \times 10^{-2}$, showing that the one-dimensional model generally predicts the right tendency of entrained volume with the maximum value occurring at
 $Ca \approx 0.2$, even though it systematically underestimates the volume. Volumes
 $V_e$ and
 $V_{e, 2D}$ varying with
 $Bo$ for a typical dimensionless drawing velocity
 $Ca=0.1$ are presented in the inset of figure 17
 $(a)$. The two models predict a same tendency, that is, the entrained volume is reasonably independent of
 $Bo$ for the low gravity case
 $Bo \lesssim 10^{-2}$. The experimental results are also shown in figure 17
 $(a)$ for the corresponding rod of radius
 $R=250\ \mathrm {\mu }\textrm {m}$ and the
 $V5000$ silicone oil, with error bars representing the volume errors of one pixel at the rod that obscures the rod position. Given the dimensional experimental entrained volume
 $V_{e, exp}^*$, we define the dimensionless experimental entrained volume
 $V_{e, exp}=V_{e, exp}^*/R^3$. It can be observed that
 $V_{e, 2D}$ agrees well with
 $V_{e, exp}$, and the deviations should be attributed to the coating effect. A relevant work can be found in Lambert et al. (Reference Lambert, Seigneur, Koelemeijer and Jacot2006), in which the authors measured the entrained liquid volume of a cylindrical microgripper slowly lifted out of a pure-liquid bath, with the maximum Bond number
 $Bo = 2.0 \times 10^{-2}$ quite close to that of
 $R=250\ \mathrm {\mu }\textrm {m}$ in our experiments. With very slow drawing velocities (
 $Ca\sim 10^{-6}$), the dimensionless entrained volume is found to be 1.12. As shown in figure 17
 $(a)$,
 $V_{e, 2D}$ agrees quite well with this value for the slow drawing, even for a slightly different value of
 $Bo$.
Entrained volume  $V_e$,
 $V_{e, 2D}$,
 $V_{e, exp}$ in
 $(a)$ and minimum dynamic meniscus angle
 $\theta _{ min}$,
 $\theta _{ min, 2D}$ in
 $(b)$, varying with
 $Ca$ for the rod of radius
 $R=250\ \mathrm {\mu }\textrm {m}$ (
 $Bo=2.8\times 10^{-2}$). The square in
 $(a)$ represents the value of 1.12 obtained from Lambert et al. (Reference Lambert, Seigneur, Koelemeijer and Jacot2006) for very slow drawing. The insets in
 $(a{,}b)$ show the entrained volume and minimum dynamic meniscus angle varying with
 $Bo$ for
 $Ca=0.1$, respectively.

To understand the variation of the entrained liquid volume, we show the minimum dynamic meniscus angle  $\theta _{ min}$ (one-dimensional, see also the inset of figure 6
 $a$), and
 $\theta _{ min, 2D}$ (two-dimensional) during the drawing in figure 17
 $(b)$. The results show a quite similar development to those of the entrained liquid volume: the one-dimensional model generally underestimates the angle, the maximum value occurs at
 $Ca \approx 0.1$, and both models predict the independence of the Bond number for
 $Bo \lesssim 10^{-2}$. It can be deduced that the drawing influences the profiles close to the rod, which determines the entrained liquid volume: the larger
 $\theta _{ min}$ is, the more liquid volume
 $V_e$ could be entrained. It is worth noting that, as shown in the inset of figure 17
 $(b)$,
 $\theta _{ min}$ can be smaller for larger
 $Bo$ and
 $Ca$, indicating that one needs to keep both the rod radius and the drawing velocity in a certain range to avoid the dewetting phenomenon occurring if the receding contact angle exceeds
 $\theta _{ min}$.
8. Conclusions
In this paper the drawing of large-viscosity liquid ligaments out of a pure-liquid bath have been described by means of a non-stationary one-dimensional model. For very slow drawing, the process can be regarded as a quasi-static deformation of the static meniscus, and the ligament breaks once the meniscus height exceeds the maximum static meniscus height  $H_{b,s}$, beyond which no equilibrium solution exists. We observed a linear relationship between the static meniscus height
 $H_s$ and the logarithm of the Bond number
 $\ln Bo$ when
 $Bo \lesssim 10^{-2}$, then unraveled the underlying mechanism using analytical methods. For faster drawing, the process can be sequenced into a ductility stage, a capillarity stage and a pinch-off stage, among which we showed that the last stage has a negligible effect on the breakup height. We also identified the agravic drawing regime for
 $Bo \lesssim 10^{-2}$ and
 $Ca \gtrsim Bo$ for which gravity plays no role and that can thus be described by solutions found in the agravic limit. Taking the ductility behaviour for reference, a ductility solution
 $f_d(z,L)$ was derived for the arbitrary dimensionless drawing velocity
 $Ca$ in the agravic limit, which agrees with the one-dimensional predictions quite well. Based on this ductility solution, we unraveled the transient drawing dynamics and demonstrated that the breakup height is determined by the competition between contractions sequentially dominated by ductility and capillarity. The further underlying mechanism is found to be the destabilizing role of the radial curvature during the transient development of ligaments. In addition, gravity, when significant, determines the static meniscus and accelerates the contraction due to drainage.
Experiments were performed on ligaments made of silicone oils of different viscosities and rod radii, both varying over two orders of magnitude. For the large-viscosity liquids considered in the present paper, the experimental results confirmed the dominant role of extensional viscous stresses on the drawing dynamics of ligaments, whereas inertia plays an almost insignificant role. The one-dimensional breakup height turned out to be in good agreement with the experimental breakup heights, even though small deviations were observed. Compared with a two-dimensional model, it was found that the deviations were mainly due to two-dimensional effects, namely two-dimensional convection and drainage. Finally, we presented predictions for the entrained liquid volume as a potential application, which was found to be maximum at  $Ca \approx 0.2$.
Funding
This work was supported by the National Natural Science Foundation of China (J.Z. and X.W., grant No. 51875507) and the F.R.S-FNRS (J.R. and B.S., grant PDR-Wolflow).
Declaration of interests
The authors report no conflict of interest.
Appendix A. Choosing the initial configuration
In this appendix we show the results of ligaments drawn from static menisci with different static meniscus angles  $\theta _s \geq {\rm \pi}/2$ using the two-dimensional model described in § 6.1, and give the explanation of choosing
 $\theta _s={\rm \pi} /2$ as the initial configuration. As introduced in § 3.1, static menisci with
 $\theta _s \geq {\rm \pi}/2$ are always stable and can be considered as the initial configuration of the drawing. We define the height when the dynamic meniscus angle reaches
 $\theta (t) ={\rm \pi} /2$ as
 $H_{{\rm \pi} /2, 2D}$, which should tend to the static value
 $H_{{\rm \pi} /2,s}$ when the drawing is slow enough. Typical results for
 $Bo=10^{-4}$ and
 $Ca=0.1$ are shown in figure 18
 $(a)$, starting from
 $H_s$ with different
 $\theta _s$, the ligament height passes through
 $H_{{\rm \pi} /2, 2D}$ and breaks at
 $H_{b, 2D}$ (not shown). As presented in figure 18
 $(a)$,
 $H_{{\rm \pi} /2, 2D}$ decreases from
 $\theta _s={\rm \pi} /2$ to
 ${\rm \pi}$, indicating that the preliminary stage (
 $H(t)< H_{{\rm \pi} /2, 2D}$) can be significantly influenced by the initial configuration. Whereas for the later contraction stage (
 $H(t) \geq H_{{\rm \pi} /2, 2D}$), both
 $H_{b, 2D}-H_{{\rm \pi} /2, 2D}$ in figure 18
 $(a)$ and especially the entrained volume
 $V_{e,2D}$ in figure 18
 $(b)$ show that it is reasonably independent of the initial
 $\theta _s$. Note that the entrained volume is defined in § 7. Meanwhile, as presented in § 6.2, strong two-dimensional effects exist for the ligament close to the bath, which should be avoided in the one-dimensional simulations. We therefore choose the static meniscus with
 $\theta _s={\rm \pi} /2$ as the initial configuration to study the contraction dynamics of ligaments drawn out of a bath, since it corresponds to the only value of
 $\theta$ in the stable region for which
 $H_s$ and
 $H_{{\rm \pi} /2, 2D}$ coincide.
 $(a)$ Two-dimensional results
 $H_{b, 2D}-H_{{\rm \pi} /2, 2D}$,
 $H_{{\rm \pi} /2, 2D}$, the initial static height
 $H_s$ and
 $H_{{\rm \pi} /2,s}$, varying with different initial
 $\theta _s$.
 $(b)$ The entrained volume
 $V_{e, 2D}$ varying with different initial
 $\theta _s$. All cases are for
 $Bo=10^{-4}$ and
 $Ca=0.1$.

Appendix B. Influence of $z_d$ on the ligament breakup height

In this appendix we check for which conditions the breakup height  $H_b$ is reasonably independent of the arbitrary dynamic boundary position
 $z_d$. We choose
 $z_d$ as a function of
 $\partial _z \,f_{s}$, namely
 $z_d$ is the position where a certain
 $\partial _z f_s$ is reached. Results of typical cases are shown in figure 19
 $(a)$, indicating that
 $H_b$ converges when
 $-\partial _z \,f_{s}$ is large enough. We choose
 $z_d = z_d (-100)$ in order to obtain a sufficient accuracy while avoiding too large
 $-\partial _z \,f_{s}$ which brings numerical difficulties. Figure 19
 $(b)$ shows the position of
 $z_d$ as a function of
 $Bo$, as well as the position of the bath
 $-H_{{\rm \pi} /2,s}$. Despite the fact that the difference can be large between both positions, especially for small
 $Bo$, choosing a value of
 $z_d$ smaller than
 $z_d(-100)$ has no influence on
 $H_b$.
 $(a)$ Influence of the boundary position
 $z_d$ on the breakup height
 $H_b$ for
 $Bo=1$,
 $Ca=0.01$, note
 $z_d= z_d (\partial _z f_s)$;
 $(b)$ the boundary position
 $z_d(-100)$ and the bath positions
 $-H_{{\rm \pi} /2,s}$ as functions of
 $Bo$.

Appendix C. Influence of inertia on the ligament breakup height
In this appendix we show inertia has little effect on the breakup height  $H_b$ in our parameter space. Following the analysis in § 2,
 $H_b$ can be written as
 $H_b ( Oh, Bo, Ca )$, where
 $Oh$,
 $Bo$ and
 $Ca$ are three independent parameters. Inertia effects are gauged by
 $1/Oh^2$ (see (2.6)), where
 $Oh= \mu / (Bo^{1/4}\sqrt {\rho \gamma \ell _c })$, meaning that larger Bond numbers lead to larger inertia effects for a certain liquid. We therefore consider
 $Bo = 1$ to analyse the influence of inertia. Figure 20
 $(a)$ shows that inertia has a noticeable influence only when
 $Ca > 0.1$ and
 $Oh < 2.86$. Figure 20
 $(b)$ shows indeed that
 $H_b$ is reasonably independent of large
 $Oh$ for the case
 $Bo=1, Ca=1$. In the present paper we thus consider
 $Oh \geq 2.86$, corresponding to
 $\mu \geq 0.5\ \text {Pa}\,\text {s}$ for silicone oils, for which inertia effects can be safely neglected, provided
 $Bo \le 1$ and
 $Ca \le 1$, hence, the parameter space defined in (2.20).
Influence of inertia on the breakup height for the largest Bond number  $Bo=1$.
 $(a)$ The dimensionless breakup height
 $H_b$ varying with dimensionless drawing velocity
 $Ca$ for different
 $Oh$.
 $(b)$ The dimensionless breakup height
 $H_b$ varying with
 $Oh$ for
 $Ca=1$.

Appendix D. Derivation of the agravic static meniscus
In this appendix we derive the top region static meniscus, namely the agravic static meniscus, for the arbitrary static meniscus angle. The top region system consists of an ordinary differential equation (3.2), a fixed radius condition (2.11c) and a given angle condition
 \begin{equation} f_{s}^\prime (0) = \cot \theta_s, \end{equation}
where  $0 < \theta _s < {\rm \pi}$. The equations in the following are all in the ranges
 $Bo \lesssim 10^{-2}$ and
 $z \gnsim -H_{s}$, which are omitted for the sake of simplicity. Firstly, we write (3.2) in the form
 \begin{equation} \frac{1}{f_s} \frac{1}{ \sqrt{1 + \,f_{s}^{\prime 2} } } + \frac{1}{f_s^{\prime}} \left( \frac{1}{ \sqrt{1 + \,f_{s}^{\prime 2} } } \right)^\prime \approx 0. \end{equation}
Then, integrating (D2) and substituting the boundary conditions (3.2), (D1), yields
 \begin{equation} \frac{ \sqrt{1+f_s^{\prime 2}}}{f_s} \approx \frac{1}{\sin \theta_s}, \end{equation}
i.e.
 \begin{equation} f_s^\prime \approx{\pm} \sqrt{\frac{f_s^2}{\sin^2\theta_s} -1}. \end{equation}
Integrating (D4) and substituting (2.11c) yields
 \begin{equation} (1+\vert \cos \theta_s \vert)\exp \left({\pm} \frac{z}{\sin \theta_s}\right) -f_s \approx \sqrt{f_s^2-\sin^2\theta_s} . \end{equation}
Squaring both sides and arranging the equation, we obtain
 \begin{equation} f_{s, top} (z, \theta_s) \approx \frac{1+\vert \cos \theta_s \vert}{2} \exp \left({\pm} \frac{z}{\sin \theta_s}\right) + \frac{\sin^2 \theta_s}{2} \frac{1}{1+\vert \cos \theta_s \vert} \exp \left({\mp} \frac{z}{\sin \theta_s}\right) . \end{equation}
Finally, (D6) actually corresponds to two solutions, in which only one satisfies the boundary condition (D1), as presented in (3.3).
Appendix E. Capillarity-induced contraction velocity
In this appendix we show how we obtain the capillarity-induced contraction velocity  $\xi _c$ by solving the one-dimensional model described in § 2 with new initial and boundary conditions. To avoid the influence of drawing, we impose the following conditions: the initial conditions and the initial guess for
 $K$,
 \begin{equation} f(z,0) = \,f_{d} (z, L), \quad u(z,0) = 0 , \quad K(z,0) = K_{d} (z, L) , \end{equation}
where  $K_d (z,L)$ is derived from
 $f_d(z,L)$ using (2.7), and the boundary conditions,
 \begin{gather} \partial_z\, f(z_d,t) = \partial_z \,f_{d} (z_d, L),\quad K (z_d,t) = K_{d} (z_d, L), \end{gather}
 \begin{gather} f ( L , t ) = 1 , \quad u ( L, t ) = 0 . \end{gather}
Note that  $L$ is a parameter during the calculation. We here present typical cases for
 $L=0.14$,
 $0.30$ and
 $1.00$. The results show that the ligaments contract and break in finite times
 $t_b$. Transient contraction velocities
 $\xi (L,t)$ vary with time and reach the minimum values at the rescaled time
 $t_{ min}/t_b= 0.28$,
 $0.23$ and
 $0.22$, as shown in figure 21
 $(a)$. It is found that the minimum of
 $\xi$ coincides with the minimum of the mean curvature
 $K$, which indicates that the decrease of
 $\xi$ (or
 $K$) for
 $t < t_{ min}$ are the accommodation process due to the fact that
 $f_d (z,L)$ actually is an approximation of the transient profile, and the increase of
 $\xi$ (or
 $K$) for
 $t>t_{ min}$ can be attributed to the capillary instability. Consequently, we define the capillarity-induced contraction velocity as
 $\xi _{c}(L) = \min \{ \xi (L,t) \}$, as it corresponds to the triggering value of the capillary instability. Results are shown in figure 21
 $(b)$ and plotted in figure 10
 $(b)$.
 $(a)$ The transient contraction velocity
 $\xi$, starting from the base state
 $f_d(z,L)$ for
 $L=0.14$,
 $0.30$,
 $1.00$.
 $(b)$ The capillarity-induced contraction velocity
 $\xi _c$. The symbols represent
 $\xi _c$ for the three
 $L$.



