The Devonian Period (419–359 million years ago) was a crucial time for the development of terrestrial ecosystems, marked by a massive expansion and diversification of terrestrial flora as well as the emergence of vertebrates onto land (Vecoli et al. Reference Vecoli, Meyer-Berthaud and Clement2010; Clack Reference Clack2012). Terrestrialisation is a complex evolutionary process involving modifications not only to the morphology and physiology of the organism but also to its life history; thus, it would be of considerable interest to study the life-history changes across a process such as the fish–tetrapod transition.
The investigation of long-bone histology is among the best methods for revealing physiological, metabolic and developmental features of vertebrates (Castanet et al. Reference Castanet, Francillon-Vieillot, Meunier, De Ricqlès and Hall1993). However, until recently, it required the bones to be physically cut into thin sections – a destructive technique that was not generally considered appropriate for rare fossil material such as Devonian stem tetrapods. The invention of propagation phase-contrast synchrotron radiation microtomography (PPC-SRμCT), which allows long-bone histology to be imaged non-destructively (Sanchez et al. Reference Sanchez, Ahlberg, Trinajstic, Mirone and Tafforeau2012), has opened up exciting new possibilities for extracting life-history data from rare and irreplaceable fossils. So far, it has been used for the life-history investigation of two Devonian members of the tetrapod stem group: the tristichopterid Eusthenopteron foordi from the Escuminac Formation (early Frasnian) of Miguasha, Canada (Sanchez et al. Reference Sanchez, Tafforeau and Ahlberg2014), and the limbed stem tetrapod Acanthostega gunnari from the Britta Dal Formation (late Famennian) of Stensiö Bjerg, East Greenland (Sanchez et al. Reference Sanchez, Tafforeau, Clack and Ahlberg2016).
Miguasha represents a tropical, brackish, estuarine environment, surrounded by forests of Archaeopteris trees (Schultze & Cloutier Reference Schultze and Cloutier1996; Cloutier Reference Cloutier2010). The fossil assemblage contains 20 known vertebrate species (including anaspids, osteostracans, placoderms, acanthodians, actinopterygians and sarcopterygians; Cloutier Reference Cloutier2010), as well as nine known invertebrate species (including conchostracans, eurypterids, polychaete annelids, millipedes and scorpionids; Schultze & Cloutier Reference Schultze and Cloutier1996). A reconstructed five-level trophic chain places Eusthenopteron foordi as the top predator (Cloutier Reference Cloutier2010). Histological studies demonstrated that E. foordi had a long juvenile stage and probably only reached sexual maturity when it was 10–11 years old (Sanchez et al. Reference Sanchez, Tafforeau and Ahlberg2014).
In contrast, the locality on Stensiö Bjerg in Greenland where Acanthostega gunnari was found (Astin et al. Reference Astin, Marshall, Blom and Berry2010) is overwhelmingly dominated by fossils of this stem tetrapod (Blom et al. Reference Blom, Clack, Ahlberg and Friedman2007). The depositional environment was an extensive braided floodplain of ephemeral channels in a dry, tropical, inland basin (Astin et al. Reference Astin, Marshall, Blom and Berry2010; Clack Reference Clack2012); occasional flood events would sweep vertebrates down onto this plain from a permanent water body upstream (see also Ahlberg Reference Ahlberg2019). Tens of individuals of A. gunnari were caught up in one of these flood events and eventually concentrated in a pool in one of the channels, where they died when the water dried up. These individuals were probably juveniles that exhibited a schooling behaviour (Sanchez et al. Reference Sanchez, Tafforeau, Clack and Ahlberg2016). Anatomical (Callier et al. Reference Callier, Clack and Ahlberg2009) and histological studies (Sanchez et al. Reference Sanchez, Tafforeau, Clack and Ahlberg2016) suggest the possibility of sexual dimorphism within this group of young individuals and shows that their limbs ossified late in development. They seem to have been at least six years old, but probably older, when they reached sexual maturity (Sanchez et al. Reference Sanchez, Tafforeau, Clack and Ahlberg2016).
Despite the fact that Miguasha and Stensiö Bjerg appear to represent very different environments, and Eusthenopteron foordi and Acanthostega gunnari belong to different parts of the tetrapod stem group, the two genera share similar life-history traits, such as a relatively slow growth rate, a late ossification of the limbs and a long juvenile stage (Sanchez et al. Reference Sanchez, Tafforeau and Ahlberg2014, Reference Sanchez, Tafforeau, Clack and Ahlberg2016). This suggests the possibility that these could be general characters of the tetrapod stem group, but more data are needed before any broad conclusions can be drawn. For this reason, we decided to investigate the life history traits of one of the largest Devonian sarcopterygians, the top predator tristichopterid Hyneria lindae from the Catskill Formation (late Famennian) of Pennsylvania, USA (Daeschler & Downs Reference Daeschler and Downs2018). The Red Hill locality is in the Duncannon Member of the Catskill Formation. This locality preserves a fossil record deposited in a well-vegetated alluvial plain forming meandering stream channels (Sevon Reference Sevon, Woodrow and Sevon1985; Daeschler & Downs Reference Daeschler and Downs2018) with a palaeoclimate of alternative wet and dry seasons at a palaeolatitude of approximately 30°S of the equator (Woodrow & Sevon Reference Woodrow and Sevon1985). The formation yields a diverse fauna comprising both arthropods (arachnids and myriapods) (Wilson et al. Reference Wilson, Daeschler and Desbiens2005) and a wide range of vertebrates – placoderms (Daeschler et al. Reference Daeschler, Frumes and Mullison2003), acanthodians (Snyder et al. Reference Snyder, Turner, Burrow and Daeschler2017), a chondrichthyan (Downs & Daeschler Reference Downs and Daeschler2001), the small palaeoniscid actinopterygian Limnomis delaneyi (Daeschler Reference Daeschler2000a), the tristichopterid H. lindae (Thomson Reference Thomson1968; Daeschler & Downs Reference Daeschler and Downs2018) and some isolated skeletal elements of limbed stem tetrapods (Daeschler Reference Daeschler2000b; Daeschler et al. Reference Daeschler, Shubin, Thomson and Amaral1994, Reference Daeschler, Clack and Shubin2009). Hyneria lindae, as a top predator, must have played a major role in regulating the food web of this ecosystem (Cressler et al. Reference Cressler, Daeschler, Slingerland and Peterson2010). Unfortunately, only isolated skeletal elements have been found, which do not give a complete picture of its body morphology, although they indicate that it reached up to 3m in length and somewhat resembled the related genera Eusthenodon and Mandageria (Jarvik Reference Jarvik1952; Johanson & Ahlberg Reference Johanson and Ahlberg1997). Thus, it was a much larger animal than either Eusthenopteron foordi or Acanthostega gunnari. We imaged a humerus of H. lindae at sub-micron resolution using PPC-SRμCT to study its bone histology and reveal developmental and physiological features of an individual of this species.
1. Materials and methods
1.1. Materials
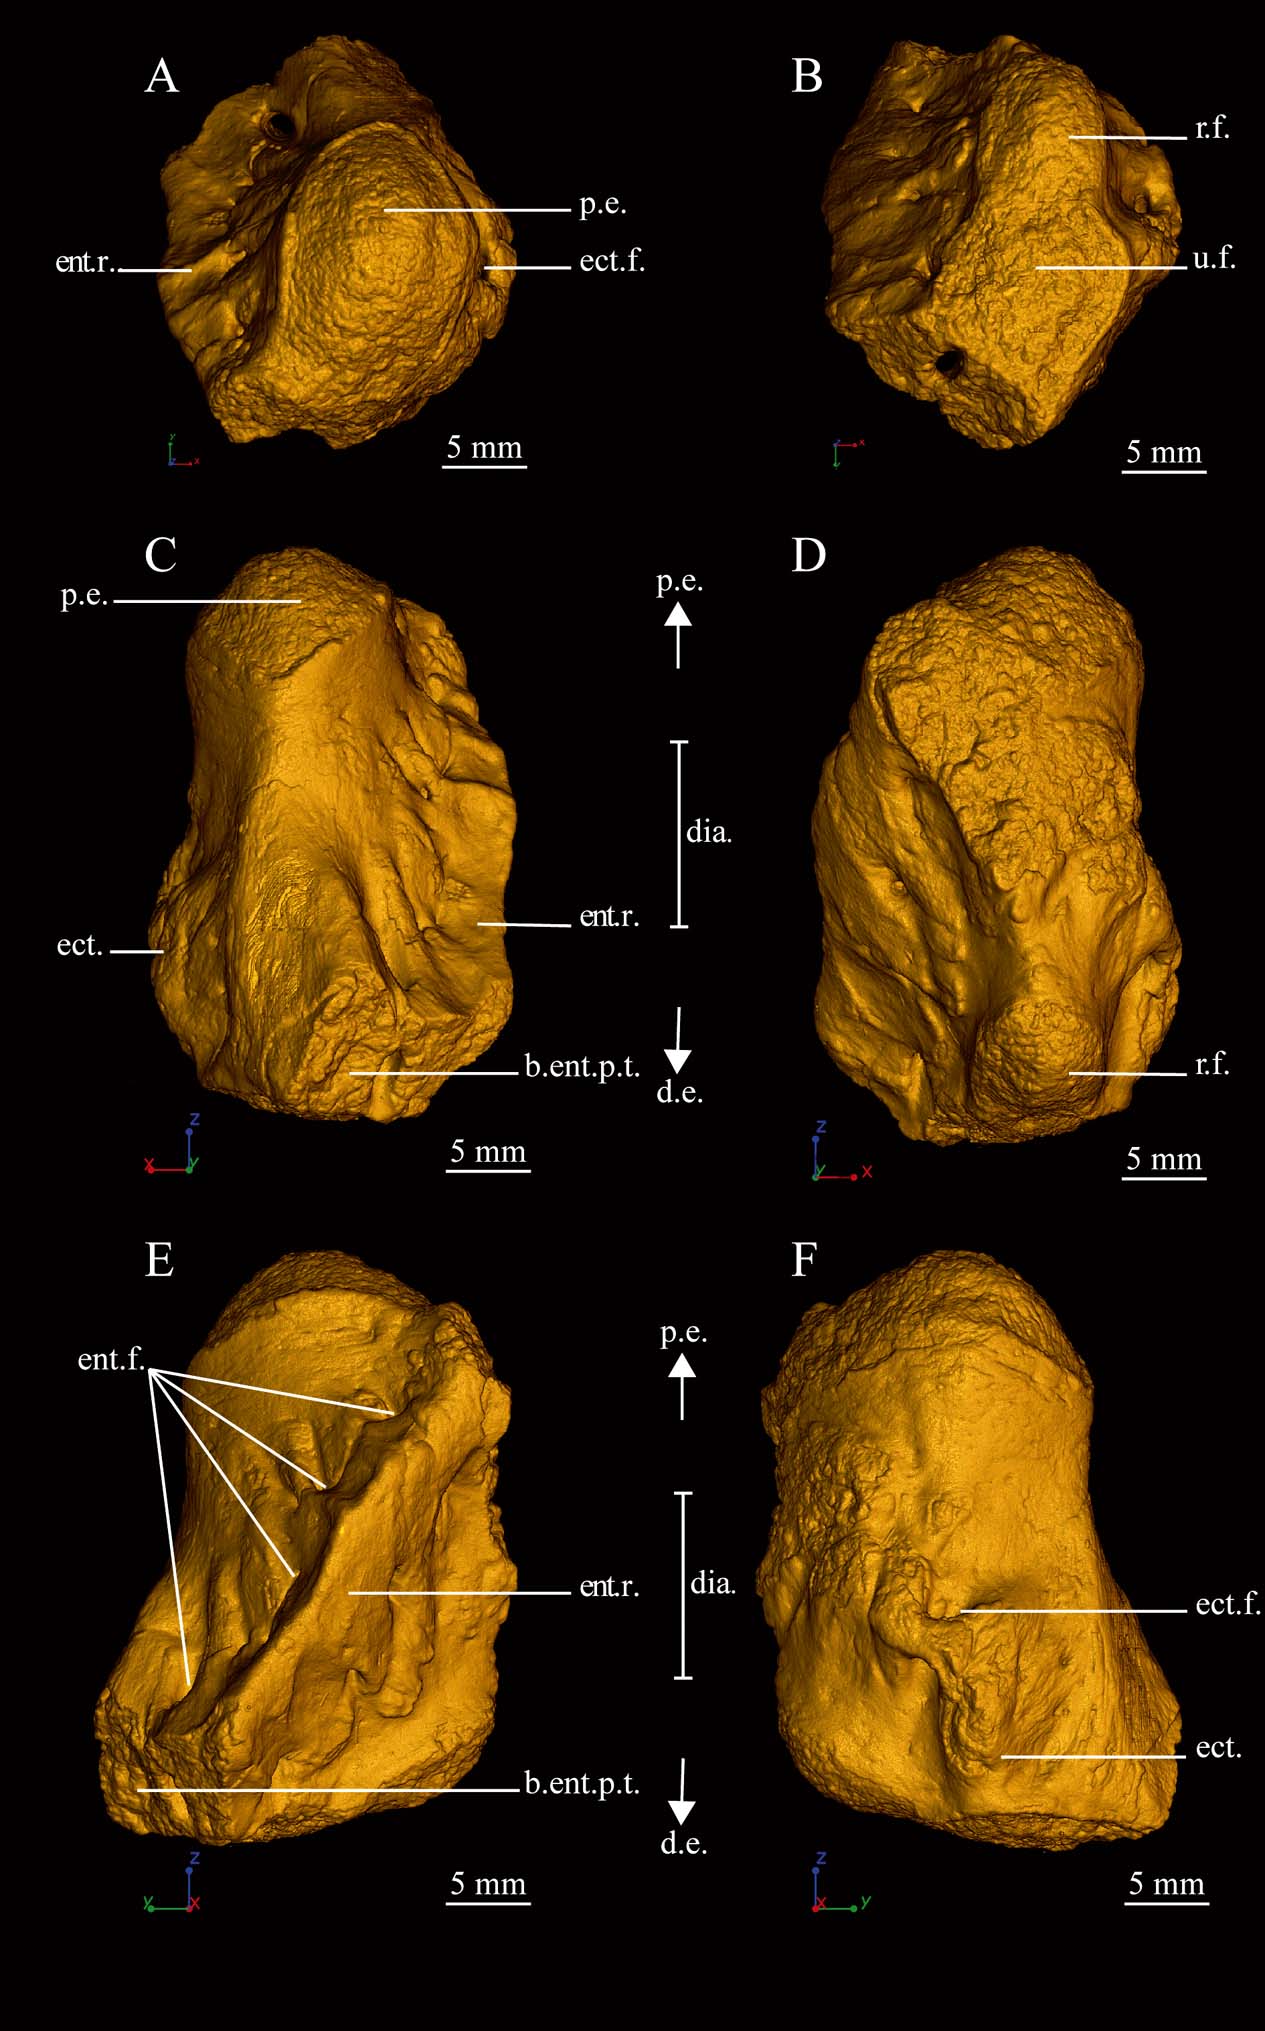
The histological analysis presented here focuses on a single humerus of the tristichopterid sarcopterygian Hyneria lindae, Academy of Natural Sciences of Philadelphia (USA) (ANSP) 21483 (Fig. 1). The studied humerus is a short and cylindrical element of the left pectoral fin. It exhibits a typical oblique entepicondylar ridge on the ventral surface (Fig. 1) that is pierced by a series of foramina, and a dorsal ectepicondyle enclosing the ectepicondylar foramen (Fig. 1). The distal tip of the entepicondyle is not preserved (Fig. 1). The proximal end of the humerus carries a broad, gently convex articulation surface that would have contacted the glenoid of the scapulocoracoid in life; at the distal end of the bone, two confluent articular facets form the contact surfaces for the ulna and radius (Fig. 1). The size of ANSP 21483 relative to other skeletal elements of H. lindae suggests that it belongs to a small-to-medium-sized individual. ANSP 21483 comes from Red Hill, Duncannon Member of the Catskill Formation (Sevon Reference Sevon, Woodrow and Sevon1985; Daeschler & Downs Reference Daeschler and Downs2018), and is housed in the Vertebrate Paleontology collection of the Academy of Natural Sciences of Philadelphia (USA).
Anatomy of the left humerus of Hyneria lindae (ANSP 21483). 3D model of the humerus showing: (A) the proximal epiphysis; (B) the distal epiphyses; (C) the postero-mesial view; (D) the antero-mesial view; (E) the ventral view; (F) the dorsal view. Abbreviations: b.ent.p.t. = broken entepicondyle postaxial tip; d.e. = distal epiphysis; dia. = diaphysis; ect. = ectepicondyle; ect.f. = ectepicondylar foramen; ent.f. = entepicondylar foramina; ent.r. = entepicondylar ridge; p.e. = proximal epiphysis; r.f. = radial facet; u.f. = ulnar facet.

1.2. Methods
The humerus of Hyneria lindae was imaged at beamline ID19 of the European Synchrotron Radiation Facility (ESRF, France) with PPC-SRμCT. It was studied using virtual palaeohistology (Sanchez et al. Reference Sanchez, Ahlberg, Trinajstic, Mirone and Tafforeau2012), with voxel sizes ranging from 14.95μm to submicron resolution (0.678μm) based on a multi-scale approach (Tafforeau et al. Reference Tafforeau, Bentaleb, Jaeger and Martin2007; Sanchez et al. Reference Sanchez, Ahlberg, Trinajstic, Mirone and Tafforeau2012).
1.2.1. Low-resolution scan
The entire humerus of Hyneria lindae (ANSP 21483) was imaged with a voxel size of 14.95μm, using a FReLoN 2k14 charge coupled device (CCD) detector (Labiche et al. Reference Labiche, Mathon, Pascarelli, Newton, Guilera Ferre, Curfs, Vaughan, Homs and Fernandez Carreiras2007) coupled with a 10-μm-thick Gadox scintillator. The experiment was performed with a monochromatic beam, using a double Si111 Bragg monochromator at 60keV. The beam was filtered with 2mm of aluminium and 1mm of silicon. The gap of the wiggler (W150m) was open to 30mm. The distance of propagation was fixed to 900mm. The time of exposure was 0.3s. Three thousand projections were taken over 360°.
1.2.2. Medium-resolution scan
The mid-shaft of the fossil sample was imaged with a final voxel size of 10.06μm in order to reveal the lines of arrested growth (LAGs) in the cortical bone. The experiment was actually performed with an optical system (a FReLoN 2K14 detector (Labiche et al. Reference Labiche, Mathon, Pascarelli, Newton, Guilera Ferre, Curfs, Vaughan, Homs and Fernandez Carreiras2007) associated to a 5-μm-thick Gadox scintillator) providing a voxel size of 5.03μm. As the experiment was performed in a binning mode, the resulting voxel size was 10.06μm. The fossil was imaged with a monochromatic beam at an energy of 60keV (beam filtered with 2.8mm of aluminium and the gap of the U32u undulator opened at 12mm). Three thousand projections were taken in half acquisition over 360°. The time of exposure was 0.4s. The sample was set up at a distance of 900mm from the detector.
1.2.3. High-resolution scan
Two spots were imaged at 0.678μm voxel size in the diaphyseal region and at the location of the distal ossification notch. A monochromatic beam, filtered with 2mm of aluminium and 0.25mm of copper, was used. This resulted from the use of a single crystal 2.5nm period W/B4C multilayer monochromator at 52keV. A FReLoN 2k14 CCD camera (Labiche et al. Reference Labiche, Mathon, Pascarelli, Newton, Guilera Ferre, Curfs, Vaughan, Homs and Fernandez Carreiras2007) was coupled to an optical system with a 25-μm-thick GGG:Eu scintillator. The sample was fixed at 150mm from the detector. A total of 1999 projections were taken over 360°.
1.2.4. Data reconstruction
The data were reconstructed using a single-distance phase-retrieval approach (Sanchez et al. Reference Sanchez, Ahlberg, Trinajstic, Mirone and Tafforeau2012) based on a modified version of the algorithm of Paganin et al. (Reference Paganin, Mayo, Gureyev, Miller and Wilkins2002). An unsharp mask was applied to the radiographs after the phase retrieval to compensate for the partial loss of high frequencies.
1.2.5. Data visualisation
Three-dimensional (3D) modelling and virtual thin-sectioning were made using the software VGStudio MAX versions 2.2.5 and 3.0 (Volume Graphics Inc., Germany). Virtual thin-sections were made to apply a skeletochronological analysis and for studying the trabecular mesh. The orientation of the trabeculae was revealed by a directional bicoloured lightening following the same protocol as Sanchez et al. (Reference Sanchez, Ahlberg, Trinajstic, Mirone and Tafforeau2014).
1.2.6. Data measurements
The bone volume and cell volume were measured using, respectively, the Volume Analyser tool and the Porosity/Inclusion Analysis module in VGStudio MAX version 2.2.5 (Volume Graphics Inc., Germany).
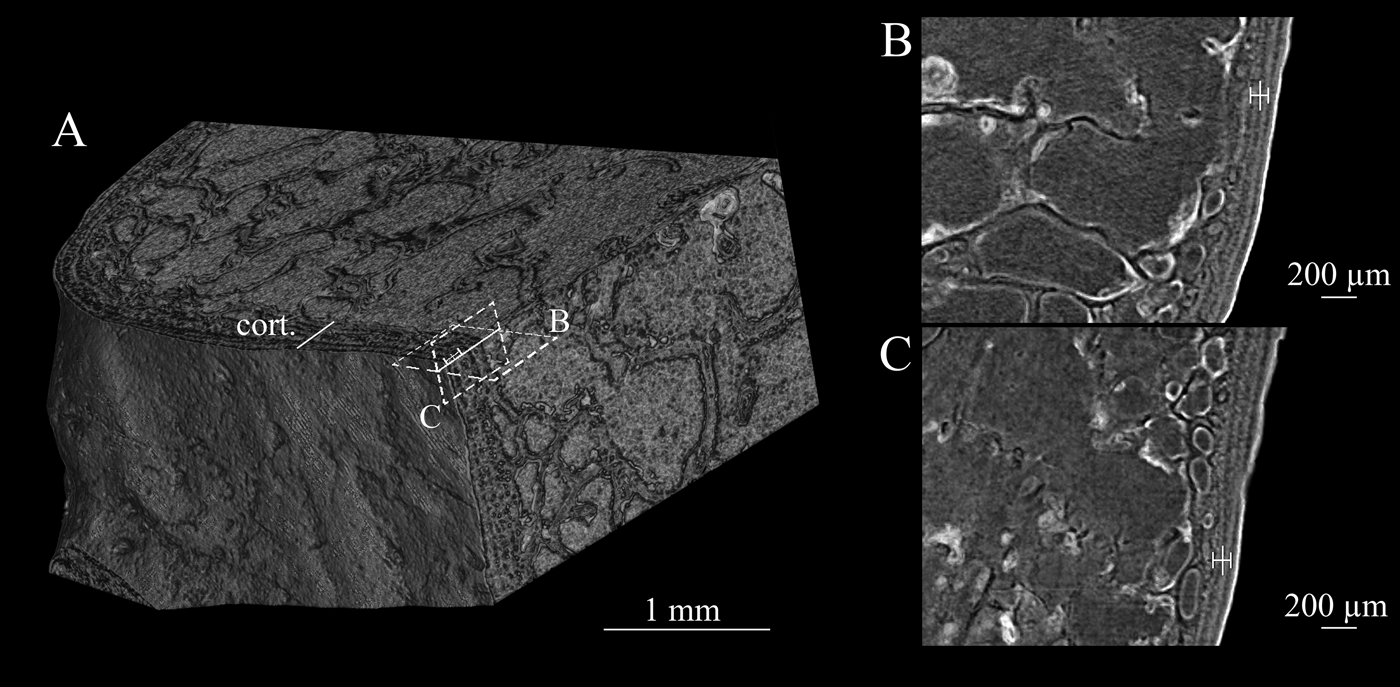
A skeletochronological analysis was performed at mid-shaft, i.e., at the site of primary ossification (Francillon-Vieillot et al. Reference Francillon-Vieillot, Buffrénil, Castanet, Géraudie, Meunier, Sire, Zylberberg, De Ricqlès and Carter1990; Castanet et al. Reference Castanet, Francillon-Vieillot, Meunier, De Ricqlès and Hall1993). This constitutes the region (Figs 1, 2) where the largest amount of cortical bone was deposited since the beginning of the bone development. The number of LAGs could be counted on the medium-resolution scan data for the study of the cyclical bone deposition of Hyneria lindae (Fig. 2).
Skeletochronological measurements on the left humerus of Hyneria lindae (ANSP 21483). (A) 3D model of the mid-shaft showing the LAG visible in the cortical bone. (B) LAG pattern (highlighted by the symbol ‡) in a transverse section. (C) LAG pattern in a longitudinal section. Abbreviation: cort. = cortical bone.

2. Results
2.1. Microanatomy
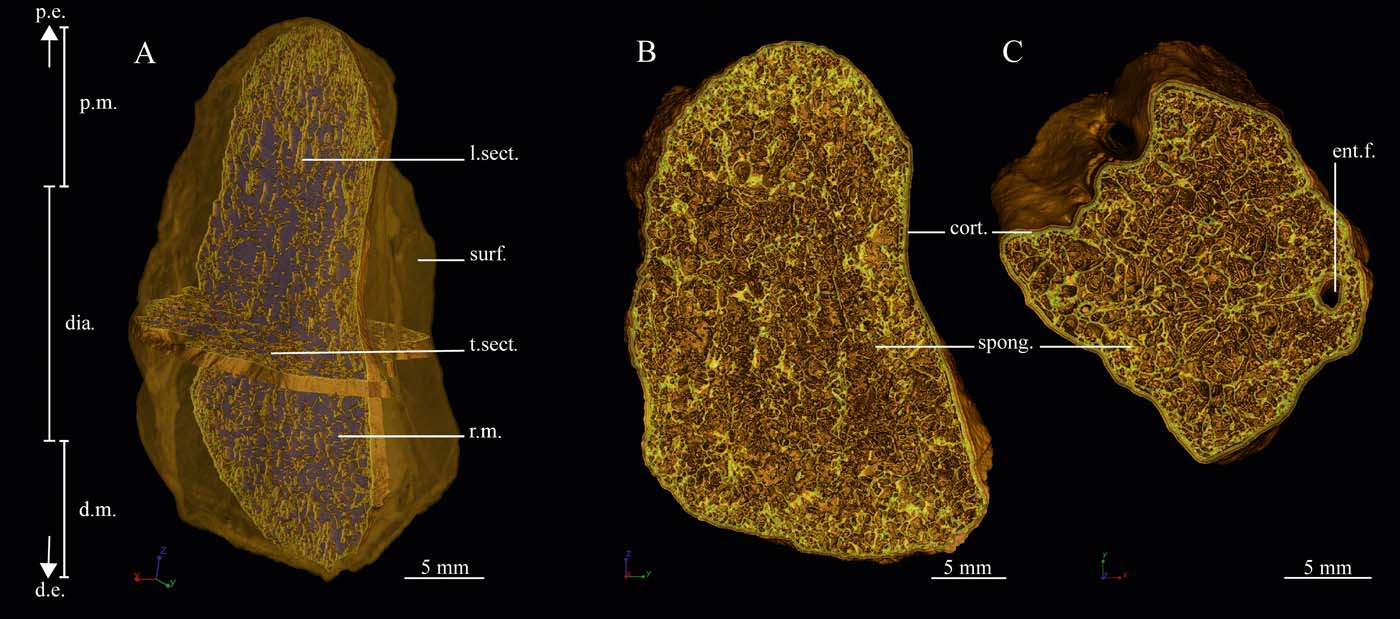
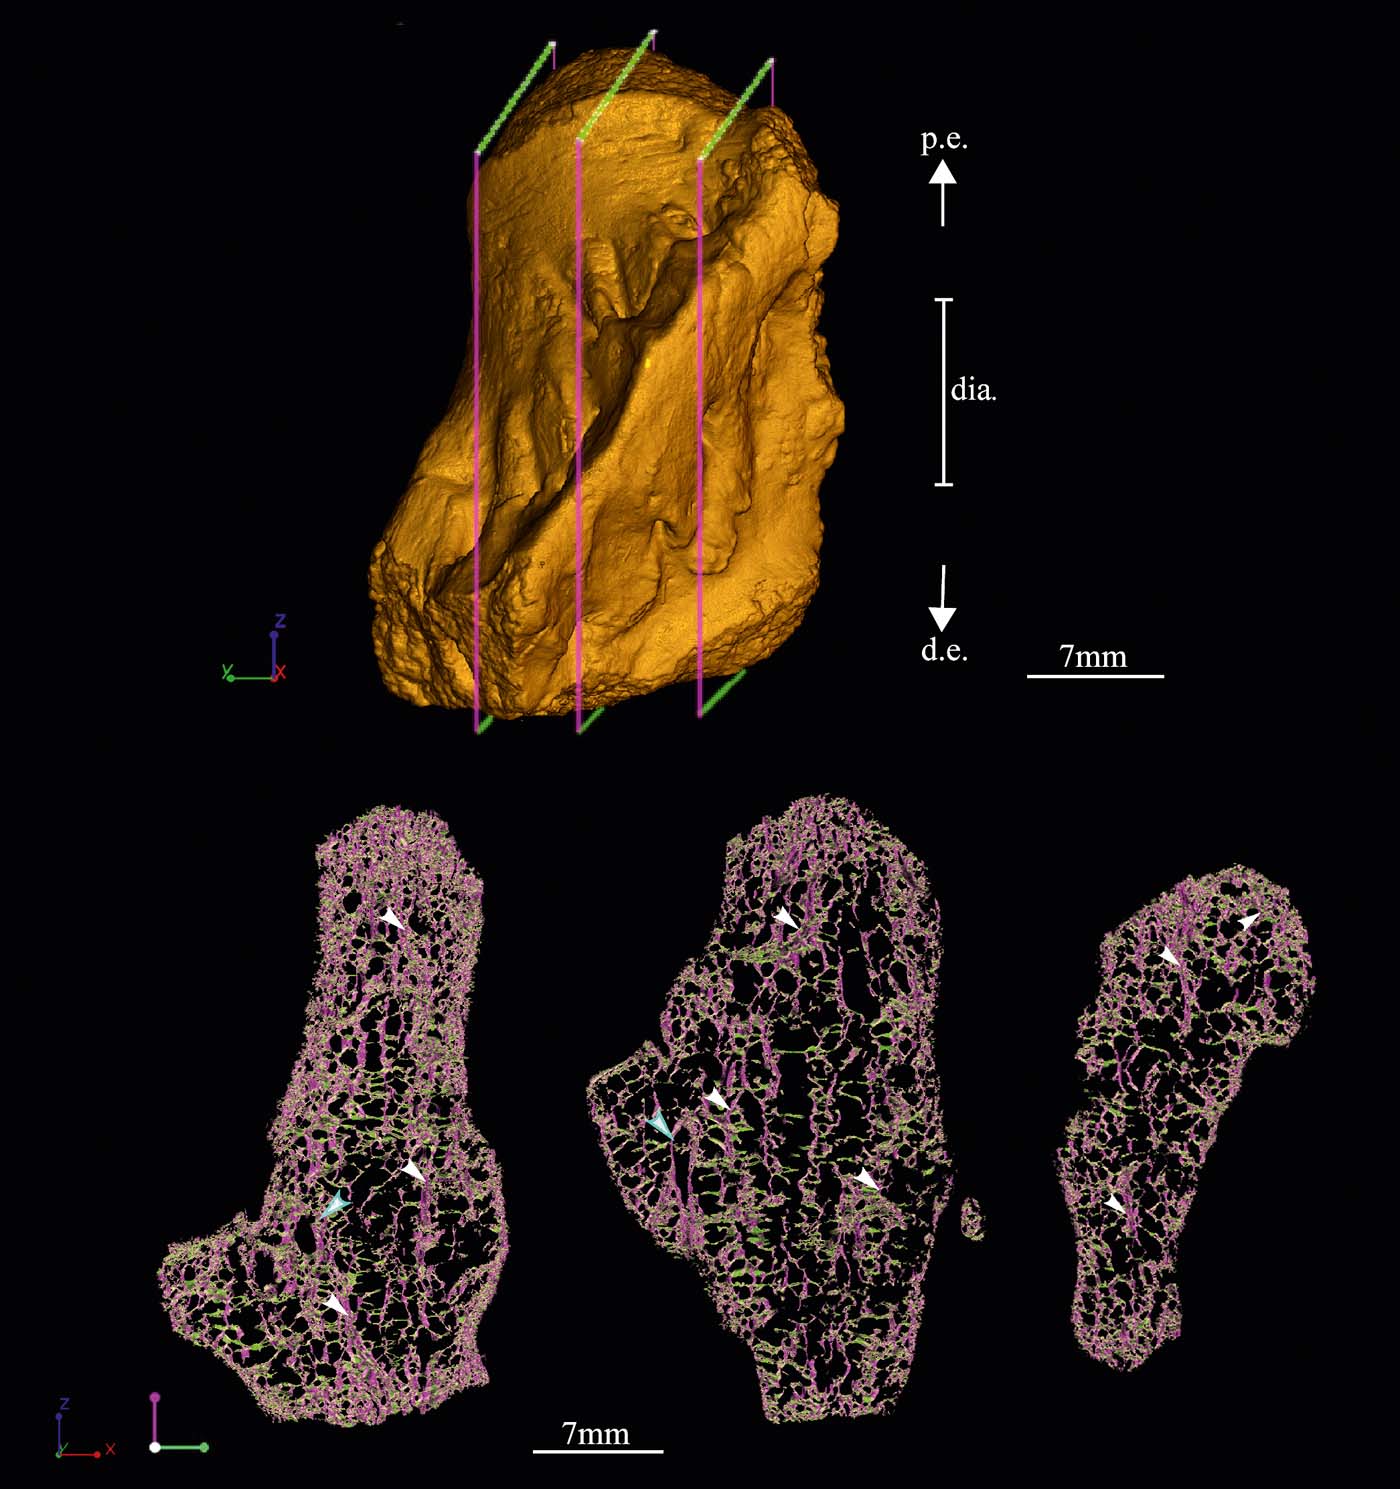
The humerus ANSP 21483 is very spongy (Fig. 3): spongiosa comprises 92% of the total volume of the bone. Although the empty cavities between the trabeculae of the spongiosa were entirely filled in with rock matrix, the trabecular mesh of the spongiosa is preserved in 3D and well visible with X-rays (Fig. 3). The density of trabeculae is higher in the proximal and distal metaphyses and slightly decreases in the centralmost region of the diaphysis (Fig. 3a). The trabeculae have an average thickness of 66μm. A slightly preferential longitudinal orientation of the trabecular mesh can be highlighted (Fig. 4) using directional bicoloured lightening (Sanchez et al. Reference Sanchez, Tafforeau and Ahlberg2014). Longitudinally oriented tubular structures (Fig. 4), with an average diameter of 364μm, run from the proximal epiphysis to the distal epiphyses. These tubular structures are also connected to each other and anastomosed by transversely oriented, smaller tubular processes that form a network. The transverse tubular structures have an average diameter of 157μm (Fig. 4).
Microanatomy of the left humerus of Hyneria lindae (ANSP 21483). (A) 3D model of the humerus showing the microanatomy of the bone. (B) Longitudinal section presenting a denser spongiosa in the metaphyseal regions of the bone. (C) Transverse section exhibiting the mid-shaft organisation of the spongiosa. Abbreviations: cort. = cortical bone; d.e. = distal epiphysis; d.m. = distal metaphysis; dia. = diaphysis; ent.f. = entepicondyle foramen; l.sect. = longitudinal section; p.e. = proximal epiphysis; p.m. = proximal metaphysis; r.m. = infilling of rock matrix; spong. = spongiosa; surf. = surface of the bone; t.sect. = transverse section.

Oriented microanatomy of the left humerus of Hyneria lindae (ANSP 21483). 3D model of the humerus showing the orientation of the spongiosa at three different locations inside the bone. The longitudinal trabeculae are highlighted in purple, while the transverse trabeculae are in green. The white arrows represent the marrow processes, and the blue arrows, the foramina. Abbreviations: d.e. = distal epiphysis; dia. = diaphysis; p.e. = proximal epiphysis.

These tubular structures should be distinguished from the entepicondylar foramina that can also be longitudinally oriented but are much larger (average diameter of 2.1mm; pointed out by the blue arrows in Fig. 4).
A thin layer of compact cortical bone (average thickness: 1.34mm at mid-shaft; Fig. 3b, c) surrounds the spongiosa.
2.2. Histology
2.2.1. Diaphyseal bone histology
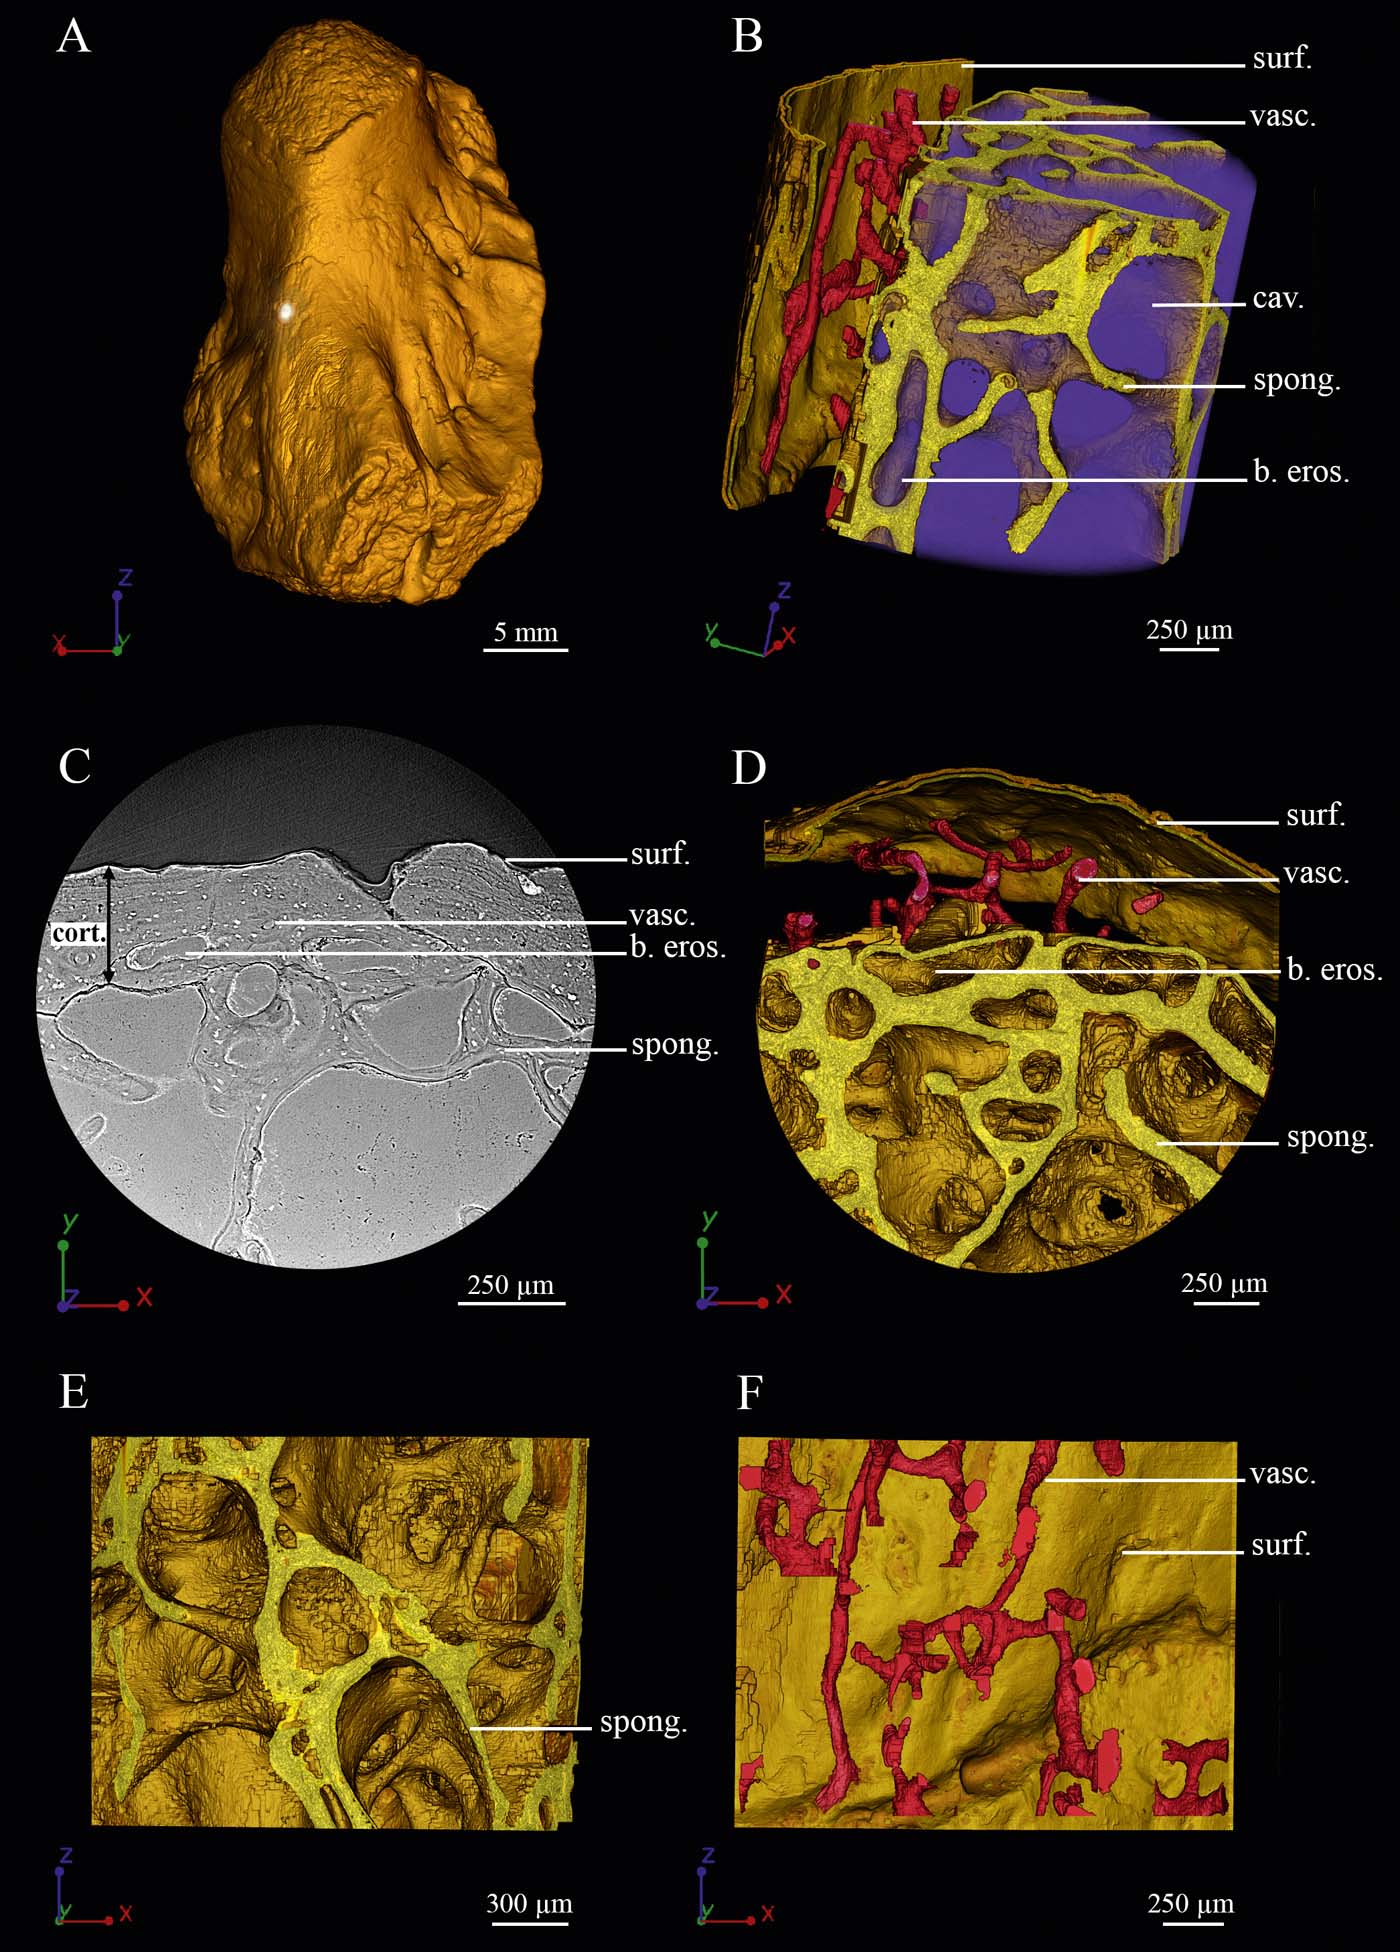
At mid-shaft, the compact bone of Hyneria lindae is made of primary bone (Fig. 5c). In its inner part, bays of erosion progressively transform the compact cortex into a cancellous bone connected to the innermost trabecular mesh (Fig. 5). This process leads to the extension of the original spongiosa and reduces the thickness of the compact cortex to 8% of the total volume of the bone (Fig. 3). The total spongiosa is denser under the surface of the compact bone, but the smaller diameter of the trabeculae in the most central region of the medullary cavity at mid-shaft suggests that the spongiosa becomes eroded in this region (Fig. 3). Under the surface of the bone, the trabeculae form plates (Fig. 5d, e). In the central region of the medullary cavity, more spicule-like trabeculae are visible (Fig. 3). All trabeculae remain primary wherever they are found. The scan images show that no secondary bone has been deposited on the trabeculae (Fig. 5c).
Diaphyseal histology of the left humerus of Hyneria lindae (ANSP 21483). (A) 3D model of the humerus showing the location where the high-resolution scan was made to study the histology of the cortical bone at mid-shaft. (B) Oblique view of the cortical microstructure in 3D. (C) Transverse virtual thin section. (D) Transverse 3D histological model. (E) 3D model of the trabecular mesh of the spongiosa. (F) 3D model of the vascular mesh of the cortical bone. Abbreviations: b. eros. = bay of erosion; cav. = cavity; cort. = cortical bone; spong. = spongiosa; surf. = surface of the bone; vasc. = vascularisation.

The primary bone of the cortex is pierced by a network of vascular canals (Fig. 5c, d). Long, longitudinally oriented, primary canals run within the compact cortical bone (Fig. 5b, f). They are transversely anastomosed to each other. They also connect to smaller radial canals (Fig. 5f). All canals exhibit a relatively small diameter (ranging between 31 and 63μm; Fig. 5).
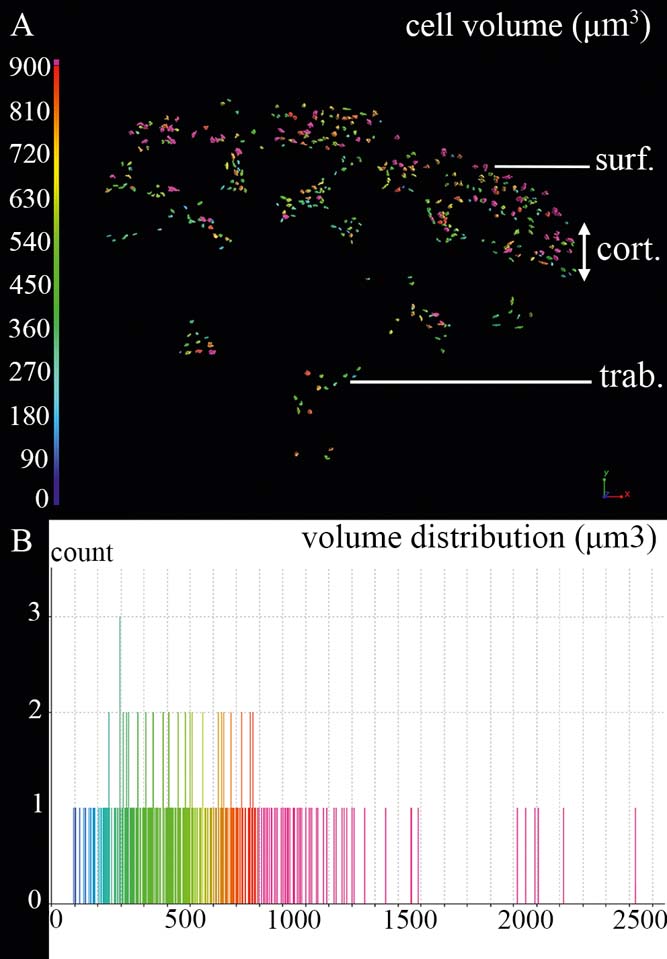
The primary bone of the cortex and trabeculae contains round cell lacunae (Fig. 6). The density of osteocyte lacunae is relatively low at mid-shaft in ANSP 21483 (Fig. 5c). Their lacunar volume varies within the range of 125–2500μm3, with a greater density of cells ranging between 125 and 1500μm3 (Fig. 6).
Cell volume in the diaphyseal cortex of the left humerus of Hyneria lindae (ANSP 21483). (A) Colour-coding map of the cellular volume in a virtual thin section made in transverse view in the mid-shaft of the bone. The colour-coding scale shows that small cell lacunae are in blue and large cell lacunae are in red and pink. (B) Histogram showing the distribution of cells based on their lacuna volume. Abbreviations: cort. = cortical bone; surf. = surface of the bone; trab. = trabecula.

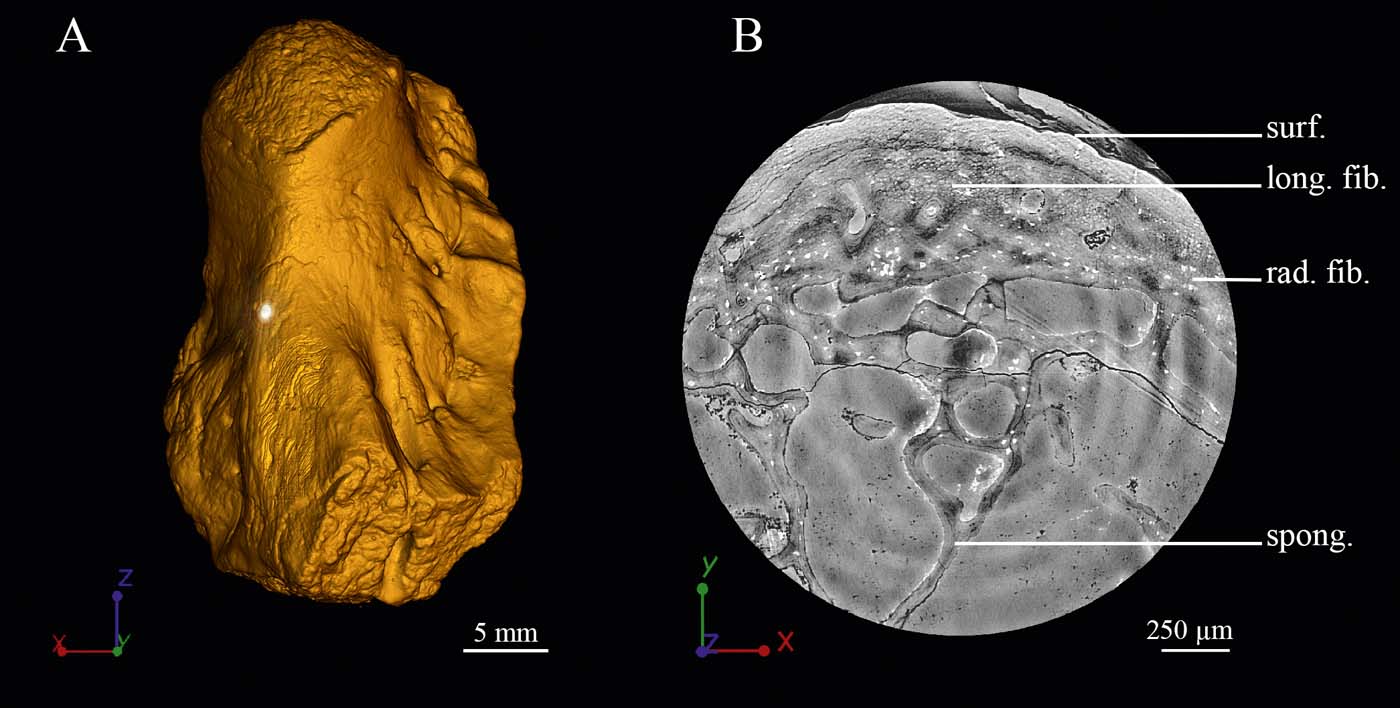
Some bundles of extrinsic fibres are well visible at mid-shaft (Fig. 7). Although they proved impossible to model in 3D, we can clearly see that different fibre bundles are oriented in both radial and longitudinal directions (Fig. 7b). They run through the entire thickness of the cortex up to the surface of the bone. They are located in the mesial region of ANSP 21483, in a region that is homologous to where a muscle attachment was identified in the humerus of Eusthenopteron foordi (Sanchez et al. Reference Sanchez, Dupret, Tafforeau, Trinajstic, Ryll, Gouttenoire, Wretman, Zylberberg, Peyrin and Ahlberg2013). The shape, volume and density of the osteocyte lacunae in the vicinity of the muscle attachment suggest that it is a periosteally mediated fibrous enthesis as in E. foordi (Sanchez et al. Reference Sanchez, Dupret, Tafforeau, Trinajstic, Ryll, Gouttenoire, Wretman, Zylberberg, Peyrin and Ahlberg2013).
Diaphyseal fibrillar histology of the left humerus of Hyneria lindae (ANSP 21483). (A) 3D model of the humerus showing the location where the high-resolution scan was made to study the fibrillar histology of the cortical bone at mid-shaft. (B) Transverse virtual thin section of the cortical bone. Abbreviations: long. fib. = longitudinal fibres; rad. fib. = radial fibres; spong. = spongiosa; surf. = surface of the bone.

2.2.2. Metaphyseal bone histology
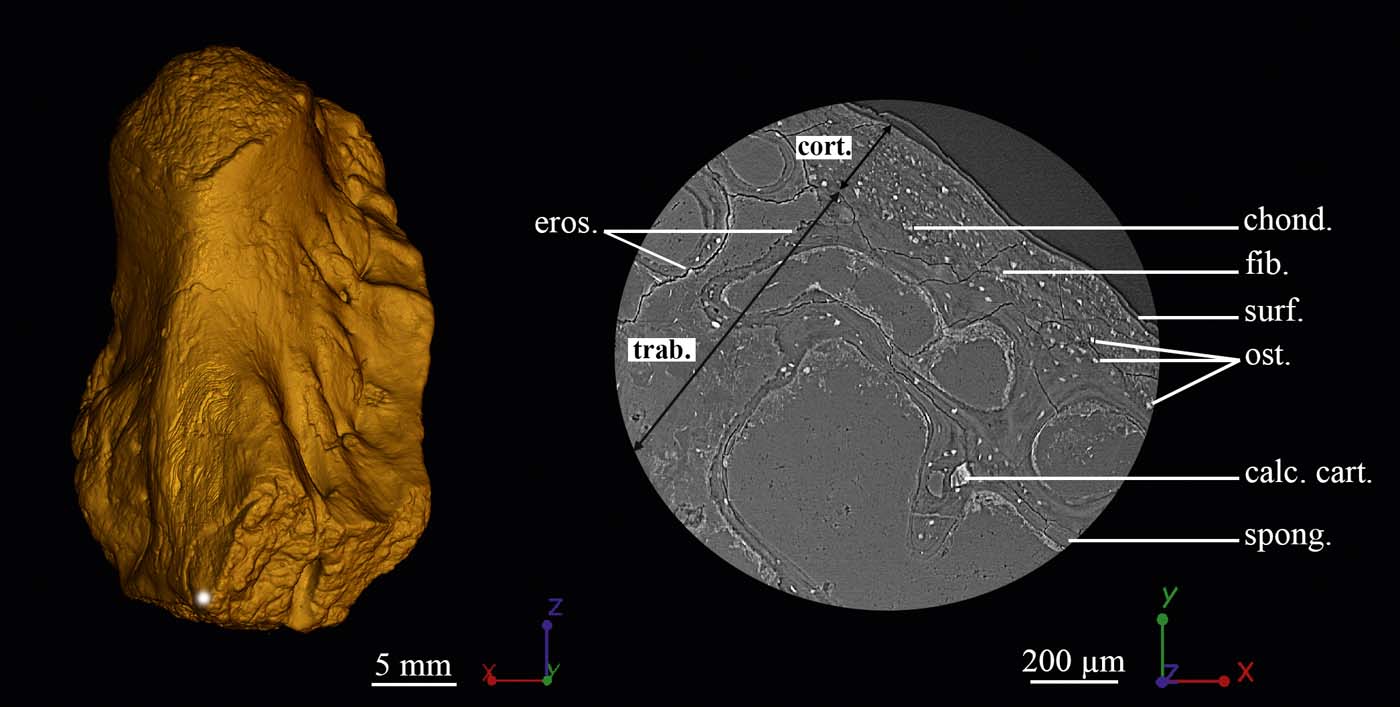
The compact cortical bone at the location of the ossification notch (in mesial view) is primary (Fig. 8). It is very fibrous, with several bundles of radial extrinsic fibres entering the whole cortical thickness at this location. It exhibits large, round cell lacunae (Fig. 8b). There are only a few small, radial, vascular canals (average diameter: 36μm). A clear margin distinguishes the cortical bone (cort., Fig. 8b) from the trabecular bone (trab., Fig. 8b). This margin hosts large, round cell spaces that are aligned to each other (chond., Fig. 8b). The irregular surface of a few trabeculae suggests that they were slightly eroded in the metaphysis (eros., Fig. 8b) but no secondary bone deposit has been observed at this location. Most of the trabeculae, therefore, have the same thickness as at mid-shaft (Fig. 8b).
Metaphyseal histology of the left humerus of Hyneria lindae (ANSP 21483). (A) 3D model of the humerus showing the location where the high-resolution scan was made to study the histology of the cortical bone in the metaphysis. (B) Transverse virtual thin section of the cortical bone. Abbreviations: calc. cart. = calcified cartilage; chond. = chondrocyte lacuna; cort. = cortical bone; eros. = eroded surface; fib. = fibres; ost. = osteocyte lacuna; spong. = spongiosa; surf. = surface of the bone; trab. = trabecular mesh.

2.3. Skeletochronological measurements at mid-shaft
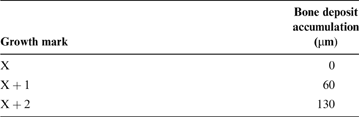
Three LAGs can be identified (Fig. 2). The distance between the LAGs was measured in order to assess the annual growth rate; they are relatively closely spaced (60–70μm; Table 1) and the distance between them remains approximately constant.
Measurements of bone deposited between two LAGs every year.

3. Discussion
3.1. Long-bone development and evolution
3.1.1. Long-bone development in Hyneria lindae
The organisation of the primary tissue of the compact cortex of ANSP 21483 (Figs 2, 5) demonstrates that it was formed by apposition of periosteal bone (Francillon-Vieillot et al. Reference Francillon-Vieillot, Buffrénil, Castanet, Géraudie, Meunier, Sire, Zylberberg, De Ricqlès and Carter1990), thereby allowing the thickening of the humerus. The large, round cell spaces located under the innermost surface of the cortical bone (Fig. 8) resemble the chondrocyte lacunae of Katschenko's line in Acanthostega gunnari (Sanchez et al. Reference Sanchez, Tafforeau, Clack and Ahlberg2016). They reveal a long-bone origin from a cartilaginous rod (Francillon-Vieillot et al. Reference Francillon-Vieillot, Buffrénil, Castanet, Géraudie, Meunier, Sire, Zylberberg, De Ricqlès and Carter1990; Witten & Huysseune Reference Witten, Huysseune and Hall2007; Sanchez et al. Reference Sanchez, De Ricqlès, Schoch and Steyer2010, Reference Sanchez, Tafforeau and Ahlberg2014, Reference Sanchez, Tafforeau, Clack and Ahlberg2016). The remnants of calcified cartilage, observed in the metaphyseal region of ANSP 21483, support that the spongiosa (Figs 3, 4) was primarily formed by endochondral ossification (Francillon-Vieillot et al. Reference Francillon-Vieillot, Buffrénil, Castanet, Géraudie, Meunier, Sire, Zylberberg, De Ricqlès and Carter1990). The higher density of spongy bone in the metaphyseal regions (Fig. 3a) suggests an intense production of trabeculae in these areas, resulting from the action of the growth plates (Haines Reference Haines1942; Ortega et al. Reference Ortega, Behonick and Werb2004). They play a major role in the elongation of the bone through endochondral ossification (Haines Reference Haines1942; Francillon-Vieillot et al. Reference Francillon-Vieillot, Buffrénil, Castanet, Géraudie, Meunier, Sire, Zylberberg, De Ricqlès and Carter1990; Ortega et al. Reference Ortega, Behonick and Werb2004). Ossified, longitudinal columns of trabeculae form along the columns of hypertrophied chondrocytes where both vascular vessels participate in supplying nutrients, cells and factors necessary to initiate the endochondral ossification (Haines Reference Haines1942; Suzuki et al. Reference Suzuki, Takase, Takigawa, Uchida and Shimomura1981; Gerber & Ferrara Reference Gerber and Ferrara2000). In addition, clear, large, longitudinal, tubular processes could be identified in the spongiosa of ANSP 21483 (Fig. 4). The size, orientation and location of these tubular structures in Hyneria lindae suggests that they are bone marrow processes similar to those in crown tetrapods (Haines Reference Haines1938; Clark 1990) and the tristichopterid Eusthenopteron foordi (Sanchez et al. Reference Sanchez, Tafforeau and Ahlberg2014).
3.1.2. Long-bone evolution
All the processes of bone thickening and elongation in the humerus of ANSP 21483 follow the characteristic steps of tetrapod long-bone development (Francillon-Vieillot et al. Reference Francillon-Vieillot, Buffrénil, Castanet, Géraudie, Meunier, Sire, Zylberberg, De Ricqlès and Carter1990; Sanchez et al. Reference Sanchez, Ahlberg, Trinajstic, Mirone and Tafforeau2010). Similar results were previously obtained from Eusthenopteron foordi (Meunier & Laurin Reference Meunier and Laurin2012; Sanchez et al. Reference Sanchez, Tafforeau and Ahlberg2014), another member of the clade Tristichopteridae. This suggests, firstly, that a tetrapod-like mode of development is shared with the Tristichopteridae as a whole, and, secondly, that it is probably general for at least the upper part of the finned grade of the tetrapod stem group. In other words, the tetrapod style of long-bone development originated well before the transition from fins to limbs.
Bone marrow is intimately associated with long-bone elongation and endochondral ossification (Suzuki et al. Reference Suzuki, Takase, Takigawa, Uchida and Shimomura1981; Long et al. Reference Long, Robinson, Ashcraft and Mann1995; Long Reference Meunier and Laurin2001; Calvi et al. Reference Calvi, Adams, Weibrecht, Weber, Olson, Knight, Martin, Schipani, Divieti, Bringhurst, Milner, Kronenberg and Scadden2003; Wilson & Trumpp Reference Wilson and Trumpp2006). The presence of marrow processes in Hyneria lindae and Eusthenopteron foordi (Sanchez et al. Reference Sanchez, Tafforeau and Ahlberg2014) suggests that this relationship was established early in the evolutionary history of tetrapods. It is worth mentioning that H. lindae and E. foordi both show a relatively primitive organisation of the marrow distribution in their humeri. The enclosed system of marrow processes suggests that bone marrow remained located in specific tubular structures late in the development of the animal. There is no evidence of an erosion of the trabecular mesh to form an enlarged marrow cavity as in extant tetrapods. A recent study revealed that the 360-million-year-old limbed stem tetrapod Acanthostega gunnari (Sanchez et al. Reference Sanchez, Tafforeau, Clack and Ahlberg2016) had a humeral microanatomy similar to that of the tristichopterids H. lindae and E. foordi, but quite different from the type of marrow cavity observed in crown tetrapods (Haines Reference Haines1942; Gerber & Ferrara Reference Gerber and Ferrara2000; Wilson & Trumpp Reference Wilson and Trumpp2006).
3.2. Ontogeny and life history traits of Hyneria lindae
Life history traits are recorded in bone deposits and can be revealed through long-bone histology (Castanet et al. Reference Castanet, Francillon-Vieillot, Meunier, De Ricqlès and Hall1993; Chinsamy Reference Chinsamy1997; De Ricqlès et al. Reference De Ricqlès, Castanet and Francillon-Vieillot2004; Köhler et al. Reference Köhler, Marín-Moratalla, Jordana and Aanes2012; Padian Reference Padian2012). The compact cortical bone displays the dynamic processes that occurred during bone deposition and remodelling. Juvenile and adult bones are, therefore, characterised by distinctive microstructural organisations, even in stem tetrapods (Sanchez et al. Reference Sanchez, Tafforeau and Ahlberg2014, Reference Sanchez, Tafforeau, Clack and Ahlberg2016). Based on these considerations, a histological analysis was conducted in order to reveal the physiological and ontogenetic features of the studied specimen of Hyneria lindae.
3.2.1. Bone growth rate
Amprino's rule states that bone growth rate is reflected by the type of tissue deposited (Amprino Reference Amprino1947). The vascular mesh is the main system supplying the bone (i.e., providing growth factors, blood cells, oxygen, minerals, ions, glucose, hormones) and triggering ossification mechanisms, fracture repair and bone regeneration (Trueta Reference Trueta1963). A dense vascular mesh would, therefore, increase the supply of both oxygen and nutrients, which would directly impact growth rate and metabolism. The presence of tight LAGs (Fig. 2), the primary nature of the periosteal bone and vascularisation in the cortical bone of ANSP 21483 and the low density at mid-shaft and longitudinal orientation of the vascular mesh (Fig. 4) all reflect the slow bone deposition characteristic of ectothermic organisms (Castanet et al. Reference Castanet, Francillon-Vieillot, De Ricqlès, Heatwole and Davies2003; De Ricqlès et al. Reference De Ricqlès, Castanet and Francillon-Vieillot2004).
Skeletochronological measurements confirm these qualitative observations in the humerus of Hyneria lindae (Table 1; Fig. 2), revealing a characteristically slow, cyclical (very likely annual) bone-deposition rate of 65μm, on average, for the cortex of the studied specimen.
3.2.2. Ontogenetic features
When compared to the tristichopterid Eusthenopteron foordi (Sanchez et al. Reference Sanchez, Tafforeau and Ahlberg2014), the microanatomy and histology of the humerus of Hyneria lindae reveals a mixture of both juvenile and adult features. The cyclical average bone deposition rate of 65μmyear–1 in ANSP 21483 is much slower than in the humerus of the juvenile E. foordi, but twice the rate in the adult E. foordi (Sanchez et al. Reference Sanchez, Tafforeau and Ahlberg2014). The low density of vascular canals and their small diameter (ranging between 31 and 63μm in the studied specimen of H. lindae) strongly support low bone dynamics similar to that of the adult E. foordi. Although the lack of calcified cartilage and chondrocyte lacunae on the innermost surface of the mid-shaft cortex results from the advanced shift of the erosion front in the diaphysis of ANSP 21483, the periosteal bone remains intact in the metaphyseal region – where some remnants of chondrocyte lacunae from the Katschenko's line are still visible. Thus, erosion had already begun at mid-shaft but had not yet reached the metaphyses of the humerus of H. lindae. The latter displays here an intermediate condition between the advanced eroded state of the adult E. foordi and the intact bone of the juvenile E. foordi. There is no secondary bone deposit on the trabecular mesh of H. lindae, contrary to the adult E. foordi. Therefore, these observations suggest that the humerus ANSP 21483 belonged to a late juvenile or early adult.
The study of all available material of Hyneria lindae (Daeschler & Downs Reference Daeschler and Downs2018) suggests that this humerus probably belonged to a small-to-medium-sized individual. The current palaeohistological study shows that it was growing slowly, thereby implying that individuals of H. lindae already had relatively slow growth early in their life.
The observation of remnants of Katschenko's line in the metaphyseal region suggests that the cartilaginous rod, which shaped the earlier stages of the humerus, was large and persisted late in the development of the animal. Therefore, the onset of ossification of the humerus in Hyneria lindae happened late in development, like Eusthenopteron foordi (Sanchez et al. Reference Sanchez, Tafforeau and Ahlberg2014) and Acanthostega gunnari (Sanchez et al. Reference Sanchez, Tafforeau, Clack and Ahlberg2016).
3.2.3. Paedomorphic characteristics
A noteworthy and biologically interesting difference between Hyneria lindae and Eusthenopteron foordi is the size of the osteocyte lacunae in the humerus, which are approximately three times bigger by volume in Hyneria than in Eusthenopteron (Fig. 6). It is well known that there is a positive correlation between genome size and cell size in bone in all groups of vertebrates (Gregory Reference Gregory2002; Organ et al. Reference Organ, Shedlock, Meade, Pagel and Edwards2007, Reference Organ, Struble, Canoville, de Buffrénil and Laurin2016; D'Emic & Benson Reference D'Emic and Benson2013). The difference in lacuna volume thus suggests that H. lindae had a considerably larger genome than Eusthenopteron foordi, notwithstanding the close phylogenetic relationship between the two. The size of the genome in vertebrates has been associated with multiple factors such as the development rate, cell-division rate and developmental complexity (Gregory Reference Gregory2002). Notably, a large genome has been linked to the occurrence of neotenic traits in lungfishes (Bemis Reference Bemis1984) and amphibians (Gregory Reference Gregory2002). Neoteny has often been associated with gigantism in the evolutionary history of vertebrates (Schoch Reference Schoch2013). For example, cryptobranchid salamanders and stereospondyl temnospondyls both include forms that independently evolved a combination of large body size and neotenic characteristics (Wake Reference Wake1991; Schoch Reference Schoch2013). In addition, the cryptobranchids Andrias and Cryptobranchus exhibit relatively large genome sizes (Organ et al. Reference Organ, Struble, Canoville, de Buffrénil and Laurin2016). No bone cells of neotenic stereospondyls have been investigated to date. Compared to Eusthenopteron foordi, H. lindae displays certain characteristics that could be described as neotenic, most obviously the lack of neurocranial ossification, which contrasts with the well-ossified neurocranium of Eusthenopteron foordi (Jarvik Reference Jarvik1980; Daeschler & Downs Reference Daeschler and Downs2018). A poorly ossified neurocranium is also present in Eusthenodon wangsjoi, a giant tristichopterid from east Greenland that appears to be closely related to H. lindae (Jarvik Reference Jarvik1952). A case can thus be made for interpreting the large size, neotenic characteristics and presumed large genome of H. lindae as a causally linked character complex, with the large genome having a mechanistic role in generating the other characters.
3.2.4. Life history traits
The skeletochronological analysis obviously shows the presence of two growth marks framed by three LAGs on the remaining external part of the cortex. Based on the assumption that a growth mark represents an annual cycle in most crown tetrapods (Castanet et al. Reference Castanet, Francillon-Vieillot, Meunier, De Ricqlès and Hall1993), it can be assumed that this part of the cortex was deposited during the two last years of life of the animal. The bone deposition rate (65μm on average) measured for the ossification of the cortex of ANSP 21483 is relatively slow. It is twice as high as the growth rate of the adult Eusthenopteron foordi, but it is important to keep in mind that the humerus of Hyneria lindae is also twice the size of that of the adult E. foordi. As the H. lindae humerus probably represents a late juvenile or subadult (see Section 3.2.2), not a fully adult individual like the E. foordi humerus, the growth rate is probably relatively lower in H. lindae. Together, these observations suggest that H. lindae had a low metabolism. Although H. lindae was a top predator within the alluvial ecosystem of the Catskill Formation (Daeschler & Downs Reference Daeschler and Downs2018), our results support the hypothesis that H. lindae was probably a weak long-distance swimmer, and a rather inactive fish that would only occasionally perform high-speed attacks to catch prey. In such cases, H. lindae would only require a minimum amount of energy to move and feed. Anatomical data seem to support these physiological and behavioural hypotheses. Although the fossil remnants of H. lindae are too fragmentary to allow a reconstruction of the body morphology, and it has not yet been included in a published phylogenetic analysis, its character complement strongly suggests that it belongs in a clade of large derived tristichopterids with Eusthenodon and the Australian genera Mandageria and Edenopteron (Thomson Reference Thomson1976; Johanson & Ahlberg Reference Johanson and Ahlberg1997; Young et al. Reference Young, Dunstone, Senden and Young2013; Daeschler & Downs Reference Daeschler and Downs2018). Mandageria is known from articulated whole-body specimens, which show a fish with an elongated body and relatively small median fins of low aspect ratio clustered at the posterior end (Ahlberg & Johanson Reference Ahlberg and Johanson1997), comparable to the morphology of an ambush predator such as a pike (Webb Reference Webb1984). This contrasts with E. foordi, in which the median fins are larger, with a higher aspect ratio, and are positioned more anteriorly (Jarvik Reference Jarvik1980). If we assume that H. lindae had a body morphology similar to Mandageria, which seems reasonable, we can infer that it was a less active swimmer than E. foordi, but capable of powerful acceleration while striking at prey (Webb Reference Webb1984).
4. Conclusion
The current study on Hyneria lindae supports a low ossification rate and a late ossification onset, thereby implying a slow development. This would explain why adult individuals could likely retain a partially unossified skeleton. In addition, the large size of the cell lacunae in the humerus of H. lindae, compared to Eusthenopteron foordi, suggests that its neotenous characters – and possibly its gigantic size – may have been causally linked to the possession of an enlarged genome. Body size greatly contributes to evolutionary adaptations (Bonett et al. Reference Bonett, Chippindale, Moler, Devender and Wake2009; Clack Reference Clack2012), and the clade of large tristichopterids to which H. lindae belongs appears to have captured top-predator niches in non-marine ecosystems worldwide towards the end of the Devonian. The low metabolism of H. lindae suggested by the bone histology supports the hypothesis of a sluggish animal with an ambush predator lifestyle. It would be interesting to investigate the life-history evidence provided by the bone histology, and the size of the osteocyte lacunae, in other members of this clade.
Finally, the LAG pattern and late ossification of ANSP 21483 suggest that Hyneria lindae probably had a long juvenile stage before reaching sexual maturity. Although very few studies address the life history traits of stem tetrapods, those that have been carried out all indicate a late onset of limb bone ossification for the studied taxa (Sanchez et al. Reference Sanchez, Klembara, Castanet and Steyer2008, Reference Sanchez, Tafforeau and Ahlberg2014, Reference Sanchez, Tafforeau, Clack and Ahlberg2016). Even though H. lindae, Eusthenopteron foordi and Acanthostega gunnari lived in different ecological conditions and presumably exhibited distinct behaviours, they all show a similar slow long-bone development. Presumed adult individuals of the Devonian limbed stem tetrapod Ventastega have an incompletely ossified scapulocoracoid, and no limb bones or vertebrae belonging to the taxon have been recovered from the rich and extensively collected source locality at Pavari in Latvia (Ahlberg et al. Reference Ahlberg, Clack, Luksevics, Blom and Zupins2008), suggesting very late ossification onset for the postcranial endoskeleton. The situation appears to be similar in a recently discovered Devonian limbed stem tetrapod from Sosnogorsk in South Timan, Russia (Ahlberg et al. Reference Ahlberg, Beznosov, Luksevics and Clack2011), where no limb elements have been found despite the high preservation potential of the locality (P. Beznosov, pers. com. 2018). Thus, the late onset of limb ossification may be widespread in the tetrapod stem group, both before and after the fin-to-limb transition. However, it is not present in branchiosaurs such as Apateon (Sanchez et al. Reference Sanchez, De Ricqlès, Schoch and Steyer2010) or stereospondyls like Gerrothorax (Sanchez & Schoch Reference Sanchez, Dupret, Tafforeau, Trinajstic, Ryll, Gouttenoire, Wretman, Zylberberg, Peyrin and Ahlberg2013), nor in extant cryptobranchids such as Andrias (Sanchez et al. Reference Sanchez, Tafforeau and Ahlberg2014). We will continue investigating the life-history traits of tetrapod stem group members to understand the evolution of this feature.
5. Acknowledgements
The authors are very grateful to J. A. Clack (University of Cambridge, UK), who has been an inspiring researcher for the current study. We thank the European Synchrotron Radiation Facility (France) where the sample was imaged (proposal EC203, S.S.). We acknowledge J. Estefa (Uppsala University, France), G. Clément, P. Janvier, J.-S. Steyer (MNHN, France) and P. Beznosov (Institute of Geology, Syktyvkar, Russia) for fruitful discussions. We are very grateful to Marcello Ruta, the editorial team of the journal and two anonymous reviewers whose remarks greatly improved the final manuscript. V. K. was funded by Erasmus Mundus for the Master Programme in Evolutionary Biology (MEME), S. S. was funded by a grant from Vetenskapsrådet (grant number 2015-04335). P. E. A. was funded by a Wallenberg Scholarship from the Knut and Alice Wallenberg Foundation.