Although in-person, face-to-face interviewing has long been considered the “gold standard” survey interviewing mode, the logistical and financial challenges are well-documented. Declining survey cooperation in recent decades has dramatically increased the labor and travel costs for in-person surveys (Couper, Reference Couper2011), prompting even major government and academic surveys to consider alternative survey modes. For example, the American National Election Studies (ANES) now routinely supplement their in-person surveys with an additional sample of self-administered online interviews, combining modes in their data releases. Recent comparisons of these different ANES samples have raised concerns about data comparability between the self-administered online mode and the interviewer-administered in-person mode (e.g., Atkeson et al., Reference Atkeson, Adams and Alvarez2014; Homola et al., Reference Homola, Jackson and Gill2016; Atkeson and Adams, Reference Atkeson, and Adams, Atkeson and Alvarez2018; Guay et al., Reference Guay, Hillygus and Valentino2019; Valentino et al., Reference Valentino, Zhirkov, Hillygus and Guay2020).
Improvements in Internet speed and access in recent years have prompted interest in the feasibility of a video interviewing mode—live, interviewer-administered surveys over an online platform such as Skype, Zoom, and WebEx (e.g., West et al., Reference West, Ong, Conrad, Schober, Larsen and Hupp2021)—as a lower cost alternative to in-person interviews.Footnote 1 After the COVID-19 pandemic halted in-person interviewing, the ANES and the European Social Survey (ESS) incorporated a video mode without a clear understanding of the implications for data quality and comparability, highlighting the need for research assessing video interviewing mode effects.
Scholars have speculated about the promise of video interviewing (Anderson, Reference Anderson, Conrad and Schober2008; Couper, Reference Couper2011; Jeannis et al., Reference Jeannis, Terry, Heman-Ackah and Price2013; Hanson, Reference Hanson2021; West et al., Reference West, Ong, Conrad, Schober, Larsen and Hupp2021), but the field lacks sufficient evidence about the advantages and disadvantages of video interviewing for large-scale survey research. Such an evaluation will necessarily require both an assessment of the operational hurdles for this mode of interviewing (e.g., Conrad et al., Reference Conrad, Schober, Hupp, West, Larsen, Ong and Wang2020; Schober et al., Reference Schober, Conrad, Hupp, Larsen, Ong and West2020; Okon et al., Reference Okon, Schober, Conrad, Hupp, Ong and Larsen2021) and an understanding of any mode effects that could impact data quality or research findings.Footnote 2 The latter goal is the focus of this paper.
Unfortunately, the vast majority of mode studies in the field cannot precisely isolate mode effects because interview mode is typically conflated with other survey design features, such as sample selection or non-response (see discussion in Gooch and Vavreck, Reference Gooch and Vavreck2019).Footnote 3 We thus conduct a small, but carefully designed, two-wave experiment in which respondents were randomly assigned to either an in-person or video survey wave after recruitment, consent, and completion of a self-administered online survey wave. The questionnaires include identical questions, thus allowing both a within-subject and a between-subject estimate of video mode effects. The between-subject comparison tests for any differences between video and in-person interviewing. Across multiple measures of satisficing, social desirability, and respondent satisfaction, we find no significant differences between the two interviewer-administered modes. In contrast, the within-subject comparison across waves consistently finds lower levels of satisficing in the interviewer-administered (video or in-person) wave than in the self-administered online wave. The within-subject comparison also finds some evidence that the interviewer-administered modes have higher levels of social desirability bias, but these effects are small and, more importantly, comparable for the video and in-person modes.
1. Background and expectations
The public's familiarity and use of video technology has markedly increased during the COVID-19 pandemic. Social distancing guidelines and public health mandates have meant that everything from work meetings to medical visits, happy hours, and holiday celebrations have moved online to video platforms like Skype, Zoom, or WebEx. Zoom, for instance, averaged more than 300 million daily meeting participants in December 2020, a 2900 percent increase over the previous year.Footnote 4 The integration of online video into work and social life for many across the globe raises the possibility of live video interviewing as a replacement or supplement for the in-person interviewing mode. A sizeable part of the data collection costs of in-person surveys accrues from interviewer travel, housing, and salary while in the field; reducing or eliminating interviewer household visits can result in significant cost savings.
Video technologies have been in use for a number of years now in qualitative research. Focus groups (Forrestal et al., Reference Forrestal, D'Angelo and Vogel2015), in-depth interviews (Janghorban et al., Reference Janghorban, Roudsari and Taghipour2014), and college admissions (Ballejos et al., Reference Ballejos, Oglesbee, Hettema and Sapien2018; Pasadhika et al., Reference Pasadhika, Altenbernd, Ober, Harvey and Miller2012) are just a few areas in which video interviews have sometimes replaced in-person interviews with equivalency in the observed outcomes. The successful use of video interviews in these diverse settings suggests that incorporating video into the data collection process could be a promising avenue for conducting survey interviews, especially when considering the reduced financial, geographic, and time barriers associated with video compared to in-person interviews (Sullivan, Reference Sullivan2012; Janghorban et al., Reference Janghorban, Roudsari and Taghipour2014). Video interviewing is not yet a routine interviewing mode for the survey industry, but survey methodologists have started to evaluate the operational and methodological considerations of relevance for video interviewing (Conrad et al., Reference Conrad, Schober, Hupp, West, Larsen, Ong and Wang2020; Schober et al., Reference Schober, Conrad, Hupp, Larsen, Ong and West2020; West et al., Reference West, Ong, Conrad, Schober, Larsen and Hupp2021). Effective incorporation of live video interviewing into large-scale survey research will require evaluation of both the logistical challenges to implementing video interviews as well as any potential mode effects that could impact data quality or comparability, especially for time series projects like the ANES and ESS.
The evaluation of video mode effects presented here builds on and contributes to a broad literature on survey mode effects. The growth in online surveys, in particular, spawned an extensive body of research comparing online surveys to alternative data collection modes (see Baker et al., Reference Baker, Blumberg, Brick, Couper, Courtright, Dennis, Dillman, Frankel, Garland, Groves, Kennedy, Krosnick and Lavrakas2010 for a review). This research sometimes finds mode differences (Yeager et al., Reference Yeager, Krosnick, Chang, Javitz, Levendusky, Simpser and Wang2011) and sometimes does not (Revilla and Saris, Reference Revilla and Saris2013; Ansolabehere and Schaffner, Reference Ansolabehere, Schaffner, Atkeson and Alvarez2018). For example, a series of mode studies in the ESS identified significant differences between the self-administered online mode and interviewer-administered in-person mode for 70 percent of the questions on the instrument (Villar and Fitzgerald, Reference Villar, Fitzgerald and Breen2017). By contrast, a mode study in the Netherlands found only modest differences between a self-administered online mode and interviewer-administered in-person mode (Revilla and Saris, Reference Revilla and Saris2013). Generally, then, previous research suggests that large survey mode effects are possible, but not inevitable—highlighting the need to evaluate any potential video mode effects.
In assessing mode effects, comparisons often focus on outcomes related to data quality, including indicators of satisficing and social desirability bias (e.g., Holbrook et al., Reference Holbrook, Green and Krosnick2003; Atkeson and Adams, Reference Atkeson, and Adams, Atkeson and Alvarez2018). Satisficing occurs when respondents exert less cognitive effort than needed to generate a thoughtful survey response from the survey answering process—interpreting the meaning and intent of each question, retrieving relevant information from memory, integrating that information into a summary judgment, and reporting that judgment accurately (Krosnick, Reference Krosnick1991). Satisficing impacts the integrity of survey estimates by introducing random or systematic error into the survey response. Common metrics of satisficing include speeding, item non-response, and a lack of differentiation in responses (also known as “straightlining”). Social desirability bias, another focus of mode studies, refers to the tendency of some respondents to deliberately underreport socially undesirable attitudes and behaviors or overreport outcomes that are more desirable. It is thought that some respondents will intentionally lie to comply with social norms. In political surveys, social desirability bias is commonly associated with the measurement of racial attitudes, voter turnout, and news consumption.
Although the field lacks a comprehensive understanding of video mode effects, the broader literature on mode effects points to expected similarities and differences with other survey interviewing modes. Prior research suggests that the presence or absence of a human interviewer is one of the most important characteristics of the survey experience (Klausch et al., Reference Klausch, Hox and Schouten2013; Atkeson and Adams, Reference Atkeson, and Adams, Atkeson and Alvarez2018).Footnote 5 A survey interview can be conceptualized as a conversation—an interaction between an interviewer and respondent—and the presence of the interviewer fundamentally shapes the nature and context of that conversation and ensuing survey responses. As Atkeson and Adams, (Reference Atkeson, and Adams, Atkeson and Alvarez2018: 65) explain, “contextual cues present in a survey differ depending on their presentation and the presence or absence of an interviewer. In this way, whether the survey is administered by the interviewer or by the respondent may influence respondent answers, potentially creating mode biases that can lead to problems of inference if not handled correctly.” As just one example, research has documented the impact of interviewer race on reported racial attitudes (e.g., Davis, Reference Davis1997; Liu and Wang, Reference Liu and Wang2016).
Given the important role of the interviewer, we might expect the interviewer-administered video mode to more closely mimic an interviewer-administered in-person mode than a self-administered online mode. That is, video interviewing should show similar levels of satisficing to in-person interviews and less satisficing than self-administered online interviews. Respondents should take fewer “mental shortcuts” when answering questions from an interviewer, even if the interview is happening through a video platform. At the same time, the presence of the interviewer could also activate social norms, thereby increasing social desirability bias in the video mode compared to the self-administered online mode.
While the previous literature offers strong theoretical claims about these potential mode differences, the existing empirical evidence is less clear than one might expect. For example, research finds differences in satisficing and social desirability across telephone and in-person modes, even though both are interviewer administered (Holbrook et al., Reference Holbrook, Green and Krosnick2003). There is also considerable variation across and even within different surveys. Some work finds more item non-response (Lesser et al., Reference Lesser, Newton and Yang2012) or more straightlining (Conrad et al., Reference Conrad, Schober, Hupp, West, Larsen, Ong and Wang2020) in self-administered than interviewer-administered modes, while others find no differences (Vavreck, Reference Vavreck2014). Examinations of the 2012 ANES documented mode differences in non-response, but with item non-response patterns varying across substantive topics; the in-person sample had lower non-response rates on abortion questions, but higher non-response on the gay rights questions compared to the online sample (Liu and Wang, Reference Liu and Wang2016; Liu Reference Liu2018). And while several studies have found higher levels of socially stigmatized attitudes and behaviors in self-administered surveys compared to interviewer-administered surveys (for a summary of this work, see Baker et al., Reference Baker, Blumberg, Brick, Couper, Courtright, Dennis, Dillman, Frankel, Garland, Groves, Kennedy, Krosnick and Lavrakas2010), others detect minimal differences (Haan et al., Reference Haan, Ongena, Vannieuwenhuyze and De Glopper2017). Some argue that the greater trust and rapport between the interviewer and respondent in an in-person interview can actually reduce social desirability bias (Holbrook et al., Reference Holbrook, Green and Krosnick2003).
Part of this inconsistency in the mode effects literature no doubt comes from the wide variation across study designs—in the population studied, outcomes evaluated, data collection implementation, and so on—which makes it difficult to synthesize the empirical patterns. More notably, very few previous studies cleanly isolate mode effects. The survey interview mode is rarely the only design feature that varies across contrasted samples. A survey mode switch is almost always accompanied by a change in the sample frame, making it difficult to distinguish what exactly is driving any observed differences. For example, the ANES online and in-person samples that have been the subject of multiple mode comparisons (e.g., Liu and Wang, Reference Liu and Wang2015) differ not only in interview mode, but also in sample frame, response rates, respondent survey experience, respondent incentives, and so on.Footnote 6 A number of studies have randomized mode prior to recruitment, but such a design does not eliminate the possibility of differential non-response confounding observed mode differences. An extensive review of the literature finds only two previous studies that randomized survey mode after respondents consented to cooperate. Gooch and Vavreck (Reference Gooch and Vavreck2019) compare self-administered online mode to interviewer-administered in-person mode and Chang and Krosnick (Reference Chang and Krosnick2010) compare self-administered online mode with interviewer-administered telephone (via intercom) mode. As such, there remains considerable uncertainty about the nature and extent of video mode effects compared to alternative interviewing modes. In this paper, we report the results of a lab experiment that randomized respondents onsite to either an interviewer-administered video survey wave or an interviewer-administered in-person survey wave after recruitment, consent, and completion of a self-administered online survey wave.
2. Experimental design
We recruited study respondents from a community research pool, which includes residents of the local geographic area, including some students and university employees, who are periodically invited to participate in online and onsite studies.Footnote 7 Respondents were compensated $15 cash after completing both waves of the survey. Data collection began on 11 October 2018 and continued through 13 December 2018, and was approved by Duke University's Institutional Review Board (protocol no. 2019-0071). After consenting to participate, respondents were provided a web link to a self-administered online survey, which they were required to complete in advance of their onsite interview, which had the mode randomized to be either an interviewer-administered video or interviewer-administered in-person survey.Footnote 8 To randomize respondents into the wave 2 survey mode, we used block randomization, by scheduled interviewer and date, since both observed and un-observed interviewer characteristics can influence responses and data quality (Schaeffer et al., Reference Schaeffer, Dykema, Maynard, Marsden and Wright2010).Footnote 9 As shown in Table A1 in the supplemental appendix, attributes across conditions were balanced.Footnote 10
We conducted the in-person and video interviews in the same room in the same office located in an off-campus building. Aside from the location of the interviewer (either on video or in-person), the interviewer-administered protocols were otherwise identical across conditions. The question wording, response options, and question order were identical between the in-person and video interviewer-administered modes and they repeated many of the questions asked in the online survey wave. The questions were primarily drawn from the ANES, including several questions that have been asked for many decades and thus are especially relevant for thinking about implications of mode shifts for comparability over time. Moreover, we have included items that have been scrutinized in previous research comparing ANES self-administered online samples and interviewer-administered in-person samples (e.g., Liu and Wang, Reference Liu and Wang2015, Abrajano and Alvarez, Reference Abrajano and Alvarez2018).
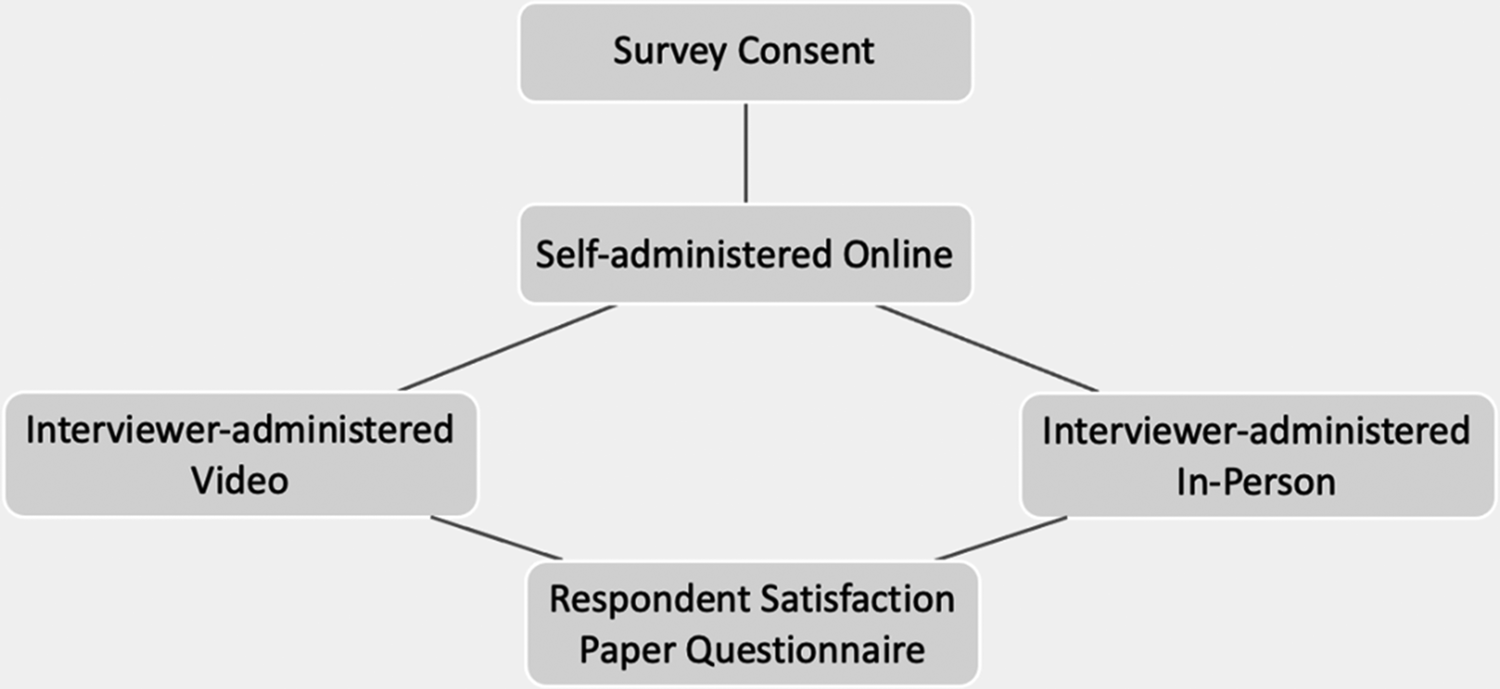
Video and audio from the in-person and video interviews were recorded, unless the subject opted out.Footnote 11 Immediately following the interviewer-administered survey wave, respondents were given a paper questionnaire about their survey experience, which was completed in private. We included this component of the study based on the well-documented relationship between a positive interview experience and data quality (see Frankel and Hillygus, Reference Frankel and Hillygus2014). In total, 157 individuals participated, with 78 randomly assigned to the video condition and 79 to the in-person condition. Figure 1 shows the study sequence.
Study design.

The strength of the lab design is that the experimental randomization offers internal validity to isolate mode effects. We randomly assign interview mode after respondents have been recruited and consented, thereby distinguishing the effect of mode from non-response or sample differences. The two-wave panel design allows for both between- and within-subject comparisons. The between-subject comparison tests for any differences between video and in-person interviewing. The within-subject compares responses to the same questions across survey waves, allowing comparison of the self-administered online mode with the interview-administered modes.
While the experimental design strengthens our ability to isolate mode effects, it has only limited ability to address the potential operational hurdles to implementing video interviews at scale, and some initial video experiences suggest that these hurdles are substantial (e.g., Schober et al., Reference Schober, Conrad, Hupp, Larsen, Ong and West2020; Guggenheim et al., Reference Guggenheim, Maisel, Howell, Amsbary, Brader, DeBell, Good and Hillygus2021; Okon et al., Reference Okon, Schober, Conrad, Hupp, Ong and Larsen2021). Video surveys involve significant scheduling and technological barriers, requiring troubleshooting of connectivity issues with the web-video software, the camera/video feed, and audio level among respondents with varying levels of technological sophistication and using an array of different devices. Depending on the survey population of interest, these logistical issues could compromise the feasibility of video interviewing. The on-the-ground experiences of pandemic-era researchers collecting data via video interviews provide initial insight into some of these operational issues (Guggenheim et al., Reference Guggenheim, Maisel, Howell, Amsbary, Brader, DeBell, Good and Hillygus2021; Hanson, Reference Hanson2021; Larsen et al., Reference Larsen, Hupp, Conrad, Schober, Ong, West and Wang2021), but the field lacks a systematic evaluation of potential mode effects. In our study, we minimize these operational hurdles by having respondents use university-provided technology and equipment and utilizing a research pool of willing participants, with the goal of precisely isolating mode effects.
Our study outcomes are several data quality metrics, including indicators of satisficing behaviors, social desirability, and participant satisfaction—all commonly used in previous mode studies (Heerwegh and Loosveldt, Reference Heerwegh and Loosveldt2008; Chang and Krosnick, Reference Chang and Krosnick2009, Reference Chang and Krosnick2010). The exact question wording and relevant coding decisions are reported in the supplemental appendix. Across these various indicators, we compare means between the interviewer-administered video mode and the interviewer-administered in-person mode.Footnote 12 As a robustness check for this between-subject comparison, we leverage the two-wave design to more precisely detect mode differences (see Clifford et al., Reference Clifford, Sheagley and Piston2021) by estimating a regression controlling for wave 1 responses in the self-administered online condition, the particular interviewer, and respondent demographics (age, gender, education, race/ethnicity). The within-in subject analysis compares means for the self-administered online mode to the in-person mode, the video mode, and the combined (in-person + video) cases.
3. Results: satisficing
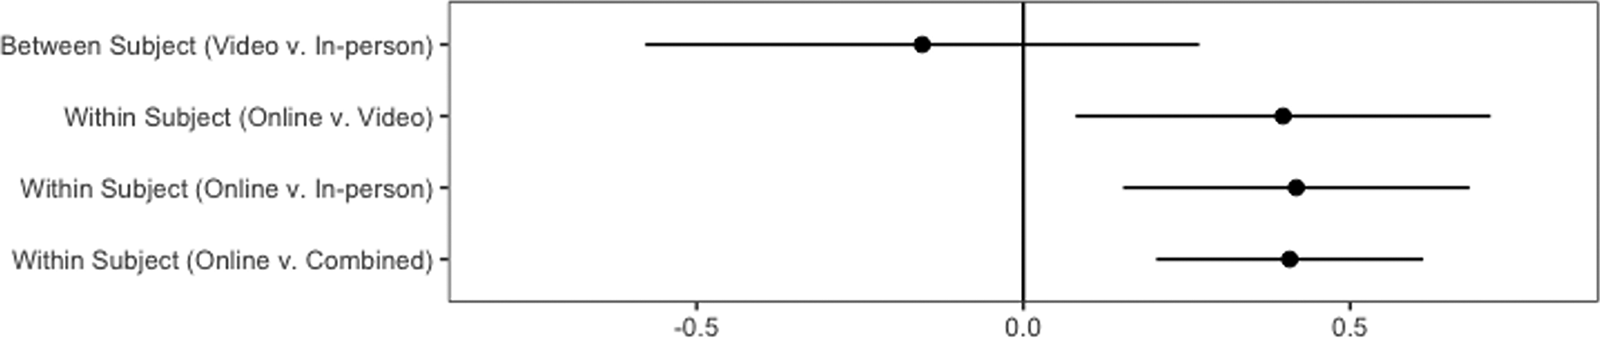
We begin by evaluating mode differences in indicators of survey satisficing—the extent to which respondents are thoughtfully engaging in the survey answering process. One measure of respondent engagement is the response length to an open-ended question, where longer answers are taken as an indication of a participants' engagement (Wenz, Reference Wenz2021).Footnote 13 We compare responses to the open-ended question, “What do you think are the most important problems facing this country?” Respondents volunteered an average of 2.5 issues in the online mode, compared to 2.8 in the video mode and 2.9 in the in-person mode.Footnote 14 As shown in Figure 2, the between-subjects difference in the average number of issues (0.15, p = 0.472) is not statistically significant. As reported in the supplemental appendix (Table A3), we find similar results with a robustness check that leverages the two-wave design to more precisely detect differences across the video and in-person interviews (see Clifford et al., Reference Clifford, Sheagley and Piston2021) by estimating a regression controlling for wave 1 responses in the self-administered online condition as well as interviewer and demographics. In sum, the video and in-person modes show similar levels of respondent engagement based on the length of responses to an open-ended question.
Mode differences in mean number of issues mentioned.
Note: Reported are the differences in the mean number of issues mentioned with 95 percent confidence intervals. Sample sizes for each condition are online = 156, video = 78, in-person = 79.

In contrast, the within-subject comparison across survey waves finds wordier responses on average in the interviewer-administered survey wave compared to the self-administered online wave. Overall, the average number of issues mentioned increased by nearly half an issue in the interview-administered surveys compared to the self-administered online survey (p = 0.015 for video mode, p = 0.002 for in-person mode, p < 0.001 for combined). Looking at the data another way, 41 percent of respondents increased the number of issues mentioned (whereas 20 percent mentioned fewer issues) in the interviewer-administered survey wave compared to the self-administered online wave. Thus, respondents give more thorough responses in response to an interviewer in either the video or in-person mode compared to answering the same question in a self-administered online mode.Footnote 15
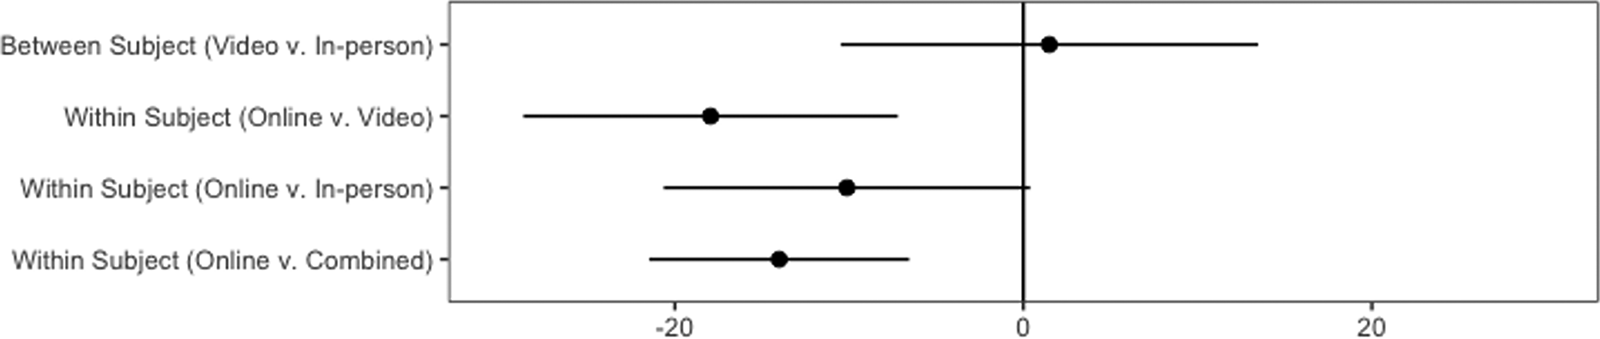
We next look at item non-response rates as another common metric of respondent engagement (Roberts et al., Reference Roberts, Allum and Eisner2019). We test for item non-response differences using 44 questions that were included in all of the questionnaires.Footnote 16 Respondents were flagged for item non-response if they skipped an item, gave a “don't know” response, or selected “haven't thought much about this” to one of the items that included this response option. Here again, the between-subject comparison finds comparable levels of item non-response between the video and in-person modes (17.9 percent in video; 16.5 percent in in-person; p = 0.806), as seen in Figure 3. As reported in Table A2, item non-response rates between these two interviewer-administered modes remain similar even when we improve the precision of our estimates in a regression controlling for an individual's item non-response rate in the self-administered online survey and other controls. The within-subject comparison, in contrast, finds significant differences between the self-administered online wave and the interviewer-administered wave. More respondents failed to answer one or more questions in the self-administered mode than the interviewer-administered modes (31.2 percent compared to 17.2 percent; p < 0.001). On this measure of satisficing, the interviewer-administered video mode again more closely approximates the interviewer-administered in-person mode than the self-administered online mode.
Mode differences in percentage flagged for item non-response.
Note: Reported are the differences in means across indicated modes with 95 percent confidence intervals. Samples sizes for each condition are online = 156, video = 78, in-person = 79.

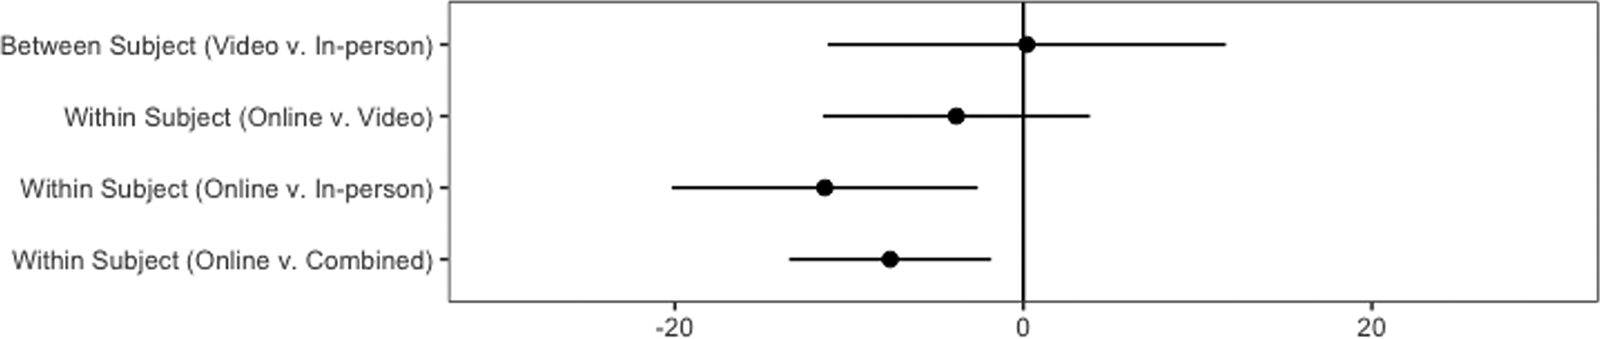
Our final measure of satisficing is non-differentiation or “straightlining,” in which respondents give identical responses on multiple, successive items, such as responding, “agree strongly” to back-to-back items in a series (Reuning and Plutzer, Reference Reuning and Plutzer2020). All questionnaires included four question batteries in which selecting the same response for all items could be viewed as incongruous or illogical—an American identity battery (four questions with four response options), an immigrant battery (three questions with five response options), a racial resentment battery (four questions with five response options), and feeling thermometers (six questions with a response scale from 0 to 100).Footnote 17 A between-subjects comparison of straightlining rates finds nearly identical levels of straightlining in the in-person (15.2 percent) and video (15.4 percent) modes, as shown in Figure 4. As with our other measures of satisficing, the straightlining rates between these two interviewer-administered modes remain comparable even when we improve the precision of our estimates in a regression controlling for an individual's item non-response rate in the self-administered online survey and other controls (reported in Table A2). As with our other measures, the within-subjects comparison finds significantly less straightlining in the interviewer-administered wave than the self-administered wave. Overall, 22.9 percent of respondents straightlined on at least one set of questions during the self-administered online wave, compared to 15.3 percent in the interviewer-administered modes, a difference that is statistically significant (p = 0.01).
Mode differences in percentage flagged for straightlining.
Note: Reported are the differences in means across indicated modes with 95 percent confidence intervals. Sample sizes for each condition are online = 156, video = 78, in-person = 79.

To summarize, across multiple measures of satisficing we find that the interviewer-administered video mode shares many of the data quality advantages associated with the interviewer-administered in-person mode compared to the self-administered online mode. We next evaluate the extent to which video interviewing might be impacted by one notable disadvantage of in-person interviewing—social desirability bias.
4. Results: social desirability bias
Our mode comparison focuses on items that have previously been shown to be susceptible to socially desirable responding: attitudes toward immigrants and immigration, racial resentment, and feeling thermometers (Liu and Wang, Reference Liu and Wang2015; Abrajano and Alvarez, Reference Abrajano and Alvarez2018; Carmines and Nassar, Reference Carmines and Nassar2021).Footnote 18
Prior research has documented different estimates using the exact ANES wording that we use in this study between the self-administered online and in-person samples in one or both years that the ANES collected data both online and through in-person interviews. Abrajano and Alvarez (Reference Abrajano and Alvarez2018) have previously documented significant differences in racial resentment between the online and in-person samples on the 2012 and 2016 ANES. They find higher levels of racial resentment on the self-administered online ANES sample compared to the in-person sample. While those analyses are suggestive of mode effects, they cannot rule out other factors such as sampling differences and unit non-response as contributors to the observed differences. We again do a between- and within-subject analysis to scrutinize possible mode differences.
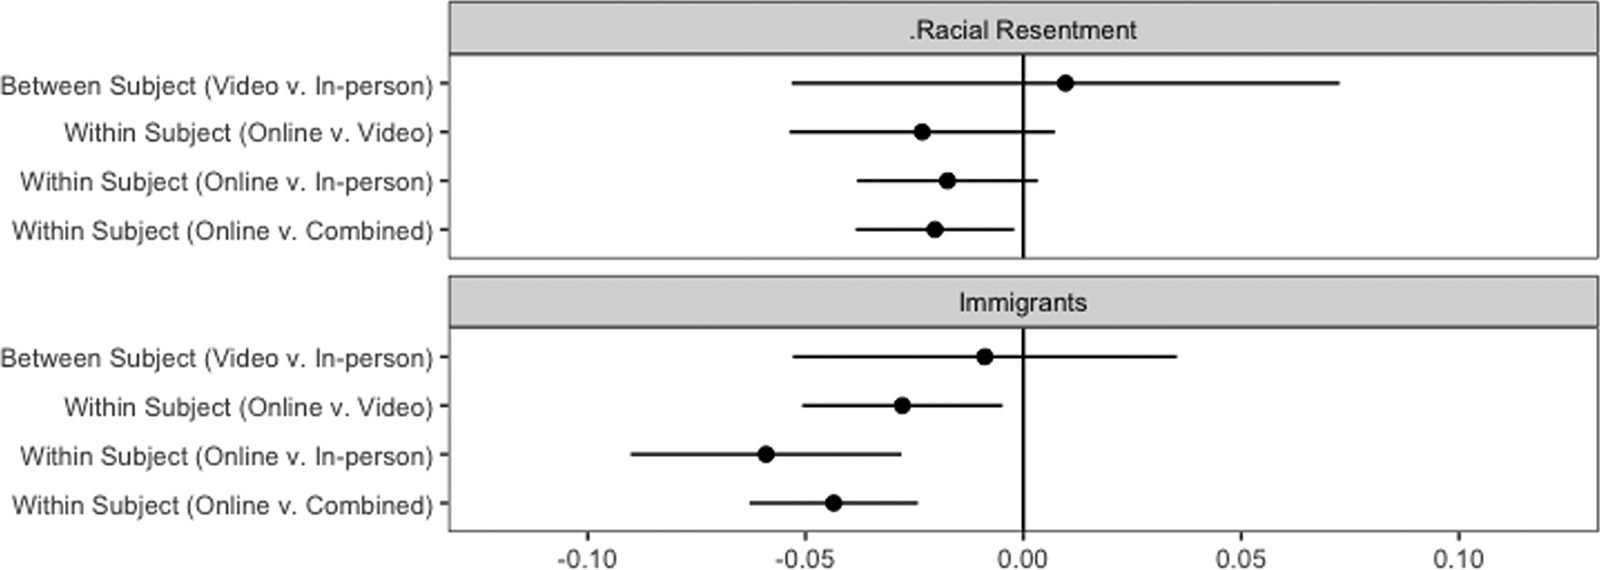
Responses were recoded from zero to one, where zero represents the lowest level of racial resentment and one represents the highest level, and then averaged to create an index ranging from zero to one. As shown in Figure 5, the between-subject comparison finds statistically insignificant differences in the levels of racial resentment between the video and in-person modes. This conclusion is robust to controlling for racial resentment responses in wave 1, demographics, and the assigned interviewer (full results in supplemental appendix Table A4). The within-subject analysis, by contrast, finds lower levels of racial resentment in the interviewer-administered modes compared to the self-administered online mode, the same pattern observed by Abrajano and Alvarez (Reference Abrajano and Alvarez2018). These within-subject differences are substantively small and statistically significant only when combining the video and in-person samples (−0.020, p = 0.029), although each of the interviewer-administered modes are in the expected direction. Looking at the data in another way, 39 percent of respondents gave a more socially desirable response in the interviewer administered wave compared to 22 percent moving in the other direction (and 39 percent remaining stable).
Mode differences in social desirability effects.
Note: Reported is the difference in means with 95 percent confidence intervals. Questions are recoded to range from 0 to 1, with larger values indicating more hostility toward the group. Samples sizes for each condition are online = 156, video = 78, in-person = 79.

We next look at responses to a three-item battery about immigrants in the United States, which instructed respondents to indicate their level of agreement or disagreement with three statements about immigrants. We recoded the responses from 0 to 1, where 0 represents the pro-immigrant response and 1 represents the anti-immigrant response. On immigration attitudes, the between-subject comparison finds similar immigration attitudes in the video and in-person modes; differences remain statistically insignificant when controlling for wave 1 responses, demographics, and the assigned interviewer (full results in supplemental appendix Table A4). In the within-subject comparison, we find that respondents report more negative immigration attitudes in the self-administered online mode than in either of the interviewer-administered modes, differences that are statistically significant for both the video and in-person modes, although they are again substantively small. Across both interviewer-administered modes, 36 percent of respondents changed their attitudes on immigration in the socially desirable direction between the self-administered online wave and the interviewer-administered wave, compared to 15 percent moving in the opposite direction (and 49 percent remaining stable).
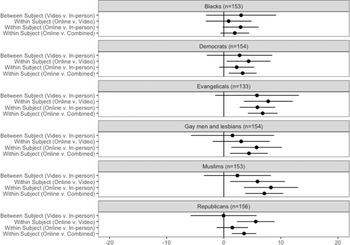
A final social desirability check is a comparison of feeling thermometers toward various groups. Previous comparisons of the ANES online and in-person samples have found more favorable evaluations in the interviewer-administered in-person mode compared to the online mode, but again these samples differ in ways other than mode alone (Liu and Wang, Reference Liu and Wang2015). Our experiment asked participants to rate the Democratic Party, the Republican Party, Evangelicals, Muslims, Blacks, and “gay men and lesbians” using the feeling thermometer ranging from 0 (unfavorable) to 100 (favorable) degrees.Footnote 19 These six groups were presented in the same order on both the self-administered and interviewer-administered modes.
As with the other measures, the between-subject comparison between the video and in-person modes finds no statistically significant differences in thermometer ratings for any of the evaluated groups, as seen in Figure 6. By contrast, the within-subject analysis finds that feeling thermometer ratings were higher (warmer) during the interviewer-administered modes than they were in self-administered online mode.Footnote 20 The differences are not always statistically significant—the average individual change in thermometer rating is significantly warmer for four of the six groups in the video condition, and all but one group in the combined interviewer-administered conditions.
Mode differences in feeling thermometer scores.
Note: Reported is the difference in means with 95 percent confidence intervals.

In sum, our results suggest that interviewer-administered video interviews can suffer from higher levels of social desirability bias than self-administered online surveys. The differences between the interviewer-administered modes and the self-administered modes are not always substantively large or statistically significant, but they are in a consistent direction across all measures evaluated.Footnote 21 While this is a potential downside of video interviewing that deserves further research, at the same time, these results yet again point to the comparability of video and in-person interviewing, so should be reassuring to those looking to transition an in-person time series project.
5. Results: participant satisfaction
Finally, in evaluating the comparability of video and in-person interviewing, we consider the survey experience across the modes. Survey methodology researchers consistently find that survey experience affects the quality of the responses given (e.g., Groves and Couper, Reference Groves and Couper2012). Equivalent experiences and satisfaction are important for both the quality of the data collected and participants' willingness to participate in future surveys. This might be especially important for panel designs, such as the ANES, in which cooperation with future re-interviews is needed. Participants in our study completed a paper questionnaire at the end of the study and each of our interviewers also answered a handful questions about their experience with the respondent as well.
The first question inquired about participant satisfaction with the interview experience. Overall, participants were quite satisfied with the interview experience and exhibited similar mean ratings of 2.6 for the video mode and 2.5 for the in-person mode on a 0–3-point scale, where 0 represents “not at all satisfied” and 3 represents “very satisfied.” A slightly higher percentage of respondents in the video mode (15.4 percent) reported they found themselves distracted during the video interview than during the in-person mode (11.4 percent); but the difference is not statistically significant (p = 0.466).
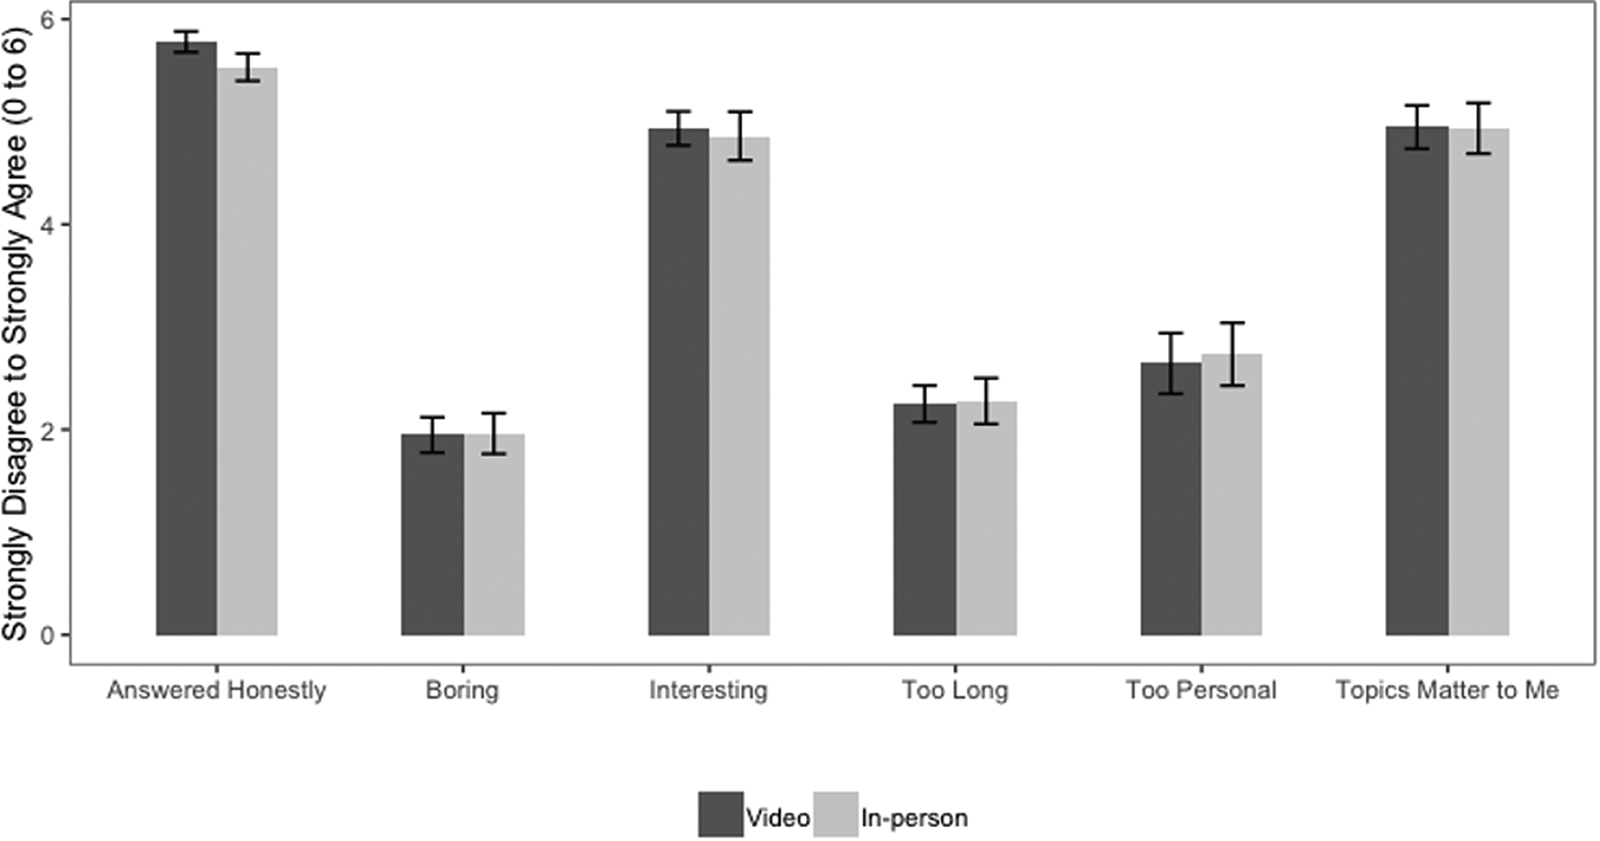
A Likert-type grid with six statements and six response options ranging from “strongly disagree” to “strongly agree” asked about length of the survey, interest in the subject matter, if particular questions were too personal, if the survey covered topics that matter to the participant, and if they answered the survey questions honestly. We display the mean responses to each of these items by survey mode in Figure 7. The only notable difference between conditions is on self-reported honesty, with respondents in the video condition expressing stronger agreement with the statement, “I answered the questions on this survey honestly.” The mean score for the video condition is 5.8 and the mean for the in-person condition is 5.5; the difference in means is statistically significant (p = 0.004).
Mean evaluation of interview experience.
Note: Responses are from a paper questionnaire completed by participants following their interviewer-administered interview. Sample size for each condition is video = 78, in-person = 79.Footnote 22

The interviewers also answered a few questions immediately after each interview. They rated how distracted, informed, and honest each participant seemed to them on four-point scales coded from “not at all” (1) to “very” (4). We find no meaningful differences between the interviewers' scores of respondents in the video and in-person interviews. The modal response was “not at all” distracted with equivalent means (1.2) in each condition. The interviewers also assessed similar levels of political knowledge among the participants in each mode (2.9 in each condition). Finally, the interviewers perceived participants in both the video and in-person conditions as providing honest responses (3.9 in video, and 3.8 in-person; p = 0.648).
6. Discussion
Large-scale in-person survey research has long been considered the “gold standard,” but has been facing dramatically increasing costs in recent years. Declining response rates necessitate more extensive fieldwork, increased respondent contacts, enhanced interviewer training, and higher incentive payments. These developments erode the cost effectiveness of in-person surveys. The COVID-19 pandemic represents a further threat to in-person interviewing. The mandated reductions in interpersonal contact and widespread fears of contamination have further challenged in-person interviews. As it becomes imperative for survey researchers to consider alternative approaches, it remains critical to evaluate data comparability and quality.
The results of our randomized mode experiment find promising similarities between video interviews and in-person interviews. Across multiple data quality metrics—non-differentiation, item non-response, and the depth of responses to open-ended questions—both interviewer-administered modes elicited higher quality data than self-administered online surveys from the same respondents and we observed minimal differences between video and in-person interviews, though confidence intervals for differences between video and in-person results were typically large. The consistency of these findings across multiple metrics affords greater confidence in the substantive conclusion that video resembles in-person interviewing more than it resembles self-administered online questionnaires. At the same time, video interviews do appear to share similar social desirability biases resulting from the presence of an interviewer, although the observed differences are sometimes substantively small or statistically insignificant.
Many of the differences we observed between in-person interviews and self-administered, online surveys are consistent with findings from earlier mode studies (e.g., see Hillygus et al., Reference Hillygus, Valentino, Vavreck, Barreto and Layman2017). These prior observational studies, however, were not able to isolate the effect of mode in the presence of sampling and non-response differences. Neither sampling differences nor non-response are plausible alternative explanations in this study since randomization occurred after recruitment to the study and no participants withdrew after assignment to the video or in-person mode.
While our results suggest that video interviews offer promise as an alternative to in-person surveys, we emphasize that our study represents only one piece of the necessary research to evaluate the potential of this mode. To maximize internal validity, we conducted this study in a controlled environment, with respondents in both the video condition and the in-person condition participating at a central, on-site location, which ensures that any possible differences between these modes reflects random assignment. Implementing video interviews at scale requires consideration of a large number of operational and logistical issues that could impact viability for some populations and projects (Schober et al., Reference Schober, Conrad, Hupp, Larsen, Ong and West2020). For example, video interviews will likely encounter connectivity and other technological hiccups when the onus of establishing communication between the interviewer and interviewee shifts from the research team (as was the case in this study) to each respective party. Experience and comfort with web-video technologies is not uniform (Schober, Reference Schober2018), which could impact which populations might be best suited to video interviewing. Additionally, video interviews must contend with distractions, scheduling issues, and coordination mishaps. These and other logistical demands require more extensive testing and research to identify best practices and to determine when and how video interviewing might be integrated into survey research.
It is also the case that any transition to a new mode also requires quantification of the quality and costs of the mode relative to alternatives (Ansolabehere and Schaffner, Reference Ansolabehere, Schaffner, Atkeson and Alvarez2018). Our study is not able to directly speak to cost differentials, unfortunately. The cost savings of video interviewing should come from the reduction of interviewer travel, housing, and salary while in the field (as well as the potential to reduce design effects by elimination of clusters typically used in in-person samples), but our study had fixed costs since the respondents traveled to the interview site. There are, of course, many other cost elements that remain unchanged: cost of sampling, programming, project management, staffing a help desk. Cost implications also require consideration of potential differences in response propensities—the experience of the 2020 ANES was that video interview requests yield lower response rates than in-person interviews (Guggenheim et al., Reference Guggenheim, Maisel, Howell, Amsbary, Brader, DeBell, Good and Hillygus2021). Given this, video interviewing could require larger respondent incentives to promote cooperation or more contact attempts. All of these are additional considerations that must be evaluated with future studies. Based on the experiences in the field thus far, it may be the case that the quality-cost trade-offs will be optimized in using video interviews in a mixed mode study that allows reduce costs for respondents with the ability and motivation to complete video interviewing. Given a population with access to high-speed Internet, video interviews could be used to collect as much data as possible, reducing the number of more expensive household visits that need to be made.
While there is a clear need for additional research, our analysis points to the potential of video interviews as an interviewer-administered mode with comparability to in-person interviewing on multiple data quality metrics, measures of social desirability, and participant satisfaction. The shared pros and cons between video and in-person interviews, along with the stark differences between self-administered, online surveys and both interviewer-administered modes, are important considerations for researchers evaluating a possible mode switch in a long-running time series.
Supplementary material
The supplementary material for this article can be found at https://doi.org/10.1017/psrm.2022.30
Acknowledgments
We thank our team of interviewers—Hannah Bartlebaugh, Martin DeWitt, and Apu Chakraborty—and the Social Science Research Institute at Duke University and the Odom Institute at UNC Chapel Hill for support during the data collection process. We are grateful for the feedback provided by the editor, anonymous reviewers, and participants at the 2019 American Association for Public Opinion Research conference.