Implications
The availability of methane monitoring techniques that are able to be applied at individual cow level is crucial to better monitor methane mitigation alternatives while improving the efficiency of livestock production. Although still under the evaluation in livestock systems, the Laser Methane Detector (LMD) has demonstrated its viability to be utilised in enteric methane monitoring in ruminants. This brings with it the potential to extend the LMD's application to farm-level assessment of methane emissions from animals managed under intensive production systems.
Introduction
Predominantly, enteric methane (CH4) is produced in the rumen (0.87) and in the large intestine (0.13) in a process called methanogenesis or biomethanation (Murray et al., Reference Murray, Bryant and Leng1976). Methanogenesis involves the conversion of feed material through the integrated activities of different microbial species including methanogenic archaea (Hobson et al., Reference Hobson, Mann and Stewart1981; Whitford et al., Reference Whitford, Teather and Forster2001). Enteric methane is a by-product of microbial digestion. In this process, acetate and butyrate are formed from the fermentation of carbohydrates and results in the production of hydrogen gas (H2). Methanogenic archaea use the hydrogen to reduce carbon dioxide (CO2; Hegarty Reference Hegarty1999; Moss et al., Reference Moss, Jouany and Newbold2000). The end result of this reaction is the production of CH4. Much of the CH4 produced is absorbed into the blood stream and excreted through the lungs (Blaxter and Joyce, Reference Blaxter and Joyce1963). Thus, about 97% of the total CH4 produced is excreted by breathing and eructation and only 3% through the flatus (Murray et al., Reference Murray, Bryant and Leng1976; Muñoz et al., Reference Muñoz, Yan, Wills, Murray and Gordon2012). At animal level, the production of enteric methane represents an energy loss, which can range from 0.02 to 0.12 of gross energy intake, varying with the type of diet fed (Johnson and Johnson Reference Johnson and Johnson1995; Ellis et al., Reference Ellis, Kebreab, Odongo, McBride, Okine and France2007).
Methane is a potent greenhouse gas (GHG). Like CO2 and nitrous oxide (N2O), CH4 has the capacity to raise earth's temperature through the absorption of long-wave radiation (Lovett et al., Reference Lovett, Stack, Lovell, Callan, Flynn, Hawkins and O'Mara2005). The Intergovernmental Panel for Climate Change (IPCC) has reported sharp increases in concentrations of GHG mainly because of human activities (IPCC, 2007). For example, the global atmospheric CH4 concentration increased between pre-industrial times and 2005, from ∼715 to 1774 ppb. The increase in CH4 has been due to anthropogenic activities, including agriculture (IPCC, 2007) and the role of livestock in methane emission has long been established (Food and Agriculture Organization (FAO), 2006). Quantification of CH4 in dairy cattle production is a subject of great interest because large emissions occur from enteric fermentation in cows and also from anaerobic storage of manures (Hensen et al., Reference Hensen, Groot, van der Bulk, Vermeulen, Olesen and Schelde2006). Together, enteric fermentation and manure represent 80% of agricultural methane emissions and about 30% to 40% of the total anthropogenic methane emissions (FAO, 2006). In dairy production, enteric CH4 accounts for 80% to 85% of the total CH4 production (Monteny et al., Reference Monteny, Bannink and Chadwick2006; IPCC, 2007).
Different methods are used to measure methane in livestock production systems. These include the use of respiration calorimetry chambers, isotopic techniques, tracer techniques (sulphur hexafluoride (SF6)) and mass balance/micro-meteorological techniques (Russell et al., Reference Russell, Barnett, Desilets and Bertrand2007). In the respirometer/calorimeter method, air is typically passed through a chamber containing one or more animals. The volume of gas passed through, and the inlet and outlet concentrations of oxygen, carbon dioxide and methane are usually measured (Kelly et al., Reference Kelly, Kerrigan, Milligan and McBride1994; Murray et al., Reference Murray, Moss, Lockyer and Jarvis1999). The tracer technique involves placing a permeation tube containing SF6 in the rumen with a known release rate, and measuring the amount of release of SF6 from the source over a period. The concentration of methane is calculated from the ratio of methane to SF6 in the expired breath of the test animals, factored by relative molecular weights of SF6 and methane, and the known SF6 release rate (Johnson et al., Reference Johnson, Huyler, Westberg, Lamb and Zimmerman1994; McGinn et al., Reference McGinn, Beauchemin, Iwaasa and McAllister2006). Mass balance and micro-meteorological techniques range from the use of aircraft to sample methane concentrations at different levels in the atmosphere, to paddock scale applications (Judd et al., Reference Judd, Kellier, Ulyatt, Lassey, Tate, Shelton, Harvey and Walker1999; Lassey et al., Reference Lassey, Gimson, Wratt, Brailsford and Bromley2000). All these techniques are effective and efficient at a controlled experimental level. However, their application at participatory and applied research level, which is usually carried out at commercial dairy farms, is very limited (Chagunda et al., Reference Chagunda, Ross and Roberts2009). The use of laser systems in methane detection in dairy cows is relatively recent. In one of the initial studies in this respect, Chagunda et al., (Reference Chagunda, Ross and Roberts2009) demonstrated that the use of the Laser Methane Detector (LMD) was feasible in dairy cows and that the data produced made biological sense in terms of feed intake, BW and feed type. Nonetheless, there is currently no review that has brought together the current state of knowledge on the use of the hand-held laser systems for methane measurement in dairy cattle. The objective of this review was to examine the application and relative efficiency of laser systems in dairy production, with a focus on opportunities and challenges in different livestock production systems. The current review concentrates on the use of the LMD and not the other laser systems such as the open-path laser techniques.
Breath as a measurement platform
In human medicine, clinicians have, for many years, used the odour of patients’ breath as a key to understanding metabolic processes and the dysfunction thereof (Tivey and Butler, Reference Tivey and Butler1999). This is because ∼35 of the identified compounds in the exhaled breath have been established as biomarkers for particular diseases and metabolic disorders (Wang and Sahay, Reference Wang and Sahay2009). According to Butler (Reference Butler1996), analytical methods to determine H2, CH4 and CO2 in human breath to monitor gastrointestinal function were first introduced in the 1960s. In dairy cattle, the most commonly used media for the surveillance of the health status are blood, milk and urine (Larsen and Nielsen, Reference Larsen and Nielsen2005). Breath analysis is steadily gaining ground in livestock production. This is because recent advances in different techniques have driven breath analysis to new heights, moving from laboratory research to commercial reality and providing a platform for cow-side methods to be used for semi-quantitative determination of the disease (Larsen and Nielsen, Reference Larsen and Nielsen2005; Wang and Sahay, Reference Wang and Sahay2009). One advantage of using breath analysis is the non-invasive and non-contact nature of the procedure. This makes breath analysis relatively simple to carry out and also very amenable to animal welfare requirements. Recent advances in high-sensitivity, high-selectivity laser spectroscopic techniques and laser sources have made it possible for real-time breath analysis (McCurdy et al., Reference McCurdy, Bakhirkin, Wysocki, Lewicki and Tittel2007; Sigrist et al., Reference Sigrist, Bartlome, Marinov, Rey, Vogler and Wachter2008). Many breath biomarkers have been detected by the laser-based techniques, and detection sensitivities are comparable with those from laboratory-based techniques. In livestock production, the use of breath-based techniques for methane detection has been limited and is mostly at experimental level. The following are examples of some of the breath-based techniques that have been recently reported in the literature. One of the initial studies on the use of laser systems in methane detection in dairy cows was reported in 2009 (Chagunda et al., Reference Chagunda, Ross and Roberts2009). In 2012, Garnsworthy et al. (Reference Garnsworthy, Craigon, Hernandez-Medrano and Saunders2012) reported a breath methane-sampling technique at 1 l/min via a polyvinyl chloride pipe with an inlet near the cow's nose. In another study, Larsen et al. (Reference Larsen, Lovendahl and Madsen2012) reported a technique using a portable Fourier transform IR gas analyser (GASMET 4030; Gasmet Technologies Oy, Helsinki, Finland). The instrument air inlet was placed in front of the cow's head in an automatic milk system. Apart from the above-described non-contact methods, Ross et al. (Reference Ross, Nath, Rooke, Duthie, Michie, Deans and Wills2012) reported a halter-mounted sensor system whose sampler is mounted above the nasal area. All these techniques demonstrate the feasibility of the use of breath-based techniques in measuring enteric methane production in livestock systems.
Use of laser technology in methane measurements
Traditionally, laser systems have been used for gas detection in air-quality monitoring, environmental control, health care and security. Laser methane detection systems have gained special focus not only because of their importance for safety reasons in commercial and domestic environments, but also because of the role that methane plays in climate change (Cong et al., Reference Cong, Guo and Wang2011). The LMD uses the second-harmonic detection of wavelength modulation spectroscopy to perform highly sensitive IR absorption measurements (Iseki and Miyaji, Reference Iseki and Miyaji2003). This is because methane has two strong absorption bands, or groups of absorption lines, centred at 3.3 μm (ν3 band) and 7.6 μm (ν4 band). However, for cost-effectiveness, most laser-based devices use a near-IR diode laser. The available laser wavelength for the near-IR diode is limited, lower than 2.2 μm. Below 2.2 μm, the strongest absorption band of methane is located at 1.64 to 1.70 μm (2ν3 band; Bobin 1972; Iseki and Miyaji, Reference Iseki and Miyaji2003). Although over one order of magnitude weaker, this coincides with the single-mode, single-frequency emission wavelength of indium gallium arsenide (InGaAs)-distributed feedback (DFB) laser diode (Temkin, Reference Temkin1990; Iseki and Miyaji, Reference Iseki and Miyaji2003; van Well et al., Reference van Well, Murray, Hodgkinson, Pride, Strzoda, Gibson and Padgett2005). The InGaAs diode lasers can readily be tuned by changing their temperature and drive current (van Well et al., Reference van Well, Murray, Hodgkinson, Pride, Strzoda, Gibson and Padgett2005). This enables their application in hand-held optical instruments to be capable of measuring methane at a range of several metres without compromising the expected sensitivity for such measurements. Further, this line is suitable for methane detection as it is one of the strongest absorption lines in the 2ν3 band and is free from absorption of atmospheric interference gases (Iseki and Miyaji, Reference Iseki and Miyaji2003). Remote detection of methane with this line using an InGaAsP-DFB laser was reported previously (Uehara and Tai, Reference Uehara and Tai1992). In frequency modulation spectroscopy, laser frequency is modulated at frequency (f) and photodetector output is processed by phase-sensitive detection with reference to fundamental (f), second harmonic (2f) or higher harmonics (Iseki et al., Reference Iseki, Tai and Kimura2000).
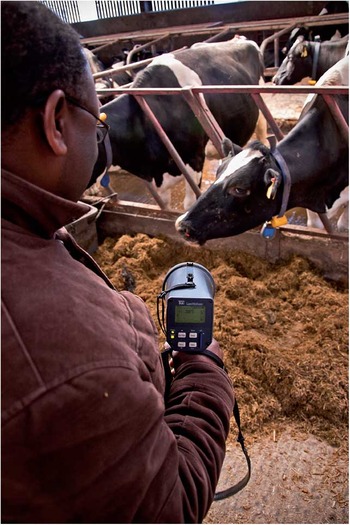
The LMD is a hand-held proprietary gas detector for remote measurements of column density for heterogeneous gas plumes containing methane (Tokyo Gas Engineering). Gas column density was measured by directing the auxiliary LMD using a visible helium–neon laser beam at the point source (Figure 1). As detailed by Chagunda et al. (Reference Chagunda, Ross and Roberts2009), the LMD equipment is based on IR absorption spectroscopy, using a semiconductor laser as a collimated excitation source and using the second harmonic detection of wavelength modulation spectroscopy to establish a methane concentration measurement. The integrated concentration of methane between the equipment and the target point is then displayed. The measured value is expressed as methane concentration while accounting for the thickness of any methane plume. Hence, the measurements are in parts per million-metre (ppm-m). The equipment operates normally in the temperature range between 0°C and 40°C, in the humidity range of 20% to 90% and conforms to European standards (EN) 61000-6-4: 20011 and EN 61000-6-2:1999. The laser has the safety rating of IEC 60825-1 (JISC 6802). With a reaction time of 0.1 s, the LMD also works through glass. The LMD has been widely used in detection applications such as gas transmission networks, landfill sites and other areas where methane leakage or build-up is a risk (Crowncon, 2006).
A demonstration on the use of the Laser Methane Detector in livestock. Picture: A. Ross.

Application of LMD in livestock production
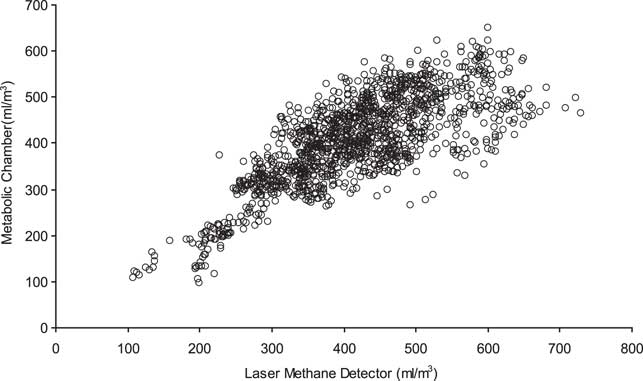
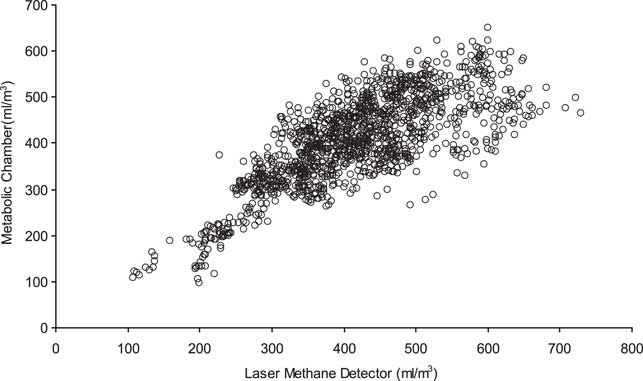
Previous studies have demonstrated a relatively strong agreement between CH4 measurements from the LMD with those recorded in the indirect open-circuit respiration calorimetric chamber. To date, the calorimetric chamber is considered as the gold standard method for CH4 measurements in ruminants. In a study with dairy cattle, Chagunda and Yan (Reference Chagunda and Yan2011) demonstrated a strong level of agreement between measurements from the LMD and the indirect open-circuit respiration calorimetric chamber (Figure 2). This was exemplified by a high and positive correlation coefficient (r = 0.8, P < 0.001).
Relationship between measurements from the Laser Methane Detector and from the open-circuit indirect calorimetric chamber. Source: Chagunda and Yan (Reference Chagunda and Yan2011).
The LMD was also assessed with cattle and sheep within an open-circuit respiration chamber. Using a threshold value of 75% quantile for chamber and LMD outputs, values of sensitivity of 95.4% and 93.4% and specificity of 96.5% and 78.7% were reported for cows and sheep, respectively (Chagunda et al., Reference Chagunda, Ross, Rooke, Yan and Roberts2012). This meant that the LMD was able to detect periods of high methane concentration (sensitivity) at least 94% of the time and was able to avoid misclassifying periods of low methane concentration as high concentrations (specificity) at least 79% of the time.
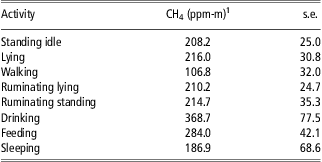
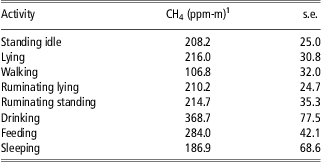
In a study that was aimed at determining the effect of the cow's activity on enteric CH4 production in dairy cattle, Chagunda et al. (Reference Chagunda, Bagnall, Bell and Roberts2011) demonstrated the ability of the LMD to segregate the concentration of CH4 produced by dairy cows performing different physiological activities (Table 1).
Least square means and standard errors of methane concentration (CH4, ppm-m) for measured with the Laser Methane Detector from cows performing different spontaneous activities over the day
ppm-m = parts per million-metre.
1The measured value is expressed as methane concentration, while accounting for the thickness of any methane plume, and hence ppm-m.
Source: Chagunda et al. (Reference Chagunda, Bagnall, Bell and Roberts2011).
From the results, Chagunda et al. (Reference Chagunda, Bagnall, Bell and Roberts2011) showed that cow activity had highly significant effect (P < 0.001) on enteric methane production from dairy cows. Measurements taken when the cows were either walking or sleeping were the lowest, whereas measurements taken when the cows were eating and drinking were the highest. During drinking, the cows produced the highest concentration of methane (least squares mean (LSmean) = 368.7 ppm, s.e.m. = 77.5), whereas the lowest concentration of methane was recorded when the cows were just walking in the shed (LSmean =106.2 ppm, s.e.m. = 32.0). Biomechanical movements of the alimentary system during activities such as eating and drinking may be responsible for triggering fluxes of methane from the rumen, and hence creating high results within cow variability in the data. This may also be demonstrated by the moderately high methane measurements during lying, ruminating standing and ruminating lying.
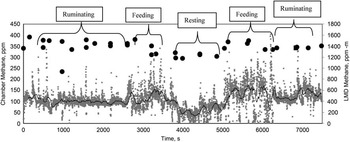
Methane emissions from animals are not constant over the day, and a rather temporal pattern has been observed in response to the microbial activity and the dynamics of the fermentation process of the feedstuff throughout the digestive tract (Phillipson, Reference Phillipson1982). Figure 3 presents an example of a profile from an individual cow (Chagunda et al., Reference Chagunda, Ross, Rooke, Yan and Roberts2012). The profile shows the individual time series records measured every 0.5 s in 5-min windows measured every 30 min and the rolling average (black line). In the profile, there was a noticeable change in the CH4 concentrations when the animal was involved in different physiological activities. Concentrations were stable when the cow was resting and rose when the cow was feeding. These data demonstrate the need to account for the physiological activities of the animals in any estimates of daily methane production for individual cows. The profile also indicated that, although the absolute values were not the same, the trend of the measurements from the LMD and the metabolic chamber was similar.
Profile of methane measurements, for example, a cow in a metabolic chamber (solid dot) on the primary axis and Laser Methane Detector (grey dots with a rolling average for every 4 min) on the secondary axis. Source: Chagunda et al. (Reference Chagunda, Ross, Rooke, Yan and Roberts2012).

Opportunities offered by the LMD for methane monitoring in ruminants
Following are some characteristics of the LMD that make it particularly advantageous to use in livestock systems. The hand-held and portable LMD offers several operational advantages over the traditional enteric CH4 measurement techniques. Compared with traditional techniques, the LMD has the particularity to have molecular selectiveness. Molecular selectivity is an important characteristic for gas detection systems. The LMD is designed to detect methane within a mix of other gases with high specificity (Iseki et al., Reference Iseki, Tai and Kimura2000). This is a crucial feature for its application in enteric methane detection in livestock systems, owing to the nature of the animal's environment where many by-products of both aerobic and anaerobic processes are generated.
In livestock production systems, remote enteric CH4 detection is desired because it enables such measurements to be taken without disturbing the animals from exhibiting their normal behaviour (Chagunda et al., Reference Chagunda, Ross and Roberts2009). The LMD is non-invasive and non-contact technique. This is important for both the animals’ welfare and the safety of the experimenter.
Another advantage is that it is based on a spectroscopic method characterised for a fast response. Traditional laboratory-based techniques such as gas chromatography are not rapid. This characteristic enables real-time measurements that are important in production systems. Reflecting on the initial purpose of the LMD, detecting CH4 concentration in time safely and reliably has an important effect on gas measurements (Cong et al., Reference Cong, Guo and Wang2011), and this characteristic is equally important for enteric CH4 measurement in livestock.
Being a portable piece of equipment, the LMD has the advantage of being relatively easily transported to different locations and circumstances. This brings with it the opportunity to measure methane at the farm scale. Enteric methane production is normally reported per day or per unit of the product produced. Although the application of the LMD in ruminants uses a spot breath sample, Chagunda et al. (Reference Chagunda, Ross and Roberts2009) demonstrated the possibility of calculating total emissions (g/day). Further, the LMD used a Nickel metal hydrate battery, which lasted more than 60 min on full charge.
Challenges in the use of the LMD for methane monitoring in ruminants
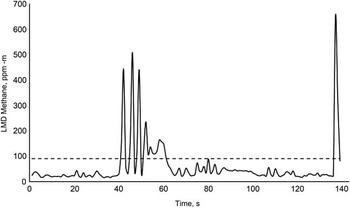
One challenge with the use of the LMD comes from the fact that with the LMD there is no gas sample that is collected. The analysis is based on real-time breath analysis. With this comes the natural fluctuations that arise because of the biomechanics of breathing and the normal fluctuations in the measurement device. This is demonstrated in Figure 3. Owing to the cyclic nature of the respiratory tidal cycle, there are peaks and troughs in the data. This raises the question of which statistic would represent the individual cow's point measurement. In order to get a true representation of the point measurement over each exhalation–inhalation cycle, the average of the peaks from each cycle were used to determine the enteric methane output of the individual cows (Chagunda et al., Reference Chagunda, Ross and Roberts2009). Apart from normal breath cycles, there are also some sporadic episodes of high CH4 concentration. These episodes are speculated to be episodes of eructation. In order to separate the eructation episodes from the normal breath cycles, the use of a threshold value to separate the two is currently being tested. A value of one standard deviation (s.d.) of each observation period for each individual cow was set as a threshold to discriminate between eructation and respiration. This threshold approach is shown in an example in Figure 4.
Profile of Laser Methane Detector (LMD) methane measurements, for example, a cow indicating a threshold value of one standard deviation (s.d.) mark (dotted line), and hence dividing the breath sample into breathing (below 1 s.d.) and eructation (above 1 s.d.) (own data).

As has been demonstrated in Figure 4, the other challenge of dealing with breath data is that, apart from the normal breath cycles, there are also the mini peaks and mini troughs. To date, it has not been established whether these are fluctuations that are either part of the inhale–exhale cycle or equipment fluctuations. However, from a biological point of view, the important thing is to be able to capture the breath cycle from which the maximum recorded concentration (average of the peaks) can be extracted. The fluctuations within a complete breath cycle can be accommodated out using a rolling average or any other data-smoothing method.
Other challenges on the use of this device relate to its application in grazing environment. From a study on the effects of micrometeorological factors affecting LMD measurements under simulated grazing conditions, Teeranavattanakul (Reference Teeranavattanakul2010) found that wind speed, relative humidity, pressure and wind direction had significant effects on the resultant concentration of CH4 (P < 0.001). Ambient temperature did not have any significant influence on the CH4 measurements. When CH4 measurements were taken when the LMD faced the direction from which the wind was blowing, the average recorded measurements were lower than when the LMD was not facing against the wind direction. Mean methane measurements during head winds were 17.5 (s.e. = 0.03) ppm-m compared with 19.0 (s.e. = 0.06) ppm-m when the wind was side wards (north and south) and 19.4 (s.e. = 0.08) ppm-m during tail winds (north-west and south-west). The wind direction was another factor that had a significant impact on CH4 measurements. Teeranavattanakul (Reference Teeranavattanakul2010) reported that wind speed had a negative relationship with methane measurement (r = −0.41, P < 0.001). This relationship demonstrated that, as wind speed increased, methane measurements decreased. These results confirmed that CH4 emissions measured by LMD are sensitive to some ambient conditions, and hence need to be accounted for and integrate ambient condition statistics to derive flux values.
The use of the LMD technique is relatively novel in ruminant livestock systems. Although the LMD has shown some potential in its application for enteric methane measurement, extensive studies to determine the repeatability of the measurements in different production systems and species are still required. As an example, to the best of our knowledge, there has not yet been any peer-reviewed published work based on measurements in beef, goats and sheep. Such studies would not only help mitigate one of the inherent drawbacks of new techniques in defining new phenotypes, but also help generate useful data from the other species.
Conclusions
Despite the challenges that have been associated with the use of the LMD, the technique has the potential to be utilised as an alternative method in enteric methane measurements in ruminants. With further validation, the LMD has the potential to provide a reliable method to estimate daily methane output from ruminants, and hence provide useful decision support information in ruminant GHG mitigation strategies. Methane measurements are required to quantify emission factors in order to improve the accuracy of present methane inventories, as well as to evaluate the effectiveness of mitigation strategies for reducing methane emission from the dairy industry. Breath analysis using laser spectroscopic techniques is only a very recent advancement. Developments in the next generation of hand-held diode lasers may lead to even more robust alternative techniques for detecting enteric methane from ruminants.
Acknowledgements
The author greatly appreciates the assistance and contribution from Mrs Patricia Ricci, Mrs Nicola Boyes and Dr Dave Roberts during the preparation of the manuscript. He also thanks Mr Dave Ross for introducing him to the Laser Methane Detector, and the anonymous reviewers and Guest Editor of Animal for their constructive comments. SRUC receives funding from the Scottish Government.
This paper was published as part of a supplement to animal, publication of which was supported by the Greenhouse Gases & Animal Agriculture Conference 2013. The papers included in this supplement were invited by the Guest Editors and have undergone the standard journal formal review process. They may be cited. The Guest Editors appointed to this supplement are R. J. Dewhurst, D. R. Chadwick, E. Charmley, N. M. Holden, D. A. Kenny, G. Lanigan, D. Moran, C. J. Newbold, P. O'Kiely, and T. Yan. The Guest Editors declare no conflict of interest.