1 Introduction
The theory of equalizing differences predicts that under competitive market conditions workers trade pay for benefits such as pensions, but empirical confirmation of such tradeoffs is rare. Smith and Ehrenberg (Reference Smith, Ehrenberg and Jack1983) and Currie and Madrian (Reference Currie, Madrian, Orley and David1999) attribute the lack of empirical confirmation of the theory to weak proxies for employee ability and to datasets that lack individual-level pay and pension values. Both of these empirical problems can produce an underestimate of the tradeoff, consistent with the insignificant or sometimes even positive correlation between pay and pensions often found in prior research.Footnote 1
This study investigates the extent to which chief executive officers (CEOs) of public companies trade pay for pensions. CEOs provide an interesting setting to investigate the tradeoff hypothesis for two reasons. First, if a CEO's ability is correlated with firm characteristics, such as size and growth opportunities, then better proxies for ability are available for CEOs than for rank and file employees. Second, the Securities and Exchange Commission (SEC) requires publicly traded companies to disclose in public filings individual-level data on the pay and pensions they provide to their top executives.
In what follows, I examine a sample of S&P 500 CEOs in office during fiscal 2005, and I find that CEOs do trade pay for pension benefits. Each additional dollar of pension benefits is associated with a 48 cent decrease in pay, where the latter is measured as the sum of cash compensation and equity grants. Although tradeoff estimates are statistically different from zero, they are also smaller than the anticipated dollar-for-dollar rate. Furthermore, CEO pension grants do not appear to be driven by incentives or taxes, implying that the less than dollar-for-dollar tradeoff estimates are not the result of pension grants leading to increased productivity or tax savings.
A potential reason for the less than anticipated tradeoff estimates is that some CEOs enjoy market power when negotiating their compensation packages, thereby violating the assumption of competitive market conditions that underlies the dollar-for-dollar prediction. Consistent with this reason, I find that that the implicit price of pension benefits decreases with the CEO's bargaining power over the board of directors. Hence, pooling CEOs with varying degrees of bargaining power leads to tradeoff estimates that are less than dollar-for-dollar.
This study contributes to the pay–pension tradeoff literature by showing that prior inconclusive results are driven by weak proxies for innate ability and aggregated pay and pension data. It extends the literature on CEO compensation by finding a negative association between pensions and pay. This negative association implies that comparisons of CEO compensation levels should include pension benefits. Finally, the study contributes to the corporate governance literature by demonstrating a mechanism through which bargaining power over the board of directors influences CEO compensation contracts.
2 Pay–pension tradeoff
The theory of equalizing differences assumes that, under competitive market conditions, workers of similar productivity and ability receive equal total compensation but possess heterogeneous preferences for pay and benefits. Workers therefore sort themselves across job offers so that their preferences match the pay–benefit bundles offered by firms. As Brown (Reference Brown1980) and Rosen (Reference Rosen and Orley1986) discuss, this sorting leads to a predicted dollar-for-dollar tradeoff between pay and benefits such as pensions.
Although the theory of equalizing differences has been in the literature since Adam Smith (Reference Smith1776), empirical support for pay–pension tradeoffs has been limited. Studies typically find an insignificant association between pay and pensions, and they rarely find estimates that are close to dollar-for-dollar. Therefore, the literature focuses on finding negative associations between pensions and pay. Although some studies such as Gunderson et al. (Reference Gunderson, Hyatt and Pesando1992) and Montgomery et al. (Reference Montgomery, Shaw and Benedict1992) find negative and significant associations, others such as Gustman and Steinmeier (Reference Gustman and Steinmeier1987) and Even and Macpherson (Reference Even and Macpherson1990) find significant positive associations.
Smith and Ehrenberg (Reference Smith, Ehrenberg and Jack1983) and Currie and Madrian (Reference Currie, Madrian, Orley and David1999) discuss two common explanations for the conflicting evidence of pay–benefit tradeoffs. The first explanation is that poor proxies for worker ability lead to omitted correlated variable biases in tradeoff estimates, because more able workers receive both higher pay and higher pension benefits. The second explanation is that datasets often lack individual-level expenditures on pay and pensions, forcing researchers to aggregate pay and benefits at the firm level. This aggregation tends to reduce the statistical power of tests and exacerbate omitted correlated variable biases because the datasets lack individual-level measures of ability. Although Gunderson et al. (Reference Gunderson, Hyatt and Pesando1992) and Montgomery et al. (Reference Montgomery, Shaw and Benedict1992) address these two issues and have some success in finding tradeoffs between pay and pensions, their results are sensitive to model specifications.
There are, however, two economic reasons why tradeoffs can be less than dollar-for-dollar. First, if pensions provide workers with incentives that increase productivity, then the cost to the firm of providing a dollar of pension benefits may be less than a dollar (for a discussion see Dorsey et al. Reference Dorsey, Cornwell and Macpherson1998). Firms may therefore offer employees less than dollar-for-dollar tradeoffs to induce employees to accept productivity improving pensions. Second, as discussed by Scholes et al. (Reference Scholes, Wolfson, Erickson, Maydew and Shevlin2002), if pensions receive beneficial tax treatment, then firms may be willing to offer employees a less than dollar-for-dollar tradeoff.
3 Sample and empirical measures
The construction of the sample starts with CEOs of firms on the S&P 500 Index in 2005. To calculate pension benefits, I require that the CEO remained in office for both fiscal 2004 and 2005. I then remove four CEOs who receive unusually low pay and no pension benefits.Footnote 2 I gather pay, age, and tenure data from the ExecuComp database. Accounting data come from the Compustat database and stock return data from the CRSP database. Data requirements lead to a final sample of 442 CEOs.
To measure pay, I sum salary, bonus, long-term incentive plan payments, all other compensation (severance, debt forgiveness, insurance premiums, matches to defined contribution plans …), stock option grants, and restricted stock grants. Stock option and restricted stock grants typically include time-based vesting provisions that can limit their role as current compensation. I include them, however, in the pay measure because Ofek and Yermack (Reference Ofek and Yermack2000) find that CEOs sell unrestricted shares upon receipt of stock option and restricted stock grants, implying that equity grants lead to concurrent increases in unrestricted wealth.
To estimate the value of stock option grants, I use the Black–Scholes model. Four of the six model inputs I gather from the ExecuComp database: the number of options granted; the stock price on grant date; the exercise price; the time to maturity. I estimate volatility as the standard deviation of daily returns for the last 120 trading days for the prior fiscal year, and I estimate the dividend yield as cash dividends paid divided by fiscal year end stock price. To estimate the risk-free rate, I use the US Treasury bond yield associated with the option's time to maturity. Restricted stock grants are valued as the number of shares times the stock price at grant date.
For CEOs who receive pension benefits, I hand collect from their firms' proxy statements the estimated defined benefit pension payments to be made in retirement and the age at which pension payments commence. I use these inputs to estimate the total value of accrued pension benefits and the annual accrual of pension benefits for an additional year of work using the methodology described by Sundaram and Yermack (Reference Sundaram and Yermack2007) and Gerakos (Reference Gerakos2008). When estimating pension benefits, I exclude any defined contribution pensions because their value is reflected in the pay measure, either directly because salary and bonus reflect pre-deferral amounts or in all other compensation, which includes employer matches for defined contribution plans. Appendix A describes the method used to estimate pension benefits.
I collect age and tenure because Core et al. (Reference Core, Holthausen and Larcker1999) and Sundaram and Yermack (Reference Sundaram and Yermack2007) find that age and tenure can affect CEO pay and pensions. In addition, I hand collect from public filings, data on whether the CEO chairs the board of directors. A combined CEO chair position can affect total compensation, because chairing the board of directors requires additional effort on the part of the CEO and should therefore be associated with a higher total compensation.
To proxy for a CEO's ability, I calculate measures of firm size and growth opportunities. As discussed by Smith and Watts (Reference Smith and Watts1992) and Baker and Hall (Reference Baker and Hall2004), I assume that larger firms hire more able CEOs with higher equilibrium compensation, because differences in the CEO's marginal product reverberate through the organization. To proxy for firm size, I calculate the natural logarithm of the firm's annual sales. As discussed by Smith and Watts (Reference Smith and Watts1992), I assume that firms with greater growth opportunities hire more able CEOs with higher equilibrium compensation, because the marginal product of their investment decisions is greater. To proxy for the firm's growth opportunities, I estimate the firm's market to book ratio, which is the ratio of the market value of assets to the book value of assets.
Because the CEO's ability can be correlated with firm performance and CEO pay is often performance-based, I create two performance proxies. The first is the accounting return on assets, which is calculated as the ratio of income before extraordinary items to the book value of assets. Return on assets is often used as a performance measure in annual bonus plans and long-term incentive plans. The second proxy for performance is the annual return inclusive of dividends on the firm's common equity, which represents the firm's overall performance for shareholders.
Firm risk can be associated with higher levels of total compensation for two reasons. First, risk aversion may lead CEOs of riskier firms to demand premiums for performance-based pay. Second, risk can represent uncertainty in the firm's operating environment. Firms that operate in uncertain environments may require higher quality CEOs who demand higher equilibrium compensation. To control for firm risk, I create two measures. First, I calculate the standard deviation of the return on assets for the current and prior four fiscal years. Second, I estimate the volatility of the return on the firm's common equity, calculated as the standard deviation of daily returns for the last 120 trading days of the prior fiscal year.
Finally, industry factors such as competition and specific labor markets can affect pay and benefit levels. Therefore, I create 15 indicators for industry membership using the classifications discussed by Barth et al. (Reference Barth, Beaver and Landsman1998).
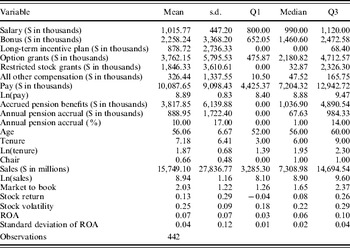
Table 1 presents descriptive statistics for the sample. Accrued pension benefits and annual pension accruals are similar in magnitude to those reported by Sundaram and Yermack (Reference Sundaram and Yermack2007) who find, for a smaller sample of large capitalization firms, that mean accrued pension benefits total $4.5 million. The lower mean for this study's sample, $3.8 million, is driven by the inclusion of smaller firms. I find that the mean annual pension accrual as a percentage of pay is 10%, which is similar in magnitude to the 10% found by Sundaram and Yermack (Reference Sundaram and Yermack2007). Remaining variables are similar to those reported in the earlier study.
Descriptive statistics
This table presents descriptive statistics for S&P 500 CEOs who are in office for both fiscal 2004 and fiscal 2005. Flow variables are for fiscal 2005 and level variables are measured as of fiscal year end 2005. Compensation-related variables are denominated in thousands of dollars. Salary, bonus, long-term incentive plan, restricted grants, and all other compensation are taken directly from the ExecuComp database. To estimate the value of stock option grants, I use the Black–Scholes model. Four of the six model inputs I gather from the ExecuComp database: the number of options granted; the stock price on grant date; the exercise price; the time to maturity. I estimate volatility as the standard deviation of daily returns for the last 120 trading days for the prior fiscal year. I estimate the dividend yield as cash dividends paid divided by fiscal year end stock price. To estimate the risk-free rate I use the US Treasury bond yield associated with the option's time to maturity. Restricted stock grants are the number of shares times the grant date stock price. Pay is the sum of salary, bonus, long-term incentive plan, all other compensation, stock option grants, and restricted stock grants. Methods used to estimate pension benefits are discussed in Sundardam and Yermack (Reference Sundaram and Yermack2007) and Gerakos (Reference Gerakos2008). Accrued pension benefits is the present value of accrued pension benefits as of fiscal year end 2005. Annual pension accrual ($) is the change in the value of accrued pension benefits in fiscal 2005. Annual pension accrual (%) is the change in the value of accrued pension benefits divided by pay. Chair is an indicator variable for whether the CEO chairs the board of directors. Accounting data are taken from the Compustat database and stock return data are taken from the CRSP database. Sales is the total sales for the fiscal year (CS#12). Market to book is the ratio of the market value to the book value of assets as of fiscal year end ((CS#25*CS#199+CS#181)/CS#6)). Annual stock return is the continuously compounded return on common stock for the fiscal year. Stock volatility is the annualized standard deviation of daily stock returns for the last 120 trading days for the prior fiscal year. ROA is the ratio of income before extraordinary items to the book value of assets (CS#18/CS#6). Standard deviation of ROA is the standard deviation for the five years starting in 2005.

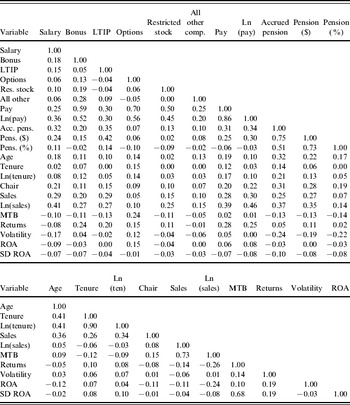
Table 2 presents univariate Pearson correlations for the empirical measures. Consistent with proxying for the CEO's ability, the natural logarithm of sales, chair, returns, and return volatility are all positively and significantly associated with pay. Although the correlation between pay and the firm's market to book ratio is also positive, it is not statistically significant.
Correlations
This table presents Pearson product-moment correlations between the empirical measures. Correlations greater than 0.08 in absolute value are significant at the 0.10 level (two-sided). Variables are described in Table 1.

Annual pension accrual as a percentage of pay is positively associated with salary and long-term incentive plans, but it is negatively associated with option and restricted stock grants. It is also negatively associated with the firm's growth opportunities (market to book ratio) and noise in the firm's operating environment (volatility of returns and the standard deviation of the return on assets). Consistent with the hypothesis of equalizing differences, the annual pension accrual as a percentage of pay is negatively associated with pay (−0.06), but the association is not significantly different from zero at the 0.10 level. It is, however, negatively and significantly associated with stock option and restricted stock grants (−0.10 and −0.09).
4 Estimation method and results
There are two approaches to estimate the rate at which CEOs trade pay for pension benefits. A cross-sectional approach assumes that the CEO's total remuneration (pay and pension benefits) for the period equals the value of the CEO's marginal product for that period. This approach requires data for only a single period. An alternative approach is to estimate pay and benefits over the CEO's entire working career, under the assumption that total career remuneration is equal to the career value of the marginal product. But CEOs in the US have short tenures (on average six to seven years). Furthermore, total remuneration jumps sharply on becoming a CEO, making it difficult to compare pre-CEO remuneration with pay and benefits received while CEO. I therefore use the cross-sectional approach.
I estimate the magnitude of the pay–pension tradeoff using the method discussed by Smith and Ehrenberg (Reference Smith, Ehrenberg and Jack1983) and Schiller and Weiss (Reference Schiller and Weiss1980). The specification starts with a standard Mincer human capital equation

where W represents pay, P represents the annual pension accrual, and X represents other factors that influence total compensation. Therefore

where p=P/W, which leads to the following specification

I replace Ln(1+p) with the approximation p leading to the following empirical specification

The predicted value of B 2 is −1.0, which implies that an additional dollar of pension benefits is associated with a $1 decrease in pay. This is the standard specification used by the labor economics literature to estimate pay–pension tradeoffs.Footnote 3, Footnote 4
An alternative specification would be to estimate the elasticity of pay and benefits using the following specification

This alternative specification has two drawbacks. First, pension benefits are often calculated as a percentage of salary and bonus. Therefore, this specification could lead to a mechanical, positive relation between pensions and pay. Second, any omitted variable that is correlated with Ln(P) will bias B 2. Although omitted correlated variables can bias B 2 in formula (4), there are arguably fewer variables correlated with the level of pay and the percentage of pay provided in the form of pension benefits than there are variables correlated with the level of pay and the level of pension benefits.
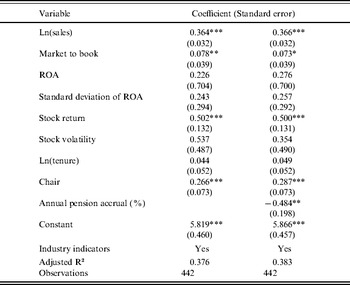
Table 3 presents results of ordinary least squares estimates of the pay–pension tradeoff. To control for other factors that can influence total pay, I include the following measures: natural logarithm of sales, market to book ratio, return on assets, standard deviation of the return on assets, annual stock return, stock return volatility, the natural logarithm of the CEO's tenure, an indicator for whether the CEO chairs the board of directors, and industry indicators. I do not include the CEO's education because Leonard (Reference Leonard1990) finds that although education is associated with becoming a CEO, it is not associated with the variance in CEO pay.
Pay–pension tradeoff
This table presents ordinary least squares estimates of the pay–pension tradeoff. The dependent variable is the natural logarithm of pay. The coefficient on annual pension accrual (%) represents the tradeoff estimate. Model variables are described in Table 1. For each coefficient the standard error is reported in parentheses. Industry indicators are based on the Barth et al. (Reference Barth, Beaver and Landsman1998) classification.

Note: *Statistically significant at the 0.10 level; **at the 0.05 level; *** at the 0.01 level.
Column (1) presents the base specification and column (2) includes the annual pension accrual (%), which proxies for p.Footnote 5 The signs and magnitudes of the independent variables and the explanatory power of the base specification are similar to prior executive compensation studies reviewed by Murphy (Reference Murphy, Orley and David1999). Pay is positively and significantly associated with size, market to book, stock returns, and chair.
When I include the annual pension accrual (%), the coefficients on the other independent variables retain their sign and significance. The coefficient on the annual pension accrual (%) is −0.484 and significantly different from zero, implying that an additional dollar of pension benefits is associated with a 48 cent decrease in pay.Footnote 6 Nevertheless, the coefficient is significantly greater than the theoretical prediction of −1.
5 Bargaining power and the pay–pension tradeoff
The board of directors hires and directly monitors the CEO, negotiates the CEO's contract, and has the authority to fire. However, prior research finds that entrenched CEOs with power over their boards of directors can influence their pay packages. For example, Core et al. (Reference Core, Holthausen and Larcker1999) find that CEOs receive higher levels of pay when they have relatively more power over the board of directors. In related work, Bertrand and Mullainathan (Reference Bertrand and Mullainathan2001) find that stronger boards pay CEOs less for shocks to firm performance that are beyond the CEO's control.
With respect to pensions, Bebchuk and Fried (Reference Bebchuk and Fried2004) postulate that because executive pensions are subject to limited disclosure requirements and are primarily based on tenure, CEOs with power over their boards of directors use pension plans to extract rents from their firms. An implication of this view is that the pension benefits' implicit cost to the CEO decreases as the CEO's power over the board increases. This implication is consistent with the theory of equalizing differences, which predicts a dollar-for-dollar tradeoff only under competitive market conditions. Therefore, pooling CEOs with varying degrees of power could lead to less than dollar-for-dollar estimates of the pay–pension tradeoff.
To investigate this potential explanation, I split the sample into two groups based on the CEO's power over the board of directors, and then test whether the tradeoff is lower for more powerful CEOs.Footnote 7 I calculate five measures of board effectiveness to proxy for the CEO's power. As discussed by Yermack (Reference Yermack1996), CEOs with larger boards have more power due to increased coordination costs. Following this assumption, I calculate the natural logarithm of the number of directors. As discussed by Byrd and Hickman (Reference Byrd and Hickman1992), I expect that the CEO's influence increases with the percentage of directors who are current employees, past employees, or suppliers to the firm, because CEOs can have more influence over careers of ‘inside’ directors. Therefore, I calculate the percentage of directors who are classified as insiders by the SEC. Further, I measure the number of director interlocks, which is defined as the number of directors with whom the CEO sits on outside boards. Consistent with Hallock (Reference Hallock1997), I assume that interlocked directors are less effective monitors due to reciprocal relations. Finally, I calculate the mean director age and the mean number of outside boards on which directors serve, because, as discussed by Core et al. (Reference Core, Holthausen and Larcker1999), older and busier directors are commonly assumed to be less effective monitors of CEOs.
In addition, I use two measures from the prior analyses: chair and tenure. Both measures reflect the potential influence that the CEO has on his pay package − CEOs who have long tenures and/or chair the board can have greater influence on directors' careers.
Table 4 Panel A presents means for the power measures classified by group membership. I use k-means cluster analysis to identify the two groups. K-means cluster analysis partitions each observation into the cluster with the nearest mean measured by Euclidean distance (for a discussion see Sharma, Reference Sharma1996). The low power group consists of 188 CEOs and the high power group consists of 220 CEOs. I lose 34 observations of firms that are not included in the IRRC Directors database. Means for all variables included in the cluster analysis are all less for the low power group, implying that they capture a common factor. Except for mean other boards and independent directors, the means for the low power group are significantly less than those for the high power group, thereby validating the cluster partitions. With respect to pay, CEOs in the high power group receive significantly higher pay than those in the low power group. Furthermore, CEOs in the high bargaining power group receive higher mean levels of pension benefits as a percentage of pay (10.68% versus 8.16%). Although theses means are not significantly different at conventional levels (p=0.13), the medians are significantly different at the 0.10 level.
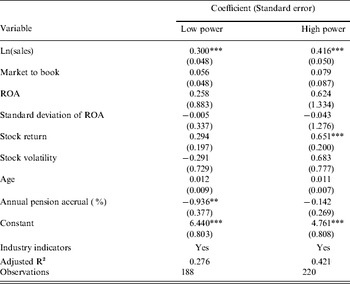
Pay–pension tradeoff and bargaining power This table investigates whether the pay–pension tradeoff varies based on the CEO's bargaining power. Panel A presents means of the low and high CEO power groups. Group membership is determined by k-means cluster analysis of the following variables: interlocks is the average number of interlocks per director; director age is the mean age of the directors; mean other boards is the mean number of outside boards for each director; independent directors is the percentage of directors classified as independent; ln(board size) is the natural logarithm of the number of directors on the board; ln(tenure) is the natural logarithm of the CEO's tenure in years; chair is an indicator for whether the CEO chairs the board of directors. The panel present two-sided p values for t tests of the equality of means. Panel B presents ordinary least squares estimates of the pay–pension tradeoff based on the CEO's power. The dependent variable is the natural logarithm of pay. The coefficient on annual pension accrual (%) represents the tradeoff estimate. Model variables are described in Table 1. For each coefficient, the standard error is reported in parentheses. Industry indicators are based on the Barth et al. (Reference Barth, Beaver and Landsman1998) classification. Panel A: Comparison of means for low and high bargaining power groups Panel B: Tradeoff estimates based on bargaining power Note: *Statistically significant at the 0.10 level; **at the 0.05 level; *** at the 0.01 level.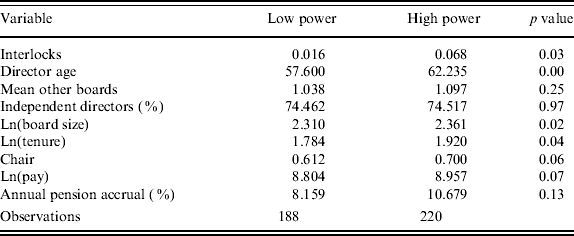

Panel B presents ordinary least squares estimates for both groups. Because I use tenure to proxy for the CEO's power over the board, I include age in the regression specification. The signs of the coefficients on the control variables and explanatory power of the specifications are similar to those presented in Table 3. The major difference between the two groups is that the coefficients on stock return are positive for both groups, but significant only for the high power group. A Chow test, however, shows that the coefficients on stock return are not significantly different from each other.
For the low bargaining power group, the coefficient on annual pension accrual as a percentage of pay is −0.94, which is significantly different from zero but not significantly different from the theoretical prediction of −1.0. For the high power group, the coefficient estimate is −0.14, which is not significantly different from zero. A Chow test shows that the coefficient for the low power group is significantly less than the coefficient for the high power group at the 0.10 level, implying that low power CEOs implicitly pay more for a dollar of pension benefits than relatively more powerful CEOs.
To examine the robustness of the estimates, I carry out two revised specifications. First, in the regression specification presented in Table 4, I include age instead of tenure because the CEO's tenure is used to determine bargaining power. To test whether the removal of tenure induces an omitted variable bias, I estimate a specification that includes tenure. For this revised specification, the magnitudes of the tradeoff estimates are similar to those presented in Table 4: −0.18 for the high bargaining power group and −0.80 for the low bargaining power group. Second, the regression specification presented in Table 4 excludes the bargaining power variables. If bargaining power solely increases overall pay, then their omission could cause the coefficient on percentage of pay as pension benefits to be biased upward for the high power group. I therefore include the bargaining power variables directly in the regression. For this revised specification, the tradeoff estimates are similar to those presented in Table 4: −0.20 for the high bargaining power group and −1.03 for the low bargaining power group.
I find that CEOs with relatively less bargaining power over the board of directors, implicitly pay a dollar for each dollar of pension benefits, whereas more powerful CEOs appear to receive a dollar of pension benefits with no reduction in pay. Therefore, pooling datasets on CEOs with varying degrees of bargaining power blurs the size of the pay–pension tradeoff.
6 Incentives and taxes
In this section I investigate whether incentives and/or taxes are a major determinant of pension grants. If firms grant pensions for either reason, then they may be willing to offer CEOs less than dollar-for-dollar tradeoffs.
Pensions provide incentives
One potential explanation for the lower than anticipated tradeoff rate is that pensions provide CEOs with incentives, and some firms are therefore willing to trade pensions for pay at rates less than dollar-for-dollar. Prior research on the incentive effects of pensions primarily examines whether pensions increase productivity by reducing turnover (for a discussion see Dorsey et al., Reference Dorsey, Cornwell and Macpherson1998). For CEOs, however, retention-based incentive effects appear to be second order because stock options and restricted shares include multi-year vesting schedules, and the value of options and restricted shares is typically much larger than the value of accrued pension benefits. For example, in this sample the mean equity grant is $5.6 million, while mean accrued pension benefits is $3.8 million.
Nevertheless, CEO pensions can provide incentives because they are typically unfunded for tax purposes and are therefore at risk of firm bankruptcy, implying pensions induce the CEO to internalize the firm's bankruptcy risk. Edmans (2006) develops a model in which debt enters into the manager's contract to attenuate the asset substitution problem, which occurs when equity holders substitute riskier assets for the firm's assets to expropriate value from creditors. This model implies that highly levered firms are more likely to provide CEOs with pension benefits for incentive purposes and are therefore more likely to trade pensions for pay at less than a dollar-for-dollar rate in order to induce the CEO to accept pension benefits.
One implication of Edmans' model is that pension benefits as a percentage of pay increases with the firm's leverage. To investigate this possibility, I correlate p with the firm's leverage ratio. The Pearson correlation is −0.02 with a p value of 0.77, implying that pension benefits do not appear to be granted for incentive purposes. Therefore, although incentives cannot be ruled out as an explanation for the lower than predicted tradeoff, they do not appear to be a major determinant.
Pensions receive beneficial tax treatment
Taxes may be another potential reason for the less than predicted tradeoff estimates. If pension benefits provide firms with tax benefits, then firms may be willing to replace pay with pension benefits at rates less than dollar-for-dollar, to induce the CEO to accept pension benefits in his compensation package. The results presented in Table 3 appear consistent with this explanation.Footnote 8
Note, however, that the tax benefits associated with rank-and-file employee pensions do not typically apply to CEO pensions. Unlike worker pensions, most CEO pension plans are not ERISA qualified and therefore do not receive explicit beneficial tax treatment. When firms fund ERISA qualified plans on an ongoing basis, they can take an immediate tax deduction and workers are taxed only upon receipt of pension benefits. In contrast, if a firm funds a non-qualified plan, the CEO incurs an immediate tax liability. Therefore, from the firm's point of view, the tax treatment of pensions is the same as for deferred compensation, in that pensions allow the firm to move the payment and the concomitant deduction into the future. If a firm expects its marginal tax rate to increase in the future, it will find pension benefits tax-preferred and potentially be willing to replace pay with pension benefits at less than a dollar-for-dollar rate (Scholes et al., Reference Scholes, Wolfson, Erickson, Maydew and Shevlin2002).
Firms that expect their marginal tax rates to increase in the future are typically high-growth firms that have low levels of taxable income. But Gerakos (Reference Gerakos2008), Sundaram and Yermack (Reference Sundaram and Yermack2007), and the correlations presented in Table 2, show that CEO pensions are negatively associated with the firm's growth opportunities, which is inconsistent with the tax explanation. Furthermore, in analyses not reported in detail here, I compare the net operating losses for the prior three years for firms that do and do not provide CEO pension benefits. Contrary to the tax explanation for the less than dollar-for-dollar tradeoff, I find that pension-providing firms are significantly less likely to have net operating losses for the prior three years (p<0.01), implying that pension-providing firms do not appear to have increasing future marginal tax rates. Therefore, although taxes cannot be ruled out as an explanation for the lower than predicted tradeoff, they do not appear to be a major determinant.
7 Summary and conclusion
The theory of equalizing differences predicts that workers trade pay for benefits, but empirical support for such tradeoffs is rare. This study extends the literature by investigating the extent to which CEOs trade pay for pension benefits. I find that an additional dollar of pension benefits is associated with a 48 cent decrease in pay. Although the tradeoff estimate is significantly different from zero, it is also significantly less than the anticipated rate of dollar-for-dollar, especially for CEOs with relatively more bargaining power over their boards of directors. This finding implies that the implicit price of pension benefits decreases with the CEO's bargaining power.
There are several potential limitations to this study. First, I use accrued as opposed to projected pension benefits. Because accrued pension benefits do not take into account future tenure and growth in benefits, they can understate the true value of the CEO's pension benefits. This could introduce biases into estimates, but the relatively short tenure of the average US CEO indicates that differences between accrued and projected benefits are probably not large. Second, I use a cross-sectional approach that does not take into account the CEO's career pay and pension accruals, which could also bias estimates. Again, the relatively short tenure of the average CEO and the sharp jump in pay upon becoming a CEO imply that such biases are probably not large. Recent changes in CEO pension disclosure requirements will provide machine-readable longitudinal datasets of CEO pension benefits that may allow future research to address these potential limitations.
Appendix A
To value pension benefits, I hand collect from each firm's proxy statements the CEO's estimated annual retirement payment and the age upon which pension payments commence. I use these items to calculate the value of four life annuities using two retirement age assumptions (62 and 65) and two mortality table assumptions (the Social Security Administration Life Expectancy table and the 1983 General Annuitants' Mortality table). I use the mean of the four estimates in the empirical tests to reduce noise. CEOs who are older than the plan's retirement age are assumed to retire at fiscal year end. To proxy for the annuity discount rate, I use the ten-year corporate bond rate associated with the firm's S&P Long-Term Debt Rating. Consistent with Sundaram and Yermack (2007), unrated firms are assumed to have a AAA rating. I then use the corporate bond rate to discount the value of the annuity to the fiscal year end. The annual accrual of pension benefits is the difference between the present values of accrued pension benefits as of fiscal year ends 2004 and 2005.