





1. Introduction
The photosphere is the outer shell of the Sun; this region has a thickness of 500 km and a temperature of about 5000 K in the outer layer. The photosphere has a set of features, such as granulation and sunspots. The granulation is the pattern made by the convective motions from the inner zone. Sunspots are zones with intense magnetic fields; this causes a lower temperature on the sunspot surface, and the brightness is darker than that of the normal granulation. A sunspot can be divided into a dark umbra, where the magnetic field lines are normal to the surface. This umbra is surrounded by a penumbra; in this region, the inclination of the field lines increases.
One of the main research areas in solar physics is the tracking of plasma in the photosphere and the influence of the magnetic field on plasma dynamics. For this purpose, November & Simon (Reference November and Simon1988) developed a technique called Local Correlation Tracking (LCT) to obtain proper motions in a time series of continuum images. This method uses cross-correlation in a time series of images with a determined cadence to find the apparent motions between the images. An apodization window determines the size of the structures that will be tracked
In this work, we used LCT for selected sunspots to derive apparent motions, and then we analyzed the correlation of the motions with the local magnetic field.
2. Data description and metholology
We used images of continuum and magnetic field data from 4 active regions near the solar disk center. This data was taken from the Helioseismic and Magnetic Imager (HMI) from the Solar Dynamics Observatory (SDO) Pesnell et al. (Reference Pesnell, Thompson and Chamberlin2012) Hoeksema et al. (Reference Hoeksema, Liu, Hayashi, Sun, Schou, Couvidat, Norton, Bobra, Centeno, Leka, Barnes and Turmon2014). The data has a cadence of 720 s, a resolution of 0.504 arcseconds per pixel, and a duration of 6 h for the time series
The continuum images were cleaned to eliminate limb darkening, differential rotation,and p-mode effects. The proper motions were obtained using the LCT algorithm, with the cadence, resolution, and a 3x3" apodization window as parameters.The LCT algorithm has failures in the umbra; for this reason, the results presented here must be disregarded.
The magnetic field data include the intensity B r , inclination B θ , and azimuth B φ components. The azimuth data has a 180° ambiguity, this was solved using minimum energy methods Leka et al. (Reference Leka, Barnes, Crouch, Metcalf, Gary, Jing and Liu2009). The velocity and magnetic field vector data were de-projected from the line-of-sight (LOS) frame to the local frame. For the purpose of comparing the velocity of proper motions with the magnetic field vector, we selected a circular region around each sunspot and divided it into concentric rings with a thickness of about 1".In these rings, we took the mean of the velocity of the proper motions and the mean of the vertical and horizontal magnetic fields. We divided the regions into zones of umbra, penumbra, azimuth, and granulation.
Radial profiles of the mean velocity and magnetic field were constructed for the four sunspots, including their regional divisions. Velocities are given in km/s, and magnetic field strengths are given in Gauss (G)
3. Results
We calculated the sunspot area for the purpose of finding a possible dependence of the velocities and magnetic field intensity on the sunspot sizes:
The sunspots in active regions AR 12546 and AR 12533 have the largest and smallest sizes, respectively. Table 1 shows the sizes and dates of the selected sunsports.
The 4 selected active regions.
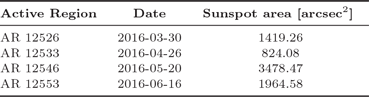
Table 1 Long description
A table with four rows and three columns. The columns are labeled Active Region, Date, and Sunspot area [arcsec^2]. The rows are as follows: Row 1: Active Region, AR 12526; Date, 2016-03-30; Sunspot area, 1419.26. Row 2: Active Region, AR 12533; Date, 2016-04-26; Sunspot area, 824.08. Row 3: Active Region, AR 12546; Date, 2016-05-20; Sunspot area, 3478.47. Row 4: Active Region, AR 12553; Date, 2016-06-16; Sunspot area, 1964.58.
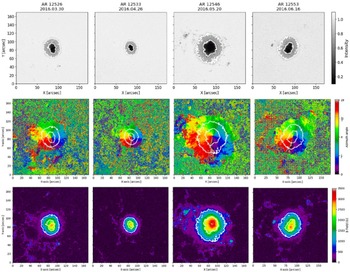
Figure 1 shows the maps of continuum intensity, as well as the azimuthal and strength components of the magnetic fields. All sunspots have a field-of-view (FOV) of 175″×175″
Continuum images, azimuth and intensity of the magnetic field of the 4 sunspots.
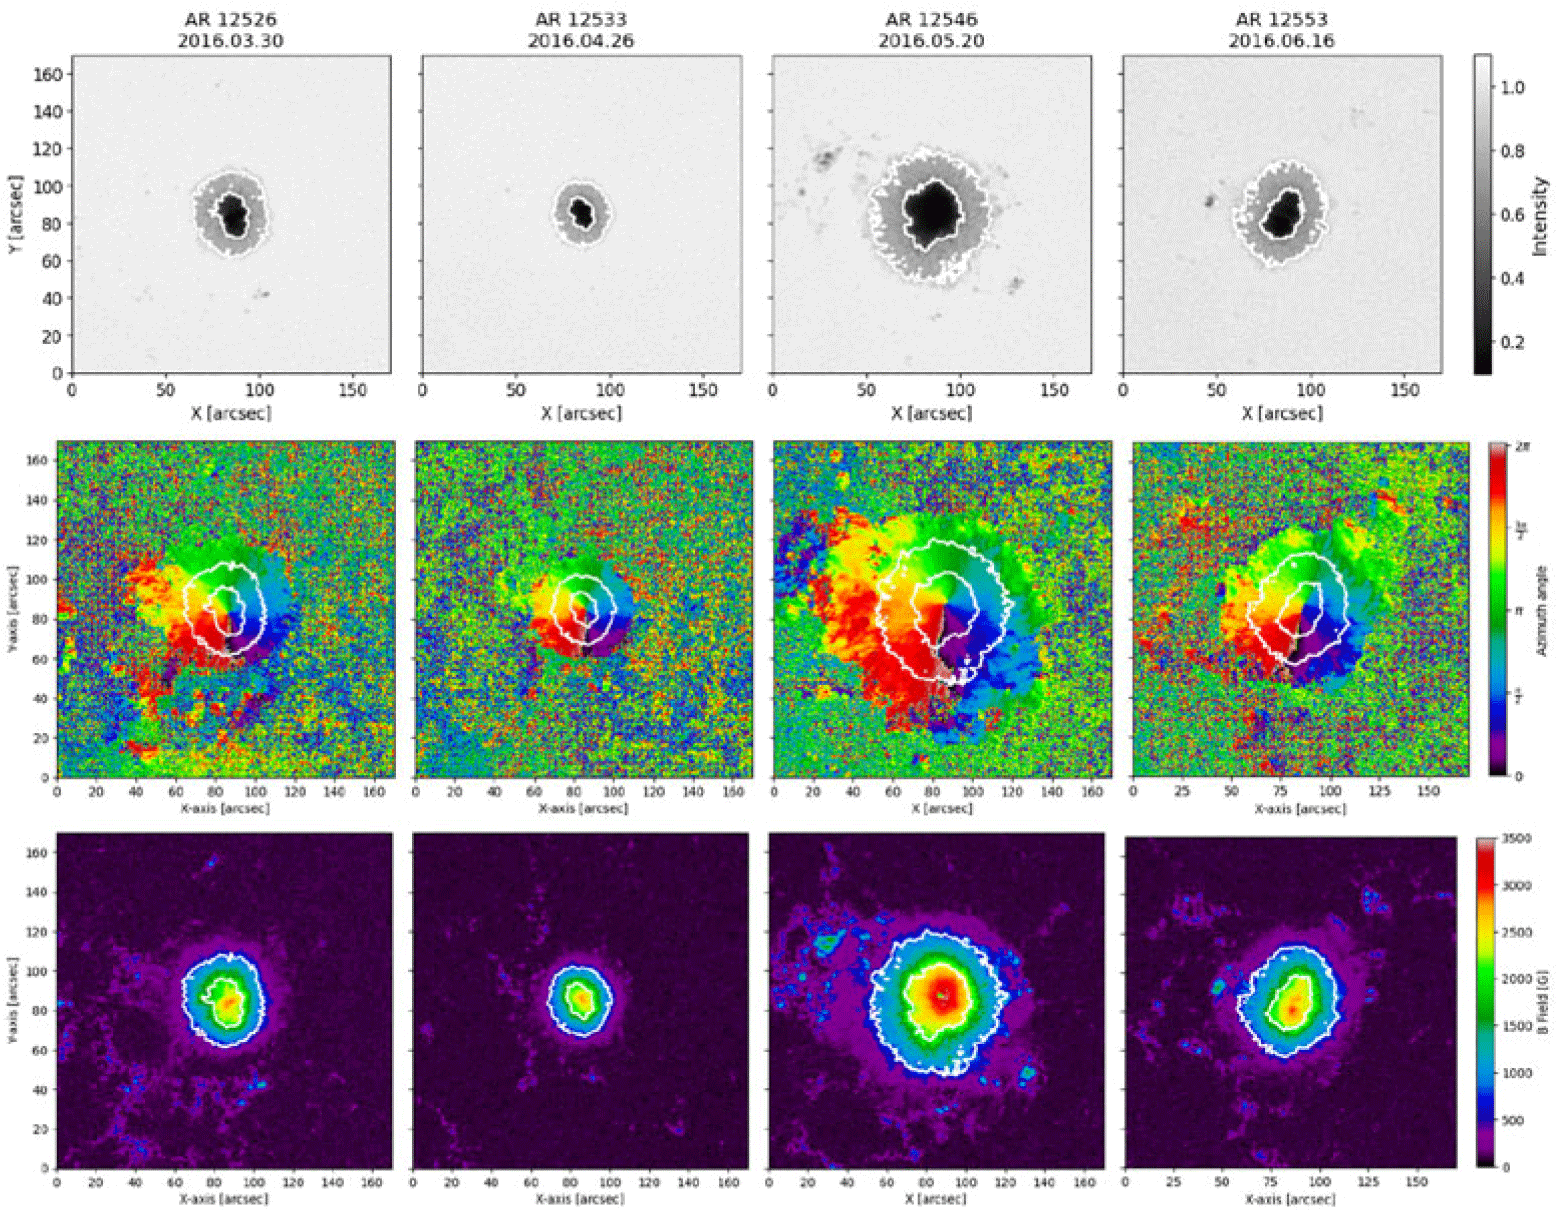
The azimuth images show a region where the azimuthal direction of the magnetic field is well defined, and it extends several arcseconds beyond the boundary of the sunspots penumbra. This could be an indicator of the extension of the influence of the magnetic field over the velocities in a larger area than that of the sunspots. The magnetic field map shows the greatest intensities in the center of the umbrae. The largest sunspot (AR 12546) exhibits a significantly stronger magnetic field compared to the other 3 sunspots.
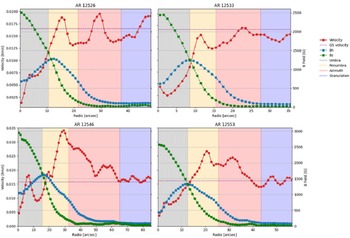
Radial profiles of the LCT velocities, and magnetic field with horizontal and vertical componets. The region of interest (ROI) was divided in umbra, penumbra and definied-azimuth zones.
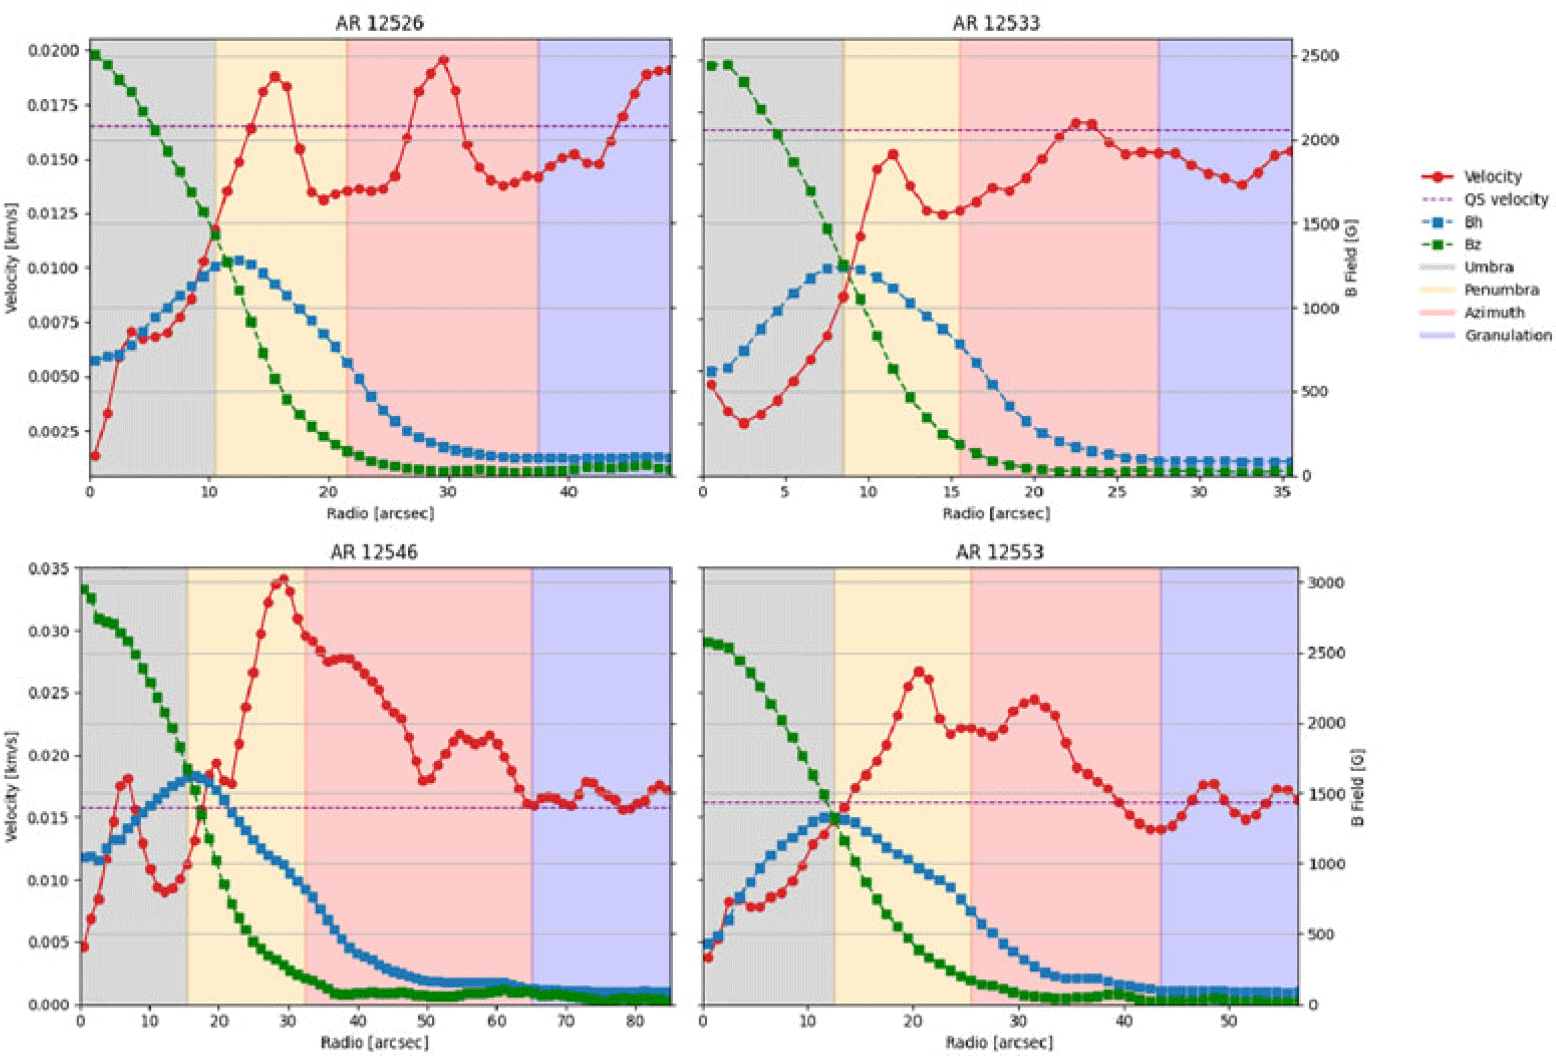
Figure 2 Long description
Panel A: A line graph shows radial profiles of LCT velocities and magnetic field components for active region AR 12526. The x-axis represents the radius in arcseconds, and the y-axis on the left represents velocity in kilometers per second, while the y-axis on the right represents the magnetic field in Gauss. The graph includes data for velocity, quiet sun velocity, horizontal magnetic field component (Bh), and vertical magnetic field component (Bz), with different colors representing umbra, penumbra, azimuth, and granulation zones. Panel B: A line graph shows radial profiles for active region AR 12533 with similar axes and components as Panel A. Panel C: A line graph shows radial profiles for active region AR 12546 with similar axes and components as Panel A. Panel D: A line graph shows radial profiles for active region AR 12553 with similar axes and components as Panel A.
4. Discussion
The magnetic radial profiles show the typical structure of the magnetic field in a sunspot: The vertical component (green dotted line) has the strongest value in the center of the umbra.This strength decreases progressively with radial distance from the umbral center. Meanwhile, the horizontal component (blue dotted line) has a maximum in the umbra frontier with the penumbra. in both directions (towards and away from the sunspot centers), the horizontal magnetic field decreases
The behavior of the velocities obtained with LCT can be classified into two types: the velocities associated with the “small” sunspots and those associated with the “large” sunspots. In the small sunspots, the velocities exhibit peaks in magnitude within the regions of “well-defined” azimuth and the penumbra. In AR 12526, the valleys between these peaks show a reduction in velocity compared to the mean “quiet Sun” velocity (purple dashed line); whereas in AR 12553, this reduction is more pronounced. Near the umbral boundary, the rate of decrease in velocity magnitude increases. The small peak in velocity near the center of the umbra in AR 12533 is considered to be an error of the LCT method.
On the other hand,the large sunspots exhibit stable velocity behavior in the granulation region, with values close to the mean in the quiet Sun. In the region of well-defined azimuth, the velocities show a significant increase towards the center of the umbra, reaching a maximum in the penumbra near the boundary. Beyond this point, the velocity values decrease considerably. Once again, the velocity peaks observed within the umbra are a LCT error.
This profile illustrates the changes in apparent velocities in zones with strong magnetic fields. The difference in the velocity profiles between the small and large sunspots gives us the hypothesis of a possible correlation between the area of sunspots and their apparent motions.We found that the largest sunspots have greater velocities near the sunspot.The same occurs with the magnetic field intensities. However, the QS mean values of velocities are similar for all the active regions. Additionally, the sunspots in regions 125326–12533 and 12546–12553 are considered to be the same sunspot, respectively, as they make two passes across the solar disk. In the second pass, the area of the sunspots has decreased due to decay, and consequently, both the magnetic field intensity and the velocity magnitudes have also decreased.
Our future work will focus on the analysis of sunspots with areas comparable to those studied in this work in order to verify the behavior of proper motion velocities in both small and large sunspots. Additionally, we aim to investigate the alignment between these velocities and the magnetic field azimuth in the regions surrounding the sunspots.
5. Acknowledgements
Juan Pablo Herrera Moreno and Benjamín Calvo Mozo acknowledge funding from Universidad Nacional de Colombia and the Observatorio Astronómico Nacional for the support and financial scholarship received during this research. This research is also supported by the Czech–German common grant, funded by the Czech Science Foundation under the project 23-07633K and by the Deutsche Forschungsgemeinschaft under the project BE 5771/3-1 (eBer-23 13412) and the institutional support RVO:67985815. This research has made use of NASA’s Astrophysics Data System Bibliographic Services. HMI/SDO data are courtesy of NASA/SDO and the HMI science team, and they were obtained from the Joint Science Operation Center (JSOC).
Supplementary material
To view supplementary material for this article, please visit https://doi.org/10.1017/S1743921326106966.


 Open access

