





Diabetes mellitus, a major endocrine and chronic metabolic disorder, poses a serious threat to human health(Reference Anjana, Mohan and Rangarajan1). According to the latest report from the International Diabetes Federation, approximately 140·9 million people in China were diagnosed with diabetes in 2021, and this number is projected to reach 174·4 million by 2040(Reference Magliano, Boyko and Balkau2). Substantial evidence has demonstrated that diabetes can lead to various life-threatening microvascular and macrovascular complications(Reference Laiteerapong, Ham and Gao3,Reference Arnold, Khunti and Tang4) .
Dietary quality is a key determinant of blood glucose regulation. Healthier dietary patterns can reduce the risk of progression from prediabetes to diabetes by 40–70 %(Reference Tabak, Herder and Rathmann5). Among prediabetic individuals who modified their diet, 40·5 % regained normal glucose tolerance, with significant reductions in fasting plasma glucose, BMI, glycated Hb (HbA1c) and blood pressure(Reference Muscogiuri, Barrea and Di Somma6). Traditional dietary assessment, which focuses on single nutrients or food items, fails to capture the complexity of dietary patterns and hinders the systematic evaluation of dietary quality. Consequently, several comprehensive dietary indices have been developed globally in recent years.
The Healthy Eating Index (HEI) and Diet Quality Index (DQI) are the two most extensively referenced and validated original dietary quality scores internationally(Reference Gil, Martinez de Victoria and Olza7). In China, researchers primarily use the Diet Balance Index (DBI) to assess dietary quality, which was updated based on the Chinese Dietary Guidelines and the Chinese Balanced Diet Pagoda(Reference Tan, Lu and Song8). Although associations between dietary quality indices and diabetes have been reported, evidence regarding the relationship between dietary quality and diabetes risk in Asian populations remains limited, and findings across different populations are inconsistent.
Beyond the inconsistent associations between dietary quality indices and blood glucose levels, the underlying mechanisms by which diet regulates diabetes prevention remain unclear. Studies have implicated a link between dietary intake and systemic inflammation(Reference Jafaripour, Sedighi and Jokar9). Chronic systemic inflammation is closely associated with the pathogenesis of chronic diseases, including diabetes. Numerous inflammatory markers have been proposed to characterise the relationship between chronic inflammation and chronic diseases, including diabetes. In addition to established biomarkers such as C-reactive protein, TNF-α and plasminogen activator inhibitor-1, white blood cell (WBC) counts and specific subtypes (e.g., neutrophils, monocytes) are often elevated in chronic inflammatory states.
Findings from the National Health and Nutrition Examination Survey (NHANES) prospective nutritional cohort showed that the systemic immune-inflammation index (SII) was positively associated with incident diabetes(Reference Zhao, Liu and Xu10). In addition to its association with diabetes incidence, a cross-sectional study of 1460 Chinese patients with diabetes reported that elevations in systemic immune-inflammatory markers, including the neutrophil-to-lymphocyte ratio (NLR), platelet-to-lymphocyte ratio (PLR), lymphocyte-to-monocyte ratio and SII, were positively associated with the risk of diabetic nephropathy complications(Reference Li, Zhang and Zhang11).
Similar findings were reported in another study from the NHANES nutritional cohort, which analysed 9-year follow-up data of patients with diabetes(Reference Liu, Zheng and Du12). The study also found that systemic inflammatory markers were associated with all-cause mortality in patients with diabetes(Reference Zhang, Fan and Xu13). However, existing research on inflammatory factors and diabetes has primarily focused on complication prognosis and mortality, with a limited number of studies systematically evaluating inflammatory markers in relation to incident diabetes risk in general population cohorts.
We conducted a cross-sectional study to investigate the association between dietary quality, assessed by the HEI, DQI and DBI, and glycemic status in a Southeast Chinese cohort. Additionally, we explored whether and to what extent this association was mediated by systemic inflammatory markers, using both simple and multiple mediation analyses.
Methods
Study design and participants
A cross-sectional study was conducted using baseline data from the Fuqing Cohort Study, collected from July 2020 to December 2022. The Fuqing Cohort Study is a prospective multi-purpose research programme conducted by Fujian Medical University in collaboration with the local government of Fuqing City, Fujian Province, Southeast China. The main purpose of the cohort is to investigate the natural history and risk factors of chronic noncommunicable diseases (including cancer, diabetes, fatty liver, etc.) among the Chinese population in the Southeast coastal region.
Detailed information on sociodemographics (age, sex, education level and employment status), lifestyle factors (smoking, alcohol consumption and tea drinking), chronic disease history and medication use was collected via face-to-face interviews using electronic questionnaires administered by trained interviewers. Most participants also underwent physical examinations and provided biological samples. Inclusion criteria were: (1) aged 35–75 years; (2) residents of Fuqing City. Exclusion criteria were: (1) participants with a history of type 1 diabetes; (2) participants with hypoglycaemia at baseline; (3) participants with cancer. Additionally, we excluded those with extreme daily caloric intake (>4000 or <600 kcal/day for men; >3500 or <500 kcal/day for women). A total of 21 476 participants were included in the study. A flow chart illustrating the participant inclusion and exclusion procedures along with detailed information on the study subjects included in the analysis was presented in Figure 1. This study was approved by the Ethics Committee of Fujian Medical University (Approval numbers: 2020-58), and the study protocol conforms to the ethical guidelines of the 1975 Declaration of Helsinki. All participants provided written informed consent.
Flow chart illustrating the participant inclusion and exclusion procedures.

Dietary intake index assessment
A validated FFQ was used to assess usual dietary habits over the previous year, as previously described(Reference Su, Gong and Chen14). The questionnaire contained 93 items classified into the following categories: staple foods, tubers, eggs, meat, fish and seafood, milk and dairy products, beans and soy products, vegetables, fruits, nuts and seeds, snacks and desserts, fried foods, beverages and fats/oils. Trained researchers collected data on portion sizes and consumption frequencies. The average daily consumption (g/d) of each food item was calculated by multiplying the reported portion size by its consumption frequency. Total energy and nutrients for each food item were calculated primarily using the China Food Composition Table (5th and 6th editions). For food items with incomplete nutrient data, we referenced three international food composition databases: Food Composition in Japan 2015, the USDA Nutrient Database and the UK Nutrient Databank. Nutrient intakes were energy-adjusted using the residual method(Reference McCullough and Byrd15).
The HEI consists of thirteen components, with a total score range of 0 to 100(Reference Krebs-Smith, Pannucci and Subar16). Each component is scored from 0 to 10 based on intake levels. For all components, intakes between the minimum and maximum standards are scored proportionally, summing to a total of 100. A higher HEI score indicates better dietary quality.
The DQI was calculated following the method developed by Kim et al.(Reference Kim, Haines and Siega-Riz17). Scores range from 0 to 100, with higher values indicating better dietary quality. The DQI assesses four major dietary dimensions: variety (0–20 points), adequacy (0–40 points), moderation (0–30 points) and overall balance (0–10 points). Details of the DQI calculation have been previously described. A higher DQI score reflects better dietary quality.
The DBI consists of fourteen subgroups and eight components with different score ranges, evaluation of which was performed according to the Dietary Guidelines for Chinese Residents and the recommended intake amounts from the Balanced Diet Pagoda(Reference Xu, Hall and Byles18). A score of 0 means that the food intake meets the recommendation of the dietary guidelines. Negative or positive scores indicate insufficient or excessive food intake, respectively. Three indicators were further calculated: higher bound score (HBS), lower bound score (LBS) and diet quality distance (DQD). The LBS was the absolute value of the sum of all negative scores, indicating insufficient food intake. The HBS was the sum of all positive scores, indicating excessive intake. The DQD was the sum of the absolute values of scores for each component, indicating overall dietary imbalance. The ranges of the LBS, HBS and DQD were 0–72, 0–44 and 0–96, respectively. A higher DBI score indicates lower dietary quality.
Detailed descriptions of the components and scoring criteria for each dietary index are provided in Supplemental Tables S1–S3. Each component in these dietary patterns was assigned positive or negative scores. As salt and added sugar consumption were not measured in our survey, relevant items of the three indices were not included.
Measurement of inflammatory indicators
Blood cell parameters, including neutrophils, lymphocytes, monocytes and platelets, were measured using standard laboratory procedures with a fully automated blood cell analyser (Xs–1000i, Sysmex, Osaka, Japan). Selected biomarkers included the NLR, platelet-to-lymphocyte ratio (PLR), monocyte-to-lymphocyte ratio (MLR), systemic inflammation response index (SIRI: [neutrophils × monocytes]/lymphocytes) and SII ([neutrophils × platelets]/lymphocytes).
Definition of normal glucose, prediabetes and diabetes
All eligible participants underwent a fasting blood glucose test and an oral glucose tolerance test. Prediabetes was defined as fasting blood glucose level of 110 mg/dL (6·1 mmol/L) to 125 mg/dL (6·9 mmol/L), or an oral glucose tolerance test with two–hour blood glucose level of 140 mg/dL (7·8 mmol/L) to 199 mg/dL (11·0 mmol/L) in participants without a history of diabetes. Diabetes was defined as a previous physician diagnosis of diabetes, current use of diabetes medication or having one or more of the following: fasting blood glucose level ≥126 mg/dL (7·0 mmol/L); or an oral glucose tolerance test with two–hour blood glucose level ≥200 mg/dL (11·1 mmol/L).
In the sensitivity analysis, we excluded participants with a history of type 2 diabetes mellitus (T2DM); diabetes was defined as having one or more of the following: fasting blood glucose level ≥126 mg/dL (7·0 mmol/L); or oral glucose tolerance test: two-hour blood glucose level ≥200 mg/dL (11·1 mmol/L).
Assessment of covariates
Demographic data (age, sex, ethnic group, residence, education and occupation), lifestyle behaviours (smoking, alcohol drinking, tea drinking) and chronic disease status (hypertension and hyperlipidaemia) were collected via an electronic questionnaire at baseline. BMI was calculated as weight (in kilograms) divided by the square of height (in metres) and was classified into three categories (<18·5, 18·5–23·9, ≥24·0 kg/m2). Hypertension was defined as having one or more of the following: (1) self-reported or doctor-diagnosed hypertension; (2) current treatment with antihypertensive agents; (3) systolic blood pressure ≥140 mmHg and/or diastolic blood pressure ≥90 mmHg. Hyperlipidaemia was defined as having one or more of the following: total cholesterol ≥ 6·2 mmol/L, triglyceride ≥ 2·3 mmol/L, HDL cholesterol <1·0 mmol/L or LDL cholesterol ≥4·1 mmol/L.
Statistical analysis
Categorical variables were expressed as counts (percentages), and continuous variables were presented as medians with interquartile ranges. Multinomial logistic regression models were used to evaluate the associations between dietary quality indices or inflammatory markers and prediabetes/diabetes, adjusting for the following covariates: age, sex, residence, education, occupation, smoking, alcohol consumption, tea drinking, hypertension and hyperlipidaemia. Additionally, Spearman’s rank correlation was performed to assess the association between dietary quality indices and inflammatory markers.
Mediation analysis was conducted to explore whether the association between dietary quality and diabetes was mediated by systemic inflammation. Both simple and multiple mediation models were used to assess the mediating roles of inflammatory markers in the relationship between dietary quality indices and diabetes. In the parallel multiple mediation analysis, each individual mediator was simultaneously incorporated into a single mediation model to estimate the multiple mediation effect. In the mediation analysis, we decomposed the total effects into natural direct effects and natural indirect effects (NIE) using CMAverse, an R package for causal mediation analysis(Reference Shi, Choirat and Coull19). CMAverse is an R package designed for causal mediation analysis under the potential outcome framework. It implements a broad set of modern causal inference methods to decompose the total effect of an exposure on an outcome into four components: natural direct effect, NIE (mediation effect), controlled direct effect and total effect. The 95 % CI for indirect effects were estimated using bias-corrected bootstrap CI from 10 000 resamples (RStudio version 4.2.2).
Results
Characteristics of the study population
Demographic characteristics of 21 476 subjects are described in Table 1. Compared with participants with normal glycaemia, those in the prediabetes or diabetes group were older, less educated and had higher BMI. The distributions of occupation, smoking status, tea drinking, hypertension and hyperlipidaemia also differed significantly across groups. Additionally, total and differential WBC, including neutrophils, lymphocytes, monocytes, NLR, SII and SIRI, were higher in the prediabetes and diabetes groups than in the control group (all P < 0·001). The distribution of inflammatory markers is presented in Supplemental Table S4.
Basic characteristics of study participants according to glycemic status

Table 1. Long description
The table presents basic characteristics of 21476 study participants categorized by glycemic status: Normoglycemia, Prediabetes, and Diabetes. It includes data on age, sex, BMI, occupation, education, smoking, alcohol drinking, tea drinking, hypertension, and hyperlipidaemia. The table has 12 columns and 11 rows, with column headers including Variables, Total, Normoglycemia, Prediabetes, Diabetes, and P. Row labels include Age, Sex, BMI, Occupation, Education year, Smoking, Alcohol drinking, Tea drinking, Hypertension, and Hyperlipidaemia. Each row provides mean and standard deviation values for each glycemic status category. Notable trends include increasing age and BMI from Normoglycemia to Diabetes, and significant differences in occupation, education, smoking status, tea drinking, hypertension, and hyperlipidaemia across groups.
Association between dietary quality index and different glycemic status
Distributions of the three dietary indices (HEI, DQI and DBI) are presented in Supplemental Tables S5–S7. Both total and adequacy component scores of the HEI were lower in prediabetes and diabetes groups compared with the control group (all P < 0·001), whereas no significant differences were observed in the moderation component across glycemic groups. For DQI, participants with higher glycemic status had significantly lower total scores (P < 0·001) and adequacy scores (P < 0·001), while moderation and overall balance scores showed marginal differences. All three DBI indicators (LBS, HBS and DQD) were significantly higher in dysglycemic participants, reflecting more severe intake inadequacy, excessive intake and overall dietary imbalance in individuals with abnormal glycaemia.
The association between dietary quality indices and glycemic status was evaluated using logistic regression, with index scores treated as categorical variables. As shown in Table 2, individuals with higher DQI and HEI scores had a lower risk of diabetes compared with those with lower scores, both before and after adjusting for confounders. Compared with the lowest quartile, the highest quartile of DQI was inversely associated with the risk of prediabetes (OR:0·885, 95 % CI: 0·802, 0·975) and diabetes (OR: 0·719, 95 % CI: 0·640, 0·807), while the highest quartile of HEI was inversely associated with diabetes risk (OR:0·863, 95 % CI: 0·768, 0·970). For DBI, where higher scores indicate poorer dietary quality, the highest score group was used as the reference. Compared with participants in the highest quartile, those in the lowest quartiles of DQD (OR: 0·852, 95 % CI: 0·754, 0·961), LBS (OR:0·888, 95 % CI: 0·788, 1·000) and HBS (OR: 0·782, 95 % CI: 0·696, 0·878) were less likely to have diabetes. Collectively, these findings suggest that higher dietary quality is associated with a lower risk of diabetes.
Association of diet quality indicators with the risk of prediabetes and diabetes

Table 2. Long description
The table presents the association between dietary quality indices and glycemic status using logistic regression. It includes three models for prediabetes and diabetes, with variables such as Healthy Eating Index, Diet Quality Index, Diet Balance Index, LBS, HBS, and DQD. The table has 12 rows and 18 columns, including headers and quartiles. Each row provides odds ratios (OR) and 95% confidence intervals (CI) for different dietary indices. Notable trends include lower risk of diabetes with higher DQI and HEI scores, and lower risk of diabetes with lower scores in DQD, LBS, and HBS.
LBS, lower bound score; HBS, higher bound score; DQD, diet quality distance.
Note: Inadequate intake (LBS), excessive intake (HBS), overall unbalance (DQD).
Model 1 Crude model.
Model 2 Adjusted for age and sex.
Model 3 Additionally adjusted for residence, BMI, occupation, education, smoking, tea drinking, alcohol drinking, hypertension, hyperlipidaemia and energy intake.
Association among inflammatory indicators, dietary quality index and glycemic status
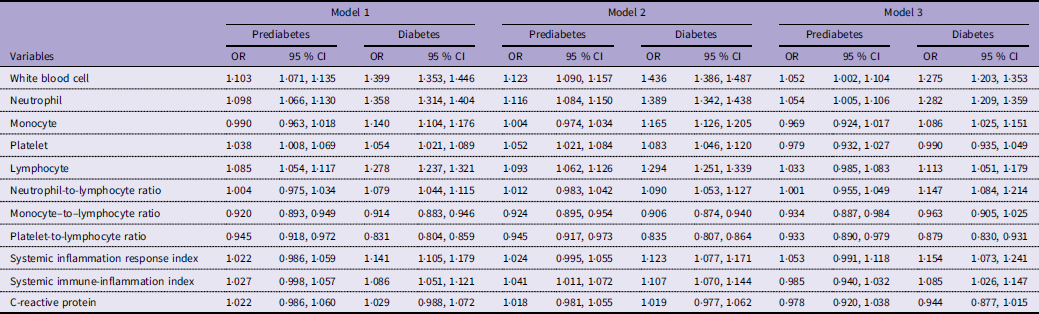
The association between inflammatory markers and glycemic status was analysed with markers treated as both categorical and continuous variables (Table 3, Supplemental Table S8). Elevated WBC counts (OR: 1·275, 95 % CI: 1·203, 1·353), neutrophils (OR: 1·282, 95 % CI: 1·209, 1·359), monocytes (OR: 1·086, 95 % CI: 1·025, 1·151), lymphocytes (OR: 1·113, 95 % CI: 1·051, 1·179), NLR (OR: 1·147, 95 % CI: 1·084, 1·214) and SII (OR: 1·085, 95 % CI: 1·026, 1·147) were associated with increased diabetes risk. PLR showed an inverse association with diabetes risk (OR: 0·879, 95 % CI:0·830, 0·931). No significant association was found between C-reactive protein and diabetes (OR: 0·944, 95 % CI: 0·877, 1·015). Spearman’s rank correlation coefficients between dietary quality indices and inflammatory markers are shown in Supplemental Figure 1. Inverse associations were observed between inflammatory markers (WBC, neutrophils, lymphocytes, monocytes, NLR, SIRI and PLR) and the HEI index as well as DBI score components (all P < 0·01). No significant correlations were found between DQI and inflammatory biomarkers. The independent associations of fruit and vegetable scores from the three dietary indices with inflammatory markers. The results showed that fruit and vegetable scores were significantly inversely correlated with a wide range of inflammatory markers; detailed findings are presented in the Supplemental Table S9.
Association of inflammatory indicators with the risk of prediabetes and diabetes

Table 3. Long description
The table presents the association of inflammatory indicators with the risk of prediabetes and diabetes across three models. It has 12 rows and 12 columns. The columns are labeled as Model 1 Prediabetes OR, Model 1 Prediabetes 95 % CI, Model 1 Diabetes OR, Model 1 Diabetes 95 % CI, Model 2 Prediabetes OR, Model 2 Prediabetes 95 % CI, Model 2 Diabetes OR, Model 2 Diabetes 95 % CI, Model 3 Prediabetes OR, Model 3 Prediabetes 95 % CI, Model 3 Diabetes OR, and Model 3 Diabetes 95 % CI. The rows are labeled with different inflammatory indicators: White blood cell, Neutrophil, Monocyte, Platelet, Lymphocyte, Neutrophil-to-lymphocyte ratio, Monocyte-to-lymphocyte ratio, Platelet-to-lymphocyte ratio, Systemic inflammation response index, Systemic immune-inflammation index, and C-reactive protein. Each cell contains the corresponding odds ratio (OR) and 95 percent confidence interval (CI) values for prediabetes and diabetes across the three models.
Model 1 Crude model.
Model 2 Adjusted for age and sex.
Model 3 Additionally adjusted for residence, BMI, occupation, education, smoking, tea drinking, alcohol drinking, hypertension and hyperlipidaemia.
Mediation analyses
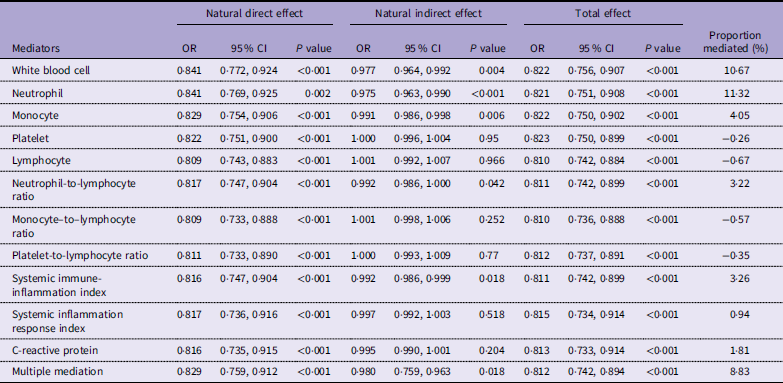
In the mediation analysis, we quantified the proportion of the association between dietary quality and glycemic status that may potentially be mediated by systemic inflammation. In simple mediation models, we evaluated the mediating effect of each inflammatory marker individually, while multiple mediation models assessed the combined mediating effect of all markers simultaneously. After covariate adjustment, potential indirect effects were observed for total WBC, neutrophils, monocytes, NLR and SII when included as individual mediators, indicating that these variables may mediate the association between the HEI and diabetes. The mediated proportions for these five markers were 10·67 %, 11·32 %, 4·05 %, 3·21 % and 3·26 %, respectively (Table 4). Results of the mediation analysis were presented in mediation model diagram (Supplemental Figure 2).
Mediation analysis of inflammatory indicators for the association between Healthy Eating Index and risk of diabetes

Table 4. Long description
A table comparing the mediation analysis of various inflammatory indicators for the association between Healthy Eating Index and the risk of diabetes. The table has 13 rows and 10 columns. Column headers are Mediators, Natural direct effect OR, Natural direct effect 95% CI, Natural direct effect P value, Natural indirect effect OR, Natural indirect effect 95% CI, Natural indirect effect P value, Total effect OR, Total effect 95% CI, Total effect P value, and Proportion mediated (%). Row 1: White blood cell, 0.841, 0.772, 0.924, <0.001, 0.977, 0.964, 0.992, 0.004, 0.822, 0.756, 0.907, <0.001, 10.67. Row 2: Neutrophil, 0.841, 0.769, 0.925, 0.002, 0.975, 0.963, 0.990, <0.001, 0.821, 0.751, 0.908, <0.001, 11.32. Row 3: Monocyte, 0.829, 0.754, 0.906, <0.001, 0.991, 0.986, 0.998, 0.006, 0.822, 0.750, 0.902, <0.001, 4.05. Row 4: Platelet, 0.822, 0.751, 0.900, <0.001, 1.000, 0.996, 1.004, 0.95, 0.823, 0.750, 0.899, <0.001, -0.26. Row 5: Lymphocyte, 0.809, 0.743, 0.883, <0.001, 1.001, 0.992, 1.007, 0.966, 0.810, 0.742, 0.884, <0.001, -0.67. Row 6: Neutrophil-to-lymphocyte ratio, 0.817, 0.747, 0.904, <0.001, 0.992, 0.986, 1.000, 0.042, 0.811, 0.742, 0.899, <0.001, 3.22. Row 7: Monocyte-to-lymphocyte ratio, 0.809, 0.733, 0.888, <0.001, 1.001, 0.998, 1.006, 0.252, 0.810, 0.736, 0.888, <0.001, -0.57. Row 8: Platelet-to-lymphocyte ratio, 0.811, 0.733, 0.890, <0.001, 1.000, 0.993, 1.009, 0.77, 0.812, 0.737, 0.891, <0.001, -0.35. Row 9: Systemic immune-inflammation index, 0.816, 0.747, 0.904, <0.001, 0.992, 0.986, 0.999, 0.018, 0.811, 0.742, 0.899, <0.001, 3.26. Row 10: Systemic inflammation response index, 0.817, 0.736, 0.916, <0.001, 0.997, 0.992, 1.003, 0.518, 0.815, 0.734, 0.914, <0.001, 0.94. Row 11: C-reactive protein, 0.816, 0.735, 0.915, <0.001, 0.995, 0.990, 1.001, 0.204, 0.813, 0.733, 0.914, <0.001, 1.81. Row 12: Multiple mediation, 0.829, 0.759, 0.912, <0.001, 0.980, 0.759, 0.963, 0.018, 0.812, 0.742, 0.894, <0.001, 8.83.
Adjusted for age and sex, residence, BMI, occupation, education, smoking, tea drinking, alcohol drinking, hypertension, hyperlipidaemia and energy intake.
In the multiple mediation model, independent indicators, including WBC, neutrophil count, monocyte count, NLR and SII, were incorporated into the mediation model simultaneously to assess the multiple mediation effects. A potential indirect effect was observed (OR: 0·980, 95 % CI: 0·759, 0·963), indicating the collective mediating role of inflammatory markers in the association between the HEI and diabetes, with a total mediated proportion of 8·83 % (Supplemental Figure 2). By contrast, inflammatory markers showed no significant mediating effects on the associations of DQI or DBI with diabetes, except for the DBI HBS component (Supplemental Tables S10 and S11). When evaluated as individual mediators, total WBC (OR: 0·918, 95 % CI: 0·973, 0·996) and monocytes (OR: 0·992, 95 % CI: 0·987, 0·997) showed potential indirect effects, indicating their role in mediating the association between excessive food intake and diabetes risk.
Sensitivity analyses
The cross-sectional design may introduce reverse causality bias. Therefore, we excluded participants with a history of T2DM and included only newly diagnosed diabetic patients in a sensitivity analysis that excluded baseline diabetic participants. All three dietary indices (HEI, DQI and DBI) showed robust and significant associations with diabetes risk (Supplemental Table S12). The observed indirect effects of systemic inflammatory markers (total WBC, neutrophils, SIRI and C-reactive protein) in the association between HEI and diabetes were retained (Supplemental Table S13). We further conducted another sensitivity analysis by including participants with baseline cancer history (Supplemental Tables S14 and S15). Consistent findings were observed: the three dietary indices maintained stable significant correlations with diabetes risk, and the associations between systemic inflammatory markers and diabetes risk also remained unchanged.
Discussion
T2DM is a global public health priority, with dietary improvement being a core preventive strategy. This cross-sectional study of 21 476 Southeast Chinese adults found that higher dietary quality (assessed by HEI, DQI and DBI) was consistently associated with lower T2DM risk. These associations were partially mediated by systemic inflammatory markers, including WBC, neutrophils, monocytes, NLR and SII. Among the three indices, DQI showed the strongest inverse association with diabetes risk, while inflammatory mediation reached significance only for HEI.
This cross-sectional study assesses the dietary quality of rural residents in Fujian Province using three dietary quality indices. The adequacy score and moderation are 38·31 ± 5·71 and 18·46 ± 2·50, respectively, comparable to the American adult population in the NHANES (2003–2018) cross-sectional study with a total HEI score range of 54·75–57·58(Reference Vinyard, Zimmer and Herrick20). The average total score, variety score, adequacy score, moderation score and overall balance score of DQI are 57·83 ± 9·42, 11·17 ± 4·34, 26·35 ± 5·02, 15·08 ± 5·64 and 5·58 ± 2·36, respectively. These DQI scores closely resemble those from the 1993 China Health and Nutrition Survey (CHNS) and the 1994–1996 USA Continuing Survey of Food Intakes by Individuals(Reference McCullough and Byrd15). The counterparts of the CHNS are 60·5 ± 0·11, 11·8 ± 0·06, 28·0 ± 0·05, 18·6 ± 0·10 and 2·1 ± 0·04, while the counterparts of the Continuing Survey of Food Intakes by Individuals are 59·1 ± 0·14, 15·6 ± 0·04, 28·1 ± 0·08, 14·3 ± 0·08 and 1·1 ± 0·02. Compared with DQI scores in CHNS 1993, the moderation score decreased, which can be attributed to the rapid increase in consumption of high-fat, high-sodium and high-calorie foods over the past decades. However, the overall balance score has significantly improved compared with thirty years ago. Recent data from CHNS (2009–2011) show the average DQI total score was approximately 56·44, similar to the current population’s DQI score(Reference Zheng, Zhu and Li21).
For the DBI, the average low bound score, high bound score and DQD score are 16·0, 14·7 and 30·7, respectively. The vast majority of the population (98·9 %) had no or minor issues with inadequate intake. In contrast, 78·76 % of participants had no or minor issues with excessive intake, indicating a more severe problem with excessive intake than inadequate intake. The DBI performance in this population was better than that of a Southwest China population, where 24·9 % had severe inadequate intake(Reference Zhang, Qin and Liu22), and a central China (Henan Province) population, where 24·5 % had moderate under-intake and 12·3 % had moderate over-intake(Reference Ran, Zhai and Xu23).
In analysing the association between dietary quality indices and diabetes risk, we found that the distributions of HEI, DQI and DBI varied across blood glucose groups. Higher diet quality, indicated by higher HEI/DQI scores and lower DBI scores, was inversely associated with hyperglycaemia risk. The average total score (55·86 v. 56·77) and adequacy score (37·45 v. 38·31) of HEI in diabetic patients are lower than in the control group. The average total score (55·53 v. 57·83), variety score (10·28 v. 11·17) and adequacy score (25·11 v. 26·35) are lower in diabetic individuals compared with non-diabetic subjects. All three DBI indicators, LBS (16·945 v. 15·465), HBS (15·233 v. 14·598), DQD (32·178 v. 30·063), were significantly higher in diabetic patients, reflecting more severe intake inadequacy, excessive intake and overall dietary imbalance in individuals with abnormal glycaemia.
Existing research on dietary quality indices and diabetes risk remains inconclusive. The HEI is among the most frequently studied indices: Stephanie et al. analysed data from the Nurses’ Health Study and Health Professionals Follow-Up Study cohorts, reporting that the HEI had the strongest associations with CHD and diabetes(Reference Chiuve, Fung and Rimm24). In a published meta-analysis of associations between diet quality and health status, Jakub et al. reported that highest-quality diets, as assessed by five indices including the HEI, were inversely associated with risks of diverse health outcomes, including T2DM(Reference Morze, Danielewicz and Hoffmann25). Conversely, Simone et al. evaluated the HEI’s association with T2DM risk across four ethnic groups and found no significant association in the population with the ethnicity of Japanese-American(Reference Jacobs, Harmon and Boushey26).
Evidence on DQI scores and glycemic status remains limited. Beatriz et al.’s systematic review evaluated five dietary quality indices and found that higher DQI scores were associated with lower HbA1c levels in diabetic patients across clinical trials(Reference Santos, Alves and Rocha27). In contrast, the Ravansar Non-Communicable Disease Cohort Study in western Iran reported higher DQI total scores in individuals with diabetes, suggesting a positive association(Reference Mokhtari, Abdollahzad and Rezaeian28). A prospective study using the DQI to assess adherence to the 2005 Dietary Guidelines for Americans in Black and White young adults found no significant association between DQI scores and diabetes risk(Reference Zamora, Gordon-Larsen and He29). Almost all the results mentioned above derive from Caucasian populations, while evidence from other ethnicities remains scarce. A prospective cohort study has been reported using CHNS data from a large-scale Asian population, in which dietary quality was assessed by the DBI. The DBI’s LBS and DQD were positively associated with diabetes risk(Reference Hua, Zhang and Liu30), consistent with the current study in Southeast China. Discrepancies in dietary quality-diabetes associations across studies may be attributed to variations in indices, dietary intake measurement tools, and study population ethnicity. In addition, we also observed that the correlation between DQI and diabetes was slightly stronger than that of HEI and DBI. Such differences in findings may be attributable to the different assessment frameworks of DQI, HEI and DBI. HEI and DBI focus on dietary adequacy and moderation, while DQI places considerable weighting on dietary variety and overall dietary balance, which may contribute significantly to diabetes risk.
In addition to the findings of dietary quality and diabetes risk, we investigated the potential mediating role of systemic inflammation markers, finding that dietary quality’s impact on diabetes may be partially mediated by WBC, neutrophils, monocytes, NLR and SII, except for C-reactive protein. Our study is among the few exploring links between dietary indices and inflammation, with results consistent with a prior NHANES prospective study using HEI. The study showed a higher HEI score was associated with lower inflammation and greater mortality risk reduction(Reference Wang, Page and Gill31). Accumulating evidence highlights inflammation’s role in T2DM pathogenesis. SII has been linked to diabetes risk in NHANES populations(Reference Nie, Zhou and Wang32), while NLR and PLR show associations in Turkish and Chinese cohorts(Reference Mertoglu and Gunay33,Reference Zhang, Chen and Cui34) . Our findings align with published studies demonstrating potential associations between systemic inflammation markers (NLR, MLR, PLR, SII and SIRI) and diabetes risk.
Notably, NLR and SII may partially mediate the association between HEI and diabetes. Among the three dietary indices, potential indirect effects of systemic inflammation markers were only observed for the HEI, not for the DQI or DBI. This could stem from differences in index components. Compared with DQI and DBI, HEI places greater emphasis on fruits, vegetables, seafood and plant-based proteins, which are food groups most strongly linked to inflammation regulation. We explored the independent associations of fruit and vegetable scores from the three dietary indices with inflammatory markers. The results showed that fruit and vegetable scores were significantly inversely correlated with a wide range of inflammatory markers. Potential mechanisms linking the intake of plant-based foods (including fruits and vegetables) to inflammatory responses have also been widely explored in previous studies. Higher intakes of fruit and vegetables lead to both a reduction in proinflammatory mediators and an enhanced immune cell profile. Fruit and vegetables are rich dietary sources of various immune-protective substances such as fibre, folate and vitamins, as well as nonnutrient phytochemicals, including carotenoids and flavonoids, such as β-carotene, anthocyanins, flavanols and flavanones. These substances can have profound effects on cellular growth and differentiation, and are needed for the optimal functioning of the immune system(Reference Hosseini, Berthon and Saedisomeolia35). In addition, antioxidant phenolic compounds can directly scavenge reactive oxygen species, such as hydroxyl radicals and superoxide anions. Moreover, these compounds modulate key signalling pathways, including AMP-activated protein kinase (AMPK), PI3K/Akt and NF-κB/Nrf2, thereby improving insulin sensitivity, inhibiting the expression of pro-inflammatory cytokines, and restoring redox balance(Reference Sazzad, Akter and Mohiuddin36).
T2DM represents a critical clinical and public health challenge worldwide. Lifestyle interventions, particularly dietary improvements, are essential strategies for preventing T2DM, mitigating adverse health outcomes, and optimising long term health. This population-based cross-sectional study corroborates that improved dietary quality, as quantified by HEI, DQI and DBI, serves as an independent protective factor against hyperglycaemia and type 2 diabetes in the general Chinese population. Clinically, the stronger inverse association of DQI with diabetes risk underscores the necessity of prioritising dietary diversity and overall dietary balance in dietary intervention strategies, rather than merely focusing on nutrient adequacy or intake moderation. For middle-aged and elderly rural residents constrained by limited food accessibility and inherent dietary preferences, improving dietary diversity is strongly recommended to optimise suboptimal dietary patterns and reduce disease burden, rather than merely prioritising dietary adequacy and moderation. Additionally, mediation analysis concerning inflammatory markers indicates that HEI was more sensitively correlated with inflammatory indicators than DQI and DBI. This discrepancy may be attributed to the fact that HEI places greater emphasis on plant-based foods such as fruits and vegetables. These findings further highlight the distinct characteristics of different dietary indices, emphasising that index selection should be prudently considered in future nutritional epidemiological studies.
One of the advantages of this study was the comprehensive assessment of dietary quality using three complementary dietary quality indices. The HEI is an internationally validated tool that reflects overall diet adequacy and moderation. The DQI covers variety, adequacy, moderation and overall balance, supporting global diet quality monitoring and cross–national comparisons. Additionally, we used the DBI, which was specifically developed for Chinese populations based on national dietary guidelines. This multi–index approach minimised bias that may arise from reliance on a single scoring system and enabled both international comparability and population–specific interpretation, thereby strengthening the validity and robustness of dietary quality evaluation.
Several limitations should be acknowledged. First, the cross-sectional design cannot establish temporal sequence or causality among dietary quality, systemic inflammation and glycemic status. Although sensitivity analyses were performed, reverse causality cannot be completely ruled out. Furthermore, mediation analysis based on cross-sectional data represents only an exploratory analysis, and causal interpretations cannot be made. Prospective or interventional studies are needed to confirm these findings. Second, dietary intake was assessed using FFQ. While FFQ is valid for evaluating population–level dietary patterns, it is subject to self–report bias, including recall error and social desirability bias. Furthermore, salt intake was not directly measured, resulting in incomplete salt–related components in the dietary indices, which may have attenuated the integrity of index scoring. Third, despite the large sample size of over 20 000 participants providing sufficient statistical power and stable effect estimates, the study was conducted in a single region of Southeast China, which may limit the generalizability of findings to other regions or populations in China.
Conclusion
In conclusion, consistent inverse associations were observed between greater dietary quality (assessed by HEI, DQI and DBI) and the prevalence of T2DM. Inflammation biomarkers showed significant associations with both diet quality and T2DM risk. The association of diet quality with T2DM risk appears to be partially mediated by systemic inflammation. Our findings reinforce the role of healthy diets in T2DM prevention in Asia, particularly in China, which is experiencing rapid dietary transitions and a growing diabetes burden.
Supplementary material
For supplementary material/s referred to in this article, please visit https://doi.org/10.1017/S0007114526108605
Data availability statement
The anonymised datasets generated and/or analysed during the current study are available from the corresponding author upon reasonable request.
Acknowledgements
We would like to express our sincere appreciation to the participants, researchers and support staff of the Fuqing Cohort Study for their valuable contribution to the research.
Financial support
This study was supported by The National Key R&D Program of China (No. 2024YFC3405800) and the National Nature Science Foundation of China (No. 82373564).
Author contributions
FQL and WMY conceived and designed the study and wrote the manuscript. ZQL and QFL performed data analysis. XYH, JMG and QLS helped with data collection. SSD and WHQ conducted interpretation of data and critical revision of the study material. All authors read and approved the final manuscript.
Competing interests
The authors declare that they have no competing interests.




 Open access

