


I. Introduction
Conventional wisdom holds that firm-level idiosyncratic risk, particularly rare, firm-specific tail shocks, can be diversified away. However, periods of market stress tend to be strikingly consistent: many firms experience unusually negative returns at the same time, and these fluctuations cannot be explained by volatility alone. This means that tail events, which appear diversifiable in isolation, become systemic in aggregate. In this article, we examine this phenomenon and ask whether a common factor exists in the tails of firm-level idiosyncratic returns that is relevant for investors. We also consider what economic state this tail comovement reflects.
To address these issues, we introduce a nonparametric measure of common idiosyncratic tail risk. After removing standard linear factors from individual stock returns, we follow Chen, Dolado, and Gonzalo (Reference Chen, Dolado and Gonzalo2021) and estimate a quantile factor model on rolling windows to extract the dominant factor of the cross-sectional conditional quantiles of the idiosyncratic return distributions. We refer to this latent factor as the common idiosyncratic quantile (CIQ) factor. Our focus is on innovations, and we orient the factors so that they positively correlate with the corresponding realized cross-sectional quantile of idiosyncratic returns. This means that a decline in the lower-tail factor corresponds to a general deterioration in downside idiosyncratic conditions. The key empirical object is each stock’s exposure to innovations in the downside CIQ, which is estimated using time series regressions and is then used to form out-of-sample portfolios.
Our first set of results shows that the downside idiosyncratic tail comovement is priced effectively. Sorting stocks according to their exposure to lower-tail CIQ innovations reveals a consistent pattern of average returns and a high-minus-low spread of approximately 7%–8% per year. In contrast, no premium is earned with exposure to median and upper-tail CIQ innovations, and the risk price is small and statistically insignificant. This asymmetry is difficult to reconcile with a purely volatility-driven narrative. The premium remains substantial even when controlling for standard factor models, the common idiosyncratic volatility reported in Herskovic, Kelly, Lustig, and Van Nieuwerburgh (Reference Herskovic, Kelly, Lustig and Van Nieuwerburgh2016), and significant downside and tail-risk measures, such as the tail-risk factor reported by Kelly and Jiang (Reference Kelly and Jiang2014). The premium is also robust across quantile thresholds: it is concentrated in the lower tail and diminishes as the quantile threshold approaches the center of the distribution.
We find that the lower-tail CIQ deteriorates when intermediary capital is weak and market liquidity is low and that firms with fragile trading conditions and limited financial slack have the strongest downside-CIQ exposures. Consistent with these findings, we provide a potential economic mechanism based on intermediary asset pricing and systemic fragility. In intermediary models such as those developed by He and Krishnamurthy (Reference He and Krishnamurthy2013), Brunnermeier and Sannikov (Reference Brunnermeier and Sannikov2014), and He, Kelly, and Manela (Reference He, Kelly and Manela2017), shocks to the intermediary net worth tighten risk-bearing constraints and cause the price of risk to increase. We demonstrate that the cross-sectional distribution of idiosyncratic stock returns encompasses a related state variable: a shared element in firms’ left-tail idiosyncratic quantiles. In a simple intermediary fragility setting, a single constraint multiplier shifts the lower-tail CIQ factor, affecting corresponding quantiles across assets; the implied quantile representation links innovations in this fragile state to innovations in the lower-tail CIQ factor.
Finally, the same state variable is important for aggregate risk premia. Innovations in the lower-tail CIQ factor forecast future market excess returns; when downside idiosyncratic tail risk worsens, subsequent aggregate returns increase. This predictive relationship is economically significant and remains consistent in both the in-sample and out-of-sample tests. In contrast, the predictability of the upper-tail CIQ factor is weaker and less stable.
Our results contribute to several areas of literature. First, we present a novel, distribution-sensitive measure of common idiosyncratic risk that does not depend on parametric tail assumptions or options data and distinguishes between downside and upside tail comovement. Second, we demonstrate that a significant premium exists with exposure to innovations in the downside CIQ that differs from that of standard factors, volatility-based idiosyncratic risk, and existing tail-risk measures. Third, we provide economic content for the factor by linking it to intermediary risk-bearing capacity and liquidity and by demonstrating that firm-level exposures correspond to balance sheet and trading fragility characteristics. Fourth, we demonstrate that innovations in downside CIQ forecast the aggregate equity premium, thereby connecting cross-sectional pricing and time series predictability via a single stress-related state variable.
II. Common Idiosyncratic Quantile Factors: Asymmetric Idiosyncratic Risk
Standard linear factor models summarize risk through variation, implicitly treating downside and upside outcomes as symmetric mirror images. Our approach, however, focuses on common shifts in the tails of the cross-sectional distribution of idiosyncratic returns. This approach retains directional information in adverse and favorable states, providing a more detailed characterization of systematic risk than volatility-based measures do.
A. Factor Specification
For each month
$ m $
 and every stock
$ i $
 , we use a rolling window of 60 months and retain stocks for which complete observations within the window are available. Within each window, we estimate a baseline factor model and save the residuals:

We use the 3-factor model reported in Fama and French (Reference Fama and French1993) (FF3) as our baseline model, as it aligns our approach with the literature on commonality in idiosyncratic risks and tail exposures (e.g., Ang, Hodrick, Xing, and Zhang (Reference Ang, Hodrick, Xing and Zhang2006), Kelly and Jiang (Reference Kelly and Jiang2014)). Moreover, increasing the baseline factor set has only a modest effect on the time variation in realized idiosyncratic quantiles, and FF3 provides a transparent benchmark for evaluating the additional information provided by tail-based factors. In Section V.A, we demonstrate that our pricing results remain robust when richer linear specifications, including the 5- and 6-factor models reported in Fama and French (Reference Fama and French2015), (Reference Fama and French2018), are used.Footnote 1
We study common tail variation using the residuals
$ {e}_{i,t} $
 from equation (1). As in principal component analysis, we standardize these residuals by their within-window standard deviation.Footnote
2 For a probability level
$ \tau \in \left(0,1\right) $
 in the current month
$ m $
 , we estimate a CIQ factor
$ {CIQ}_{t,m}\left(\tau \right) $
 via the following:

where
$ {u}_{i,t,m}\left(\tau \right) $
 satisfies the quantile restriction
$ P\left\{{u}_{i,t,m}\left(\tau \right)<0|{CIQ}_{t,m}\left(\tau \right)\right\}=\tau $
 . We estimate
$ {CIQ}_{t,m}\left(\tau \right) $
 and
$ {\gamma}_{i,m}\left(\tau \right) $
 using the quantile factor analysis procedure detailed in Chen et al. (Reference Chen, Dolado and Gonzalo2021).Footnote
3 At each
$ \tau $
 , we use only the first (most informative) factor. In our applications, using the factor-number selection procedures detailed in Chen et al. (Reference Chen, Dolado and Gonzalo2021), a single factor for the residual-quantile panels is almost always selected.
In the baseline analysis, we focus on three CIQ factors. We capture common movements in adverse idiosyncratic outcomes using the lower-tail factor at
$ \tau =0.2 $
 ,
$ {CIQ}^{LT}\equiv CIQ(0.2) $
 . This choice is motivated by i) evidence that disappointment-type preferences are linked to approximately the worst 20% of outcomes in several asset-pricing settings,Footnote
4 ii) its close relationship to other downside quantiles below the median (e.g.,
$ \tau =0.1 $
 and
$ \tau =0.3 $
 ), and iii) the practical trade-off between focusing on tail events and retaining sufficient observations for precise estimation. As a counterpart capturing common upside movements, we define the upper-tail factor at
$ \tau =0.8 $
 ,
$ {CIQ}^{UT}\equiv CIQ(0.8) $
 , and we define the central factor at
$ \tau =0.5 $
 ,
$ {CIQ}^C\equiv CIQ(0.5) $
 , to summarize movements in the middle of the idiosyncratic return distribution.
Quantile factors can be identified only up to their sign. We impose a normalization that gives their movements an economically meaningful direction. Specifically, each CIQ factor is oriented so that it is positively correlated with the corresponding cross-sectional realized quantile of idiosyncratic returns. For the lower-tail factor, this means that a decline in
$ {CIQ}_t^{LT} $
 indicates a deterioration in downside idiosyncratic outcomes across firms. For the upper-tail factor, an increase in
$ {CIQ}_t^{UT} $
 corresponds to an improved residual upside potential. This directional information is precisely what cannot be preserved by symmetric dispersion measures.
In line with the volatility factor literature, we focus on innovations in conditional idiosyncratic quantile factors:

and conduct our baseline analysis using
$ \Delta {CIQ}_{t,m}\left(\tau \right) $
 rather than levels.Footnote
5 This choice reflects the standard idea that investors are compensated for exposure to innovations in systematic risk, as set out in the ICAPM of Merton (Reference Merton1973) and commonly used in volatility-based settings (e.g., Ang, Hodrick et al. (Reference Ang, Hodrick, Xing and Zhang2006), Herskovic et al. (Reference Herskovic, Kelly, Lustig and Van Nieuwerburgh2016)). In our setting, factor levels can combine persistent distributional features with higher-frequency stress fluctuations. First differences emphasize the latter and yield a sharper proxy for shifts in tail conditions.Footnote
6 We repeat the steps in equations (1)–(3) until the whole data set is exhausted.
We estimate quantile-specific factors using idiosyncratic returns rather than raw returns for several reasons. First, this approach is consistent with the literature on common movements in idiosyncratic volatility and tail risk.Footnote 7 Second, quantiles depend on both location and scale; thus, by removing well-documented linear risk exposures, distributional variation is isolated beyond the mean. Third, linear factor models provide a familiar benchmark against which the additional content of tail-based factors can be evaluated. Finally, since exposures to common linear factors are often easy to hedge, working with residuals enables us to study tail variations that are not mechanically spanned by standard factor structures.
Our framework is nonparametric: it relies on conditional quantiles of observed returns and does not impose a parametric structure for nonlinear dependence.Footnote 8 Quantiles provide information about a range of distributional features, including but not limited to volatility. Under a location-scale model, common movements in quantiles are tightly linked to common movements in volatility, which is consistent with the factor structure in idiosyncratic volatility (e.g., Ang, Hodrick et al. (Reference Ang, Hodrick, Xing and Zhang2006)). In this special case, a volatility factor can be recovered by principal components applied to squared residuals (PCA-SQ).
When higher-order features matter, however, volatility-based methods may miss economically relevant tail risks. Quantile factor models remain informative by directly targeting distributional shifts beyond the first two moments.Footnote 9
B. Data and Descriptive Statistics
We estimate CIQ factors using monthly CRSP stock returns from January 1963 to December 2024. We include common stocks (share codes 10 and 11), adjust them for delistings following Bali, Engle, and Murray (Reference Bali, Engle and Murray2016), and keep only nonpenny stocks with prices above $1 to mitigate microstructure-related biases.Footnote 10 With a 60-month rolling window, the first set of returns that we are able to predict occurred in January 1968.
Figure 1 plots the lower-tail, central, and upper-tail CIQ factors alongside a volatility-based benchmark (PCA-SQ).Footnote 11 Two features stand out. First, CIQ factors exhibit pronounced variation and spikes around major intermediary-based stress episodes, such as those between 2007 and 2009. This is consistent with state-like shifts in cross-sectional tail conditions. Second, the lower- and upper-tail factors are not mirror images, indicating that the downside and upside tail states are distinct.Footnote 12
Figure 1 captures the lower-tail (
$ \tau =0.2 $
 ), central (
$ \tau =0.5 $
 ), and upper-tail (
$ \tau =0.8 $
 )
$ CIQ\left(\tau \right) $
 factors, alongside the PCA-SQ factor. The factors are estimated on monthly idiosyncratic returns with respect to the 3-factor model developed by Fama and French (Reference Fama and French1993) on the basis of either the quantile factor analysis suggested by Chen et al. (Reference Chen, Dolado and Gonzalo2021) (CIQ) or a principal component analysis using squared idiosyncratic returns (PCA-SQ). Factors are estimated using a rolling window of 60 months. In each window, the last estimated value is plotted. Central CIQ and PCA-SQ are standardized to have 0 mean and same volatility as the lower-tail CIQ factor. The data come from the CRSP and cover the period from January 1968 to December 2024. We exclude penny stocks with prices of $1 or less. The shaded areas represent NBER recessions.

FIGURE 1 Long description
The graph features a horizontal X-axis representing years from 1970 to 2025 in five-year increments and a vertical Y-axis labeled Factor ranging from minus 2 to 3.
Four distinct line series are plotted:
* Upper-Tail C I Q (light green): Positioned highest on the graph, fluctuating primarily between 0.5 and 1.5 with a significant peak exceeding 2.0 around the year 2000.
* Central C I Q (orange): Oscillates around the 0 line with moderate volatility.
* P C A-S Q (dark blue): Closely follows the Central C I Q line but exhibits sharper, more extreme upward spikes, particularly during the early 1990s, 2000, and 2008.
* Lower-Tail C I Q (dark red): Positioned lowest on the graph, fluctuating between minus 0.5 and minus 1.5, showing downward spikes that often mirror the upward spikes of the other factors.
Vertical gray shaded bars indicate N B E R recession periods, which frequently coincide with increased volatility or extreme peaks and troughs in the factor lines, most notably during the 1974, 1980, 1982, 1991, 2001, 2008, and 2020 periods.
Panel A of Table 1 summarizes the distributional properties of the
$ \Delta CIQ $
 factors. The standard deviations are large relative to the means, kurtosis exceeds 3, and first-order autocorrelations are negative, indicating that tail innovations are short-lived and mean-reverting. Panel B shows that
$ \Delta {CIQ}^{LT} $
 and
$ \Delta {CIQ}^{UT} $
 are only weakly correlated (0.13), rejecting the view that the two series simply rescale a common dispersion factor. The correlations with increments of the volatility benchmark (
$ \Delta $
 PCA-SQ) are economically meaningful and vary by tail, as expected, since quantiles partly reflect variance but also contain tail-specific information. The correlations with prominent idiosyncratic volatility and tail-risk factors are moderate to small, highlighting that CIQ innovations are related to, but not subsumed by, existing measures. Panel C links
$ \Delta CIQ $
 to forward-looking uncertainty measures. A higher
$ {\mathrm{VIX}}^2 $
 at the end of month
$ t $
 predicts a decline in the lower-tail factor in
$ t+1 $
 , that is, a worsening of downside idiosyncratic tail conditions, with similar patterns for its components. In contrast, the upper-tail factor has a weak or no predictive relationship with these measures. Similar asymmetry appears for narrative-based volatility (Manela and Moreira (Reference Manela and Moreira2017)): topics related to Securities Markets and Intermediation predict deterioration in lower-tail idiosyncratic conditions, while the upper tail remains largely unrelated.

TABLE 1 Long description
The table is divided into three sections.
Panel A: Descriptive Statistics.
* Mean times 10 super 3: Lower-Tail -3.21, Central -41.48, Upper-Tail -8.34.
* Standard Deviation: Lower-Tail 0.19, Central 1.46, Upper-Tail 0.23.
* Skewness: Lower-Tail 0.06, Central -0.35, Upper-Tail -0.05.
* Kurtosis: Lower-Tail 5.09, Central 6.41, Upper-Tail 6.86.
* Minimum: Lower-Tail -0.74, Central -7.68, Upper-Tail -1.27.
* Maximum: Lower-Tail 0.99, Central 5.63, Upper-Tail 1.12.
* Autocorrelation A R (1): Lower-Tail -0.44, Central -0.27, Upper-Tail -0.42.
Panel B: Contemporaneous Correlations.
* Correlation between Lower-tail and Central is 0.22, and with Upper-tail is 0.13.
* Correlation between Central and Upper-tail is 0.41.
* Delta P C A S Q shows a strong positive correlation with Upper-Tail (0.50) and negative with Lower-Tail (-0.42).
* Delta C I V shows a negative correlation with Lower-Tail (-0.26) and positive with Upper-Tail (0.29).
* Delta T R correlates positively with Lower-Tail (0.09) and negatively with Upper-Tail (-0.24).
Panel C: Forward Correlations.
* V I X squared correlates negatively with Lower-Tail (-0.17) and Central (-0.19).
* N V I X squared correlates negatively with Lower-Tail (-0.13) and Central (-0.07).
* Topic decompositions like Securities markets and Unclassified show significant negative correlations with the Lower-Tail factor.
Finally, CIQ factors capture realized cross-sectional tail quantiles more precisely than volatility does: the lower-tail CIQ factor explains a greater proportion of the variation in realized lower-tail quantiles than cross-sectional volatility does. Furthermore, monthly Anderson–Darling tests consistently reject the normality of the cross-sectional idiosyncratic return distribution, emphasizing the need to move beyond variance-based summaries. The incremental value of CIQ is particularly evident in the lower tail, whereas upper-tail quantiles are closer to those that can be captured by volatility alone.Footnote 13
III. Pricing the CIQ Risks in the Cross Section
We now investigate the pricing implications of exposure to CIQ risks. We hypothesize that there will be significant price heterogeneity associated with the lower, central, and upper portions of the cross-sectional distribution of idiosyncratic returns. Specifically, we show a strong asymmetric effect of only exposure to common lower-tail CIQ innovations being systematically priced and distinct from existing volatility, intermediary, and liquidity factors. Importantly, tail-based proxies cannot account for this pricing effect either.
A.
$ \Delta $
 CIQ Betas

To measure stock sensitivities to the lower-tail (
$ \Delta {CIQ}^{LT} $
 ), central (
$ \Delta {CIQ}^C $
 ), and upper-tail (
$ \Delta {CIQ}^{UT} $
 ) factors, each month
$ m $
 , we separately estimate factor loadings using time series regressions of excess returns on the corresponding CIQ innovations as follows:

for each
$ j\in LT,C, UT $
 , where
$ {\beta}_{i,j,m}^{CIQ} $
 captures stock
$ i $
 ’s exposure to quantile-specific innovations in common idiosyncratic risk.Footnote
14 Betas are estimated over the same 60-month rolling window used to construct the CIQ factors, including stocks with at least 48 monthly observations. Factor realizations and betas estimated using information up to time
$ m $
 are used to predict returns in month
$ m+1 $
 , ensuring no overlap between estimation and prediction periods. Unless stated otherwise, the dependent variable is the 1-month-ahead out-of-sample return. We also examine longer-horizon returns using portfolios to assess the persistence of the
$ \Delta CIQ $
 exposures and, indirectly, the role of trading frictions.
The data cover the usual cross-sectional asset pricing period between January 1963 and December 2024. The first returns that we predict pertain to January 1968. In total, our baseline data set without penny stocks consists of 2,082,857 stock-month observations.
B. Univariate Portfolio Sorts
We start our analysis by investigating the performance of portfolios formed on the basis of the
$ \Delta CIQ $
 betas. Each month, stocks are sorted into five or ten portfolios according to their
$ \Delta $
 CIQ betas estimated using information available up to time
$ m $
 .Footnote
15 The portfolios are formed at the end of month
$ m $
 and held during month
$ m+1 $
 , with returns computed using either equal- or value-weighted schemes based on market capitalization at formation. Portfolios are rebalanced monthly as the betas are re-estimated using a rolling window. These univariate portfolio results are summarized in Table 2. In Panel A, we report decile sorts. For the lower-tail
$ \Delta CIQ $
 factor, we observe a monotonic increase in returns from low- to high-exposure portfolios, whereas no significant return spread is observed for portfolios sorted on the central or upper-tail
$ \Delta CIQ $
 factors.

TABLE 2 Long description
The table is organized into two main sections: Panel A (Decile Sorts) and Panel B (Quintile Sorts). The columns are divided into three major categories: Lower-Tail (beta sub L T super C I Q), Central (beta sub C super C I Q), and Upper-Tail (beta sub U T super C I Q). Each category includes three sub-columns: the beta value, E W (equally weighted returns), and V W (value-weighted returns).Panel A. Decile Sorts:* Low beta C I Q: Lower-Tail (beta -0.29, E W 4.36, V W 3.36), Central (beta -0.03, E W 6.90, V W 5.02), Upper-Tail (beta -0.13, E W 8.86, V W 7.23).* Deciles 2 through 9 show a general trend of increasing beta values and varying returns.* High beta C I Q: Lower-Tail (beta 0.14, E W 11.77, V W 10.73), Central (beta 0.03, E W 9.26, V W 9.39), Upper-Tail (beta 0.21, E W 8.43, V W 6.35).* High minus Low: Lower-Tail (E W 7.41, V W 7.36), Central (E W 2.36, V W 4.37), Upper-Tail (E W -0.43, V W -0.88).* t-statistic: Lower-Tail (E W 4.30, V W 2.73), Central (E W 1.36, V W 1.82), Upper-Tail (E W -0.26, V W -0.35).Panel B. Quintile Sorts:* Low beta C I Q: Lower-Tail (beta -0.23, E W 6.15, V W 5.89), Central (beta -0.02, E W 7.98, V W 5.08), Upper-Tail (beta -0.09, E W 9.48, V W 8.34).* Quintiles 2 through 4 show intermediate values.* High beta C I Q: Lower-Tail (beta 0.09, E W 11.59, V W 9.98), Central (beta 0.02, E W 9.78, V W 7.57), Upper-Tail (beta 0.17, E W 9.09, V W 6.35).* High minus Low: Lower-Tail (E W 5.44, V W 4.09), Central (E W 1.80, V W 2.49), Upper-Tail (E W -0.39, V W -1.99).* t-statistic: Lower-Tail (E W 3.76, V W 2.04), Central (E W 1.36, V W 1.44), Upper-Tail (E W -0.29, V W -1.12).
Panel A (Decile Sorts):
- Low beta portfolios start with returns of 4.36 (E W) and 3.36 (V W) for Lower-Tail; 6.90 (E W) and 5.02 (V W) for Central; and 8.86 (E W) and 7.23 (V W) for Upper-Tail.
- High beta portfolios reach returns of 11.77 (E W) and 10.73 (V W) for Lower-Tail; 9.26 (E W) and 9.39 (V W) for Central; and 8.43 (E W) and 6.35 (V W) for Upper-Tail.
- The High minus Low row shows a spread of 7.41 (E W) and 7.36 (V W) for Lower-Tail, with t-statistics of 4.30 and 2.73 respectively. Central and Upper-Tail spreads are lower or negative.
Panel B (Quintile Sorts):
- Low beta portfolios show returns of 6.15 (E W) and 5.89 (V W) for Lower-Tail; 7.98 (E W) and 5.08 (V W) for Central; and 9.48 (E W) and 8.34 (V W) for Upper-Tail.
- High beta portfolios show returns of 11.59 (E W) and 9.98 (V W) for Lower-Tail; 9.78 (E W) and 7.57 (V W) for Central; and 9.09 (E W) and 6.35 (V W) for Upper-Tail.
- The High minus Low row shows a spread of 5.44 (E W) and 4.09 (V W) for Lower-Tail, with t-statistics of 3.76 and 2.04. Central and Upper-Tail spreads remain lower or negative.
Moreover, to formally assess the presence of compensation for bearing the CIQ risks, we present the returns of the high-minus-low portfolios obtained as the difference between the returns of portfolios with the highest
$ \Delta $
 CIQ betas and those of portfolios with the lowest
$ \Delta $
 CIQ betas. These returns correspond to the investment strategy that involves buying stocks with high exposures and selling stocks with low exposures to the
$ \Delta $
 CIQ factors. These portfolios are zero-cost portfolios and capture the risk premium associated with the specific joint movements of the idiosyncratic returns. We observe a significant positive premium for the difference portfolio only for the lower-tail
$ \Delta $
 CIQ factor. This premium is both economically and statistically significant. In the case of the decile equal-weighted portfolio, the premium reaches 7.41% on an annual basis with a robust
$ t $
 -statistic on the basis of the standard error correction suggested by Newey and West (Reference Newey and West1987) with 6 lags of 4.30. The premium of the value-weighted portfolio achieves a similar performance of 7.36% p.a. with a
$ t $
 -statistic of 2.73. The stocks that hedge the lower-tail CIQ movements possess particularly low excess returns. Investors clearly value this feature, which increases the prices of these stocks and decreases their expected returns.
We also observe a sizable spread in the exposures across the portfolios captured by the time series average of equal-weighted stock-level betas within portfolios during the formation period. The low-exposure portfolio has an average
$ {\beta}_{LT}^{CIQ} $
 of −0.29, which is the greatest difference with respect to a neighborhood portfolio across all the portfolios (the second-lowest-exposure portfolio has an average
$ {\beta}_{LT}^{CIQ} $
 of −0.17, a difference of 0.12).
To show that the premium is not driven by a particular choice of the sorting scheme, in Panel B, we report the results from sorting the stocks into quintiles. Although the premium is smaller than in the case of decile sorting, it remains both economically and statistically significant at 5.44% p.a. with a
$ t $
 -statistic of 3.76 in the case of an equal-weighted portfolio and 4.09% p.a. with a
$ t $
 -statistic of 2.04 in the case of a value-weighted portfolio. This slightly lower significance in the case of the value-weighted portfolio may be partially caused by the fact that the value-weighted portfolios are more concentrated, which leads to more volatile returns.
On the other hand, if we consider the returns of the zero-cost portfolios associated with either central or upper-tail
$ \Delta $
 CIQ factors, these portfolios yield premia indistinguishable from 0. This observation holds across weighting and sorting schemes. The value investors place on exposures to downside and upside idiosyncratic events are clearly asymmetrical, and they clearly prefer to hedge against the former but not the latter. The fact that only the exposures to the lower-tail common movements yield a premium suggests that the
$ \Delta $
 CIQ risks are not driven by the effect of the common volatility. If volatility was the main driver of the factors, we would observe symmetrical compensation for the exposures to both the downside and upside factors, which we do not observe here. On the basis of this result, we argue that the typical location-scale model is not consistent with the premia that we observe here.Footnote
16
To visually inspect the performance of the portfolios sorted on the basis of their exposure to the
$ \Delta $
 CIQ factors, we present in Figure 2 the cumulative log-returns of the equal-weighted high-minus-low portfolios. Consistent with the numerical portfolio results, only the portfolio based on the lower-tail
$ \Delta $
 CIQ factor has a strong performance during the sample period that is no worse than the performance of the aggregate market as measured by the value-weighted return of all the CRSP firms.
Figure 2 depicts the performance of a strategy that buys stocks with high exposure to the
$ \Delta $
 CIQ factors and sells stocks with low exposure. It plots cumulative log-return obtained from sorting the stocks into decile portfolios with equal-weighting the stocks. The return sample covers the period between January 1968 and December 2024. Each month, we use all CRSP stocks with at least 48 monthly observations over the last 60 months and exclude penny stocks with prices of $1 or less. The shaded areas represent NBER recessions. We include the performance of the excess market return as a comparison.

FIGURE 2 Long description
A line graph with a horizontal X-axis representing years from 1970 to 2025 and a vertical Y-axis representing Cumulative Log-Return from negative 1 to 4. Vertical gray shaded bars indicate N B E R recession periods.
* Lower-Tail C I Q (dark red line with dots): Shows the highest overall growth, starting at 0 in 1968 and rising steadily to nearly 4 by 2024. It experiences minor dips during recessions but maintains a dominant upward trend.
* Market (blue line with plus signs): Follows a similar upward trajectory to the Lower-Tail C I Q but remains consistently lower, ending at approximately 3.2 in 2024. It shows significant volatility during the 2000 dot-com bubble and the 2008 financial crisis.
* Central C I Q (orange line with triangles): Exhibits much lower growth, fluctuating between 0 and 0.5 for most of the period before a sharp rise around 2020, ending near 1.0.
* Upper-Tail C I Q (light green line with squares): The lowest performing series, remaining near or below 0 for the entire duration. It shows a significant sharp decline during the 2020 recession, ending at approximately negative 0.6.
All series originate near the 0 point on the Y-axis in 1968. The gap between the high-performing Lower-Tail C I Q and the low-performing Upper-Tail C I Q widens significantly over time, particularly after 2000.
The newly discovered lower-tail
$ \Delta $
 CIQ premium raises the question of whether previously reported risks associated with a particular factor model are mirrored. Accordingly, we regress the returns of the high-minus-low portfolios on various sets of factors and report the estimated intercepts—alphas—from this exercise. We summarize the results in Table 3.Footnote
17 We report the annualized alphas for both the equal- and value-weighted portfolios that are sorted either in quintiles or deciles. We start the investigation by regressing the returns on the market factor (CAPM). We observe that the market factor is not able to explain the abnormal returns across specifications. We repeat the regressions on the basis of the 3-factor model developed by Fama and French (Reference Fama and French1993) (FF3), the 5-factor model developed by Fama and French (Reference Fama and French2015) (FF5), and its extension, incorporating the momentum factor following Fama and French (Reference Fama and French2018) (FF6). The alphas remain economically large and generally statistically significant; thus, standard Fama–French models do not span the lower-tail
$ \Delta $
 CIQ premium.

TABLE 3 Long description
The table is structured with 12 columns. The headers from left to right are: Sort, Weighting, C A P M, F F 3, F F 5, F F 6, F F alt., F F Rev., F F Liquid., Inter., Q 5, and M 4.
* Decile Sort, E W (Equal-Weighted): Alphas range from 5.94 (M 4) to 9.72 (C A P M). Corresponding t-statistics range from 3.17 to 6.39.
* Decile Sort, V W (Value-Weighted): Alphas range from 6.71 (F F 5) to 9.34 (Inter.). Corresponding t-statistics range from 2.56 to 3.82.
* Quintile Sort, E W (Equal-Weighted): Alphas range from 5.52 (M 4) to 7.35 (C A P M). Corresponding t-statistics range from 3.55 to 5.73.
* Quintile Sort, V W (Value-Weighted): Alphas range from 3.44 (F F 3) to 5.78 (C A P M). Corresponding t-statistics range from 2.04 to 3.04.
All alpha values are positive across all models and sorting methods. The t-statistics, provided in parentheses below each alpha, generally indicate statistical significance at standard levels.
Next, we extend the 4-factor model developed by Carhart (Reference Carhart1997) by augmenting it with the
$ \Delta $
 CIV idiosyncratic volatility factor found in Herskovic et al. (Reference Herskovic, Kelly, Lustig and Van Nieuwerburgh2016) and the BAB factor used by Frazzini and Pedersen (Reference Frazzini and Pedersen2014) (FF alt.). We then add either the short-term reversal (FF Rev.) or liquidity factor following Pastor and Stambaugh (Reference Pastor and Stambaugh2003) (FF Liquid). Similarly, we observe that the premia associated with these risks do not subsume the abnormal returns of the lower-tail
$ \Delta $
 CIQ portfolio.
We also verify that the premium does not mirror the risk premium associated with the benchmark two-factor intermediary pricing model developed by He et al. (Reference He, Kelly and Manela2017), which includes the market factor and traded capital factor. Finally, we also regress the portfolio returns on the 5-factor model developed by Hou et al. (Reference Hou, Mo, Xue and Zhang2020) (Q5) and the four factors of Stambaugh and Yuan (Reference Stambaugh and Yuan2016), which include two mispricing factors (M4). The results also suggest that these models do not span the abnormal premium associated with the lower-tail
$ \Delta $
 CIQ risk.Footnote
18
C. Fama–MacBeth Regressions
In the next step, we perform two-stage Fama and MacBeth (Reference Fama and MacBeth1973) predictive regressions. In contrast to portfolio sorting, this type of asset pricing test conveniently allows for the simultaneous estimation of many risk premia associated with various stock-level characteristics. This means that we can estimate the risk premium associated with the
$ \Delta $
 CIQ
$ {}^j $
 factors
$ j\in \left\{ LT,C, UT\right\} $
 while controlling for other risk measures that have previously been proposed in the literature. Specifically, for each time
$ t=1,\dots, T-1 $
 using all of the stocks
$ i=1,\dots, N $
 available at time
$ t $
 and
$ t+1 $
 ,Footnote
19 we cross-sectionally regress all the returns at time
$ t+1 $
 on the betas estimated using only the information available up to time
$ t $
 . This procedure yields estimates of the risk prices
$ {\lambda}_{t+1,j}^{CIQ} $
 while controlling for the most widely used measures of risk. More specifically, we use variations of the following cross-sectional regressions:

where
$ {Z}_{i,t} $
 is a vector of control variables and
$ {\lambda}_{t+1}^Z $
 is a vector of corresponding risk prices. Using
$ T-1 $
 cross-sectional estimates of the risk prices, we compute the average risk price associated with
$ {\lambda}_j^{CIQ} $
 as
$ {\hat{\lambda}}_j^{CIQ}=\frac{1}{T-1}{\sum}_{t=2}^T{\hat{\lambda}}_{t,\ j}^{CIQ} $
 for each
$ j\in LT,C, UT $
 and report them alongside their
$ t $
 -statistics on the basis of robust standard errors following Newey and West (Reference Newey and West1987) with 6 lags. Moreover, unlike in the case of portfolio sorting, this setup enables us to jointly evaluate the risk premia of the
$ \Delta $
 CIQ factors by including them simultaneously in the regressions.
We summarize the first set of results in Panel A of Table 4, where we report the estimation outcomes of the regressions with general risk measures. First, by considering the settings featuring all three
$ \Delta $
 CIQ exposures, we observe that only the lower-tail exposure significantly predicts future returns, with a coefficient of 1.26 (
$ t $
 -stat of 2.78). Adding idiosyncratic volatility, total and idiosyncratic skewness, and market beta to the regression does not alter the results, and the coefficient for lower-tail exposure is 0.82 (
$ t $
 -stat of 2.68) in the full setting. On the other hand, exposures to the central or upper-tail
$ \Delta $
 CIQ factors remain unpriced.

TABLE 4 Long description
The table is divided into two sections: Panel A for Risk Characteristics and Panel B for Nonlinear Risk Measures. Each panel lists regression coefficients with t-statistics in parentheses below them.
Panel A: Risk Characteristics (Models 1 to 9)
* beta sub L T super C I Q: Coefficients range from 0.81 to 1.32. Model 1 shows 1.32 (3.38). Model 9 shows 0.82 (2.68).
* beta sub C super C I Q: Coefficients range from -0.06 to 3.32. Model 2 shows 3.32 (1.20).
* beta sub U T super C I Q: Coefficients are generally negative, ranging from -0.01 to -0.48.
* Controls: Includes I V O L, S K E W, I S K E W, and beta super C A P M. I V O L in Model 9 is -15.80 (-4.68).
* Intercept: Ranges from 0.80 to 1.15.
* Summary Stats: R sub adj super 2 percent ranges from 0.41 to 4.23. Average n is approximately 3,043 to 3,045. T is 684.
Panel B: Nonlinear Risk Measures (Models 1 to 8)
* beta sub L T super C I Q: Coefficients range from 0.94 to 1.48. Model 1 shows 1.32 (3.38).
* Nonlinear Factors: Includes C S K, C K T, S T R, M O M, beta super P C A minus S Q, beta super C I V, beta super V I X, beta super down, beta super tail, H T C R, M C R A S H, and P S S.
* Key results: S T R in Model 3 is -3.86 (-9.11). M O M in Model 3 is 0.64 (4.28). H T C R in Model 6 is 1.02 (2.75). M C R A S H in Model 7 is 2.39 (2.51).
* Intercept: Ranges from 0.57 to 2.11.
* Summary Stats: R sub adj super 2 percent ranges from 0.66 to 2.64. Average n varies from 2,039 to 3,045. T is 684, except for Model 4 which is 418.
In Panel B of Table 4, we focus on nonlinear risk measures that may be correlated with exposure to common idiosyncratic lower-tail movements.Footnote
20 We start by considering coskewness and cokurtosis, following the specifications reported in Harvey and Siddique (Reference Harvey and Siddique2000) and Dittmar (Reference Dittmar2002), respectively, and control for these measures simultaneously. We show that these measures do not drive out the significance of the lower-tail
$ \Delta $
 CIQ betas and neither factor is significant in this setting. Next, we consider the effect of a stock’s lagged return and its momentum (cumulative return over the past 12 months while excluding the most recent return). Both control variables are highly significant, but the lower-tail
$ \Delta $
 CIQ exposure remains significant, with a slightly diminished coefficient of 0.94 (
$ t $
 -stat of 2.67).
Next, we consider the simultaneous effect of the exposures to three systematic volatility measures on the lower-tail premium: the
$ \Delta $
 PCA-SQ factor, the
$ \Delta $
 CIV factor of Herskovic et al. (Reference Herskovic, Kelly, Lustig and Van Nieuwerburgh2016), and the
$ \Delta $
 VIX factor. We conclude that the lower-tail factor reveals different pricing information because neither its magnitude nor its significance decreases when exposure to volatility is taken into account. The common distribution must be investigated in further depth if pricing information regarding the common distributional movements is to be identified.
Similarly, we jointly consider exposure to the tail-risk factor reported in Kelly and Jiang (Reference Kelly and Jiang2014) and the downside beta reported in Ang, Chen, and Xing (Reference Ang, Chen and Xing2006). The results show that these two measures do not drive out the effect of the lower-tail
$ \Delta $
 CIQ betas, which remains significant, similar to the univariate specification.
Finally, we consider the following three measures separately: the hybrid tail covariance risk (HTCR) proposed by Bali, Cakici, and Whitelaw (Reference Bali, Cakici and Whitelaw2014), the multivariate crash risk (MCRASH) reported in Chabi-Yo, Huggenberger, and Weigert (Reference Chabi-Yo, Huggenberger and Weigert2022), and the predicted systematic skewness (PSS) employed in Langlois (Reference Langlois2020). Although the HTCR and MCRASH are highly relevant for determining expected returns, these factors do not alter the effect of CIQ
$ \left(\tau \right) $
 risk.
In Table F1 in Appendix F, we also investigate whether firm-specific characteristics based on accounting and trading information can capture the lower-tail premium. We conclude that the premium is robust to the inclusion of the variables considered.
Using portfolio sorts and firm-level cross-sectional regressions, we showed that exposure to common downside idiosyncratic tail risk is significantly priced in the cross section of stock returns. Assets with higher exposure to lower-tail
$ \Delta CIQ $
 innovations earn higher expected returns, whereas those with higher exposure to upper-tail or central CIQ innovations earn no significant premium. Importantly, this pricing effect is not subsumed by common volatility or other existing measures of aggregate risk, reinforcing the conclusion that downside CIQ captures economically distinct information.
IV. Economic Origins of the CIQ Risks
We now investigate the economic origins of the lower-tail CIQ premium that we observe in the data. We start by providing time series evidence that points toward an intermediary-based mechanism. Next, we identify firm characteristics associated with exposure to common idiosyncratic tail movements, clarifying which firms are most vulnerable to
$ \Delta $
 CIQ risk. By doing so, we provide further evidence in favor of the intermediary-based explanation of the observed premium. Finally, we provide a theoretical mechanism consistent with our empirical findings.
A. CIQ Risks in the Economy: Time Series Evidence
We link the lower-tail CIQ innovations to proxies for intermediary constraints, uncertainty, and market-wide liquidity. Because constraints bind primarily on the downside, we expect the relationships for lower
$ \tau $
 values to be significant and those for upper-tail values to be insignificant. Motivated by theories in which adverse states amplify downside outcomes, we test whether
$ \Delta CIQ $
 innovations are predictable on the basis of intermediary balance-sheet conditions, aggregate uncertainty, and market-wide liquidity.
We estimate various versions of the following:

for
$ j\in \left\{ LT, UT\right\} $
 , where
$ {ICF}_t $
 is the intermediary capital factor of He et al. (Reference He, Kelly and Manela2017),
$ {VIX}_t^2 $
 controls for aggregate uncertainty, and
$ {X}_t $
 denotes alternative illiquidity measures based on Amihud (Reference Amihud2002): changes in average illiquidity
$ \Delta Avg{(ILLQ)}_t $
 , downside and upside illiquidity
$ \Delta Avg{(ILLQ)}_t^{-} $
 and
$ \Delta Avg{(ILLQ)}_t^{+} $
 (computed within negative- and positive-return stocks, respectively), and the change in illiquidity dispersion
$ \Delta Var{(ILLQ)}_t $
 .Footnote
21 The standard errors are from Newey and West (Reference Newey and West1994).
Panel A of Table 5 shows that the lower-tail factor is strongly mean-reverting (
$ {\beta}_1<0 $
 ) and, more importantly, is systematically related to financial conditions. A deterioration in intermediary capital predicts a decline in
$ \Delta {CIQ}^{LT} $
 (i.e., worse downside tail conditions), and a higher
$ {VIX}^2 $
 value similarly predicts a decline. Liquidity conditions add incremental predictive content: increases in average illiquidity predict decreases in
$ \Delta {CIQ}^{LT} $
 , and this effect is concentrated in sell-side illiquidity (
$ \Delta Avg{(ILLQ)}^{-} $
 ), which is consistent with an inherently asymmetric mechanism. In addition, increases in illiquidity dispersion predict decreases in
$ \Delta {CIQ}^{LT} $
 , indicating that downside tail conditions worsen when liquidity stress becomes uneven and widespread. The interaction terms imply state dependence: the predictive effect of weak intermediary capital is amplified when average illiquidity or illiquidity dispersion increases.

TABLE 5 Long description
The table is divided into Panel A and Panel B.
Panel A: Dependent Variable is Delta C I Q sub t plus 1 super L T.
- Independent variables include Delta C I Q sub t, I C F sub t, V I X sub t squared, and various cross-sectional liquidity measures like Delta Avg (I L L Q) sub t and Delta Var (I L L Q) sub t.
- Model 1 shows a coefficient for Delta C I Q sub t of minus 0.44 with a t-statistic of minus 13.20 and an R-squared adjusted of 19.29 percent.
- Model 4 includes I C F sub t (0.67) and V I X sub t squared (minus 0.71), reaching an R-squared adjusted of 33.74 percent.
- Models 8 and 9 include interaction terms with the capital factor, with I C F sub t times Delta Var (I L L Q) sub t showing a coefficient of 1.10 (t-statistic 10.25).
Panel B: Dependent Variable is Delta C I Q sub t plus 1 super U T.
- Delta C I Q sub t remains a significant predictor with coefficients around minus 0.44 across models.
- I C F sub t shows negative coefficients, such as minus 0.51 in Model 2.
- V I X sub t squared shows positive coefficients, such as 0.61 in Model 3.
- R-squared adjusted values are generally lower than in Panel A, ranging from 17.68 percent to 20.92 percent.
- Sample size T varies from 683 in Model 1 to 347 in Models 4 through 9.
Panel B reports analogous results for the upper-tail factor. While
$ \Delta {CIQ}^{UT} $
 is also mean-reverting, its relationship with intermediary capital and illiquidity is markedly weaker and less robust. In particular, the illiquidity variables that strongly predict the lower-tail factor have little explanatory power for the upper-tail factor, and interaction effects are negligible.
Taken together, the results reveal a pronounced asymmetry between downside and upside idiosyncratic dynamics. Innovations in the lower-tail CIQ factor are closely linked to intermediary balance-sheet conditions, aggregate uncertainty, sell-side liquidity stress, and general cross-sectional dispersion of illiquidity. In contrast, upside CIQ innovations exhibit substantially weaker connections to liquidity and intermediary constraints. This asymmetry suggests that the lower-tail CIQ factor relates to endogenous, liquidity-driven tail risk that emerges when intermediary capacity is strained, whereas upside tail realizations are less affected by these financial frictions.
Such asymmetry is consistent with the inherently one-sided nature of balance-sheet constraints. When intermediaries are constrained, selling pressure is amplified into large negative price movements, while there is no comparable mechanism through which buying is forced. As a result, intermediation stress manifests itself primarily through a deterioration of the lower tail of the cross-sectional distribution of idiosyncratic returns rather than through changes in the upper tail.
B. Cross-Sectional Determinants
Our cross-sectional pricing tests assume that firms differ in their exposure to the lower-tail
$ \Delta CIQ $
 factor. To understand the economic origins of this heterogeneity, we examine which firm characteristics are associated with sensitivity to common idiosyncratic tail movements. This analysis provides an economic interpretation of the
$ \Delta CIQ $
 factors by identifying firm attributes—such as liquidity fragility, financial slack, and vulnerability—that are systematically related to CIQ exposures and, ultimately, to the associated risk premium. Crucially, the results presented further align with the time series properties of CIQ risk, which are related to the intermediary-based interpretation.
We use a subset of firm characteristics from Freyberger, Neuhierl, and Weber (Reference Freyberger, Neuhierl and Weber2020) and Kim, Korajczyk, and Neuhierl (Reference Kim, Korajczyk and Neuhierl2020), and organize them into the following economically motivated channels suggested by the intermediary-liquidity mechanism: i) liquidity fragility and trading, ii) funding and financial slack, iii) risk controls, and iv) fundamental, vulnerability, and investment controls.
Footnote
22 Within each channel, we select a parsimonious set of representative variables to limit redundancy among highly correlated characteristics. We estimate monthly Fama–MacBeth regressions of firm-level CIQ betas on the basis of these characteristics after each characteristic is cross-sectionally ranked and scaled to the interval
$ \left(-1,+1\right) $
 . CIQ betas are similarly standardized, allowing coefficient magnitudes to be compared across specifications and across tails. Reported coefficients and
$ t $
 -statistics are obtained from the time series of monthly estimates using the corrections recommended by Newey and West (Reference Newey and West1994). Owing to data availability, the sample of characteristics spans the period between January 1968 and December 2018.
Table 6 shows that exposure to lower-tail CIQ risk is concentrated in firms with fragile trading conditions and limited financial slack. Measures of liquidity fragility—such as low turnover depth (dto and lturnover), high turnover volatility (std_turn), and elevated unexplained volume (suv)—are strongly associated with higher CIQ betas. Firms with greater financial flexibility, as measured by cash holdings (c), exhibit lower CIQ exposure levels, whereas firms with higher net payouts (nop) exhibit higher exposure levels. The market beta (beta) has a negative sign, which is consistent with the view that the CIQ exposure level is higher for stocks whose risk is less hedgeable and therefore more costly for intermediaries to warehouse during stress. Firms trading closer to recent price highs (rel_to_high_price) also exhibit greater lower-tail CIQ exposure, which is consistent with sharper valuation adjustments when downside risk materializes. Measures of fundamental vulnerability, such as industry-adjusted profit margins (pm_adj), further indicate that CIQ exposure is concentrated among firms more susceptible to funding-driven sell pressure.Footnote 23

TABLE 6 Long description
The table presents Fama MacBeth cross-sectional regression results. The top header divides the ten models into two main groups based on the dependent variable: beta L T C I Q (Models 1 to 5) and beta U T C I Q (Models 6 to 10). Each group includes sub-headers for Liquidity, Funding, Risk, Vulnerability, and Full models.Independent variables are grouped into four categories:* Liquidity Fragility: Includes d t o, lturnover, std_turn, and s u v. In Model 5 (Full), lturnover shows a coefficient of -0.24 (t-stat -10.27).* Funding and Financial Slack: Includes c and n o p. In Model 5, n o p has a coefficient of 0.07 (t-stat 3.83).* Risk Controls: Includes beta and Rel_to_high_price. In Model 5, beta has a coefficient of -0.04 (t-stat -8.45).* Vulnerability Control: Includes Pm_adj. In Model 5, it has a coefficient of -0.04 (t-stat -6.42).Bottom rows provide summary statistics:* Intercepts are consistently near -0.00 or 0.00 across all models.* R sub adj super 2 (%) ranges from 2.35 to 10.85 for beta L T and 1.44 to 5.87 for beta U T.* Average number of observations (n-bar) is 2,578 for all models.* Number of months (T) is 612 for all models.
Key variables and coefficients include:
* Liquidity fragility: d t o shows a coefficient of minus 0.02 (t-stat minus 7.94) in Model 1 and 0.01 (t-stat 2.35) in Model 6. lturnover shows minus 0.28 (t-stat minus 11.47) in Model 1 and 0.10 (t-stat 5.40) in Model 6.
* Funding and financial slack: c has a coefficient of minus 0.06 (t-stat minus 5.01) in Model 2. n o p has 0.11 (t-stat 3.49) in Model 2.
* Risk controls: beta has a coefficient of minus 0.10 (t-stat minus 13.05) in Model 3. Rel_to_high_price has 0.07 (t-stat 4.77) in Model 3.
* Vulnerability control: P m_adj has a coefficient of minus 0.06 (t-stat minus 5.39) in Model 4.
Summary statistics at the bottom show:
* R-squared sub adj ranges from 2.35% to 10.85% for the first dependent variable and 1.44% to 5.87% for the second.
* The average number of observations n-bar is 2,578 per month.
* The number of months T is 612.
The economic interpretation of CIQ further depends on whether these cross-sectional determinants are symmetric across return tails. If CIQ merely reflected a generic order flow or trading activity, similar characteristics would explain both downside and upside exposures. In contrast, theories of constrained intermediation predict strong asymmetries: downside order flow is amplified by forced selling and balance-sheet constraints, whereas upside order flow reflects discretionary trading in favorable states. Consistent with this prediction, the results of the Fama–MacBeth regressions for upper-tail exposures show that liquidity fragility and funding vulnerability lose explanatory power in the upper tail but load positively on turnover depth and the market beta.
This sharp contrast across tails reinforces the relationship between lower-tail
$ \Delta $
 CIQ and downside liquidity risk arising from constrained intermediation. These patterns support the interpretation of lower-tail CIQ betas capturing exposure to idiosyncratic downside sell pressure amplified by constrained intermediation rather than a generic volatility or value effect. CIQ-sorted portfolios tilt toward firms that are difficult to intermediate in stress states—stocks with fragile liquidity and limited financial slack—providing an economic foundation for the pricing results.
C. Theoretical Mechanism
Considering the previous results, we now present an economic mechanism that can rationalize the observed premium and is consistent with the observed empirical patterns. It is based on an intermediary-driven mechanism whereby financial intermediaries provide liquidity by absorbing inventory risk, subject to balance-sheet constraints. When intermediary capital deteriorates or aggregate uncertainty increases, these constraints tighten, reducing intermediaries’ willingness to absorb sell-side order flow. Consequently, negative idiosyncratic shocks are more likely to propagate into common downside tail realizations across assets, resulting in elevated price impact and transaction costs.
In this environment, the lower-tail CIQ factor captures situations in which the risk-bearing capacity of intermediaries is impaired and sell-side liquidity evaporates across the board. The significant impact of downside illiquidity and its dispersion reflects the uneven distribution of liquidation pressure among firms: when intermediaries are under pressure, heterogeneous sell pressure results in correlated downside tail outcomes. In contrast, positive idiosyncratic shocks do not face comparable balance sheet frictions, meaning that upside CIQ innovations are weakly related to liquidity conditions and do not command a risk premium.
From an asset-pricing perspective, exposure to lower-tail CIQ innovations means exposure to states in which liquidity provision is costly and intermediary capital is scarce. In such states, the stochastic discount factor (SDF) is high, meaning that assets that perform poorly when the lower-tail CIQ deteriorates require a higher expected return to compensate for this. The core mechanism is a state-dependent intermediary common stress intensity, which amplifies downside idiosyncratic realizations through forced selling but has limited relevance for upside quantiles.
Dynamic intermediary asset pricing models formalize this idea. In He and Krishnamurthy (Reference He and Krishnamurthy2013), Brunnermeier and Sannikov (Reference Brunnermeier and Sannikov2014), and He et al. (Reference He, Kelly and Manela2017), intermediary net worth or leverage acts as a state variable that drives the equilibrium risk premium. In the systemic-risk literature, measures such as CoVaR and SRISK similarly condense a high-dimensional system into a low-dimensional fragility index (Adrian and Brunnermeier (Reference Adrian and Brunnermeier2016), Giglio et al. (Reference Giglio, Kelly and Pruitt2016), and Acharya, Engle, and Richardson (Reference Acharya, Engle and Richardson2017)). Within our simple reduced-form theoretical setting, we assume that the lower-tail CIQ factor represents a reduced-form proxy for the shadow cost of intermediaries’ risk-bearing capacity. Nevertheless, we do not dismiss the possibility of a more general downside risk explanation of the observed risk premia.
1. A Reduced-Form Representation
Let
$ {\varepsilon}_{i,t} $
 denote the idiosyncratic return from a linear factor model
$ {r}_{i,t}={\alpha}_i+{\beta}_i^{\prime }\ {f}_t+{\varepsilon}_{i,t} $
 , where
$ {f}_{\hskip-0.29em t} $
 collects benchmark factors (e.g., Fama–French factors). We assume a latent systemic state
$ {s}_t\in \mathrm{\mathbb{R}} $
 that summarizes the tightness of intermediaries’ balance-sheet constraints. In fragile states (high
$ {s}_t $
 ), risk-bearing capacity is scarce: intermediaries absorb less inventory, funding becomes more expensive, and the sell-side price impact increases. These conditions affect firm-level downside risk through tighter credit lines, higher margins and haircuts, stricter lending standards, and weaker secondary-market liquidity. Consequently, firm-specific negative shocks are more likely to result in extreme residual losses, particularly for firms with high leverage, low cash reserves, or illiquid equity.
We model idiosyncratic returns as responses to the liquidity demand absorbed by competitive intermediaries as follows:

where
$ {u}_{i,t} $
 is the idiosyncratic liquidity demand,
$ {\xi}_{i,t} $
 is the idiosyncratic noise orthogonal to the liquidity demand, and
$ {\lambda}_t\left({s}_t\right)>0 $
 is a common price-impact coefficient (the shadow cost of the balance-sheet capacity). We assume that the price impact increases when the constraints are binding,
$ \partial {\lambda}_t/\partial {s}_t>0 $
 . This channel captures a common change in the scale of residual returns, akin to a volatility-type effect. On its own, however, it does not cause asymmetry between the downside and upside quantiles.
To capture the effects of asymmetric forced selling, we introduce a one-sided stress component to liquidity demand, as follows:

where
$ {\tilde{u}}_{i,t} $
 is the baseline demand,
$ {J}_t\left({s}_t\right)\ge 0 $
 is a common stress intensity,
$ {\eta}_{i,t}\ge 0 $
 is an idiosyncratic nonnegative shock, and
$ {\mathrm{\ell}}_i\ge 0 $
 captures liquidation sensitivity or liquidity fragility (e.g., low turnover depth, unstable turnover, unexplained volume, or drawdown sensitivity). We assume that
$ {J}_t\left({s}_t\right) $
 increases when the constraints are binding,
$ \partial {J}_t/\partial {s}_t>0 $
 . This second channel is the primary source of asymmetry between downside and upside common factor structures: when aggregate stress intensifies, stocks with larger
$ {\mathrm{\ell}}_i $
 values experience negative tail realizations induced by forced selling.
The distinction between the two channels is important. If
$ {J}_t\left({s}_t\right)=0 $
 , aggregate stress affects idiosyncratic returns only through the common scaling term
$ {\lambda}_t\left({s}_t\right) $
 ; thus, the distribution of residual returns is rescaled symmetrically across the upper and lower quantiles, and CIQ loses its distinctive left-tailed interpretation. In contrast, the one-sided component in equation (8) generates differential comovement specifically in the lower tail, which is the feature that the CIQ is designed to capture. Stocks with
$ {\mathrm{\ell}}_i=0 $
 are therefore not exposed to the asymmetric forced-selling channel, although they may still be affected by the common price-impact channel in (7).
Taken together, equations (7) and (8) should be interpreted as a reduced-form data-generating device designed to motivate CIQ rather than as a fully identified structural model of intermediary balance-sheet constraints. The purpose of this setup is to isolate two distinct channels through which the systemic state
$ {s}_t $
 affects idiosyncratic returns: a common price-impact channel and a one-sided stress channel.
A key implication of the asymmetry assumption is that higher fragility
$ {s}_t $
 generates a stronger coordinated downward shift in many firms’ left-tail idiosyncratic outcomes in comparison to right-tail shifts. We capture this with a parsimonious quantile representation, as follows:

where
$ {b}_i\left(\tau \right) $
 is more negative for some sufficiently low
$ \tau ={\tau}_L $
 when the constraints disproportionately amplify the downside outcomes,
$ {b}_i\left(\tau \right)\approx 0 $
 for the median and upper tail, and
$ {\nu}_{i,t}\left(\tau \right) $
 satisfies the appropriate quantile restriction. Under this structure, the quantile factor extracted from the data is a reduced-form proxy for the latent state
$ {CIQ}_t\left(\tau \right)\approx {G}_{\tau}\left({s}_t\right) $
 for some monotone mapping
$ {G}_{\tau}\left(\cdot \right) $
 , which is steeper in the lower tail. Because
$ {s}_t $
 is persistent, the levels of
$ {CIQ}_t\left(\tau \right) $
 contain slow-moving components. Asset prices, however, respond to news about future investment opportunities and risk-bearing capacity. Standard intertemporal asset-pricing logic therefore motivates a focus on innovations,
$ \Delta {CIQ}_t\left(\tau \right)\equiv {CIQ}_t\left(\tau \right)-{CIQ}_{t-1}\left(\tau \right)\approx {G}_{\tau}^{\prime}\left({s}_{t-1}\right)\hskip0.1em \Delta {s}_t $
 , so that
$ \Delta {CIQ}_t\left({\tau}_L\right) $
 isolates “news” about aggregate downside idiosyncratic conditions rather than slowly evolving tail levels.
2. Intermediary Constraints and the Pricing Kernel
In a constrained-intermediary setting,Footnote 24 the SDF permits the following representation:

where
$ {\psi}_t>0 $
 in constrained states. When the constraints tighten,
$ {\psi}_t $
 increases, and the SDF assigns more weight to states with large portfolio losses (see, e.g., Brunnermeier and Pedersen (Reference Brunnermeier and Pedersen2009) or He and Krishnamurthy (Reference He and Krishnamurthy2013)). A standard linearization implies that expected excess returns satisfy the following:

where
$ {\beta}_i^s={\mathrm{Cov}}_t\left({r}_{i,t+1},\Delta {s}_{t+1}\right)/{\mathrm{Var}}_t\left(\Delta {s}_{t+1}\right) $
 is exposure to risk-bearing-capacity news and
$ {\lambda}_{s,t} $
 is its (time-varying) price of risk.
Quantile factor analysis applied to idiosyncratic returns results in recovery of the dominant common component in lower-tail quantiles. Accordingly, lower-tail CIQ innovations at
$ {\tau}_L $
 (e.g.,
$ {\tau}_L=0.2 $
 ) estimate an affine transformation of
$ \Delta {s}_t $
 .Footnote
25 Empirically, we find that a single CIQ factor accounts for a significant proportion of the variation in realized lower-tail idiosyncratic quantiles and is distinct from volatility-based factors such as CIV or PCA-SQ.
The estimated exposure to the
$ \Delta $
 CIQ
$ \left({\tau}_L\right) $
 factor,

therefore corresponds to exposure to innovations in systemic fragility. Assets whose returns are more adversely affected by these innovations must offer higher average returns as compensation, which is consistent with our empirical pricing results from Section IV.B.
V. Robustness Checks
In this section, we analyze robustness of the CIQ risk implications. First, we examine how altering the data and the model specification behind the abnormal returns affects the cross-sectional results. Second, we investigate whether CIQ risk influences time variation in the aggregate equity premium by evaluating how CIQ risk innovations map onto market-wide expected return fluctuations.Footnote 26
A. Alternative Specifications
We investigate here the stability of the premium associated with the lower-tail
$ \Delta $
 CIQ factor across various alternative data and model specifications. First, in Panel A of Table 7, we further address the concern that the results are driven by volatility. To alleviate the risk that the driving force behind the premium is firm-level time-varying idiosyncratic volatility, we standardize the idiosyncratic returns from equation (1) by their estimate of time-varying volatility using the simple exponentially weighted moving average (EWMA) model and use the standardized returns to estimate the CIQ factors.Footnote
27 We present the results of high-minus-low portfolios from the decile and quintile equal-weighted sorts. We observe that the premium remains highly significant, with annual returns of 6.92% (
$ t $
 -stat of 3.88) and 4.68% (
$ t $
 -stat of 3.32) in the cases of the decile and quintile sorts, respectively. Furthermore, the premium is not subsumed by the 6-factor model of Fama and French (Reference Fama and French2018).

TABLE 7 Long description
The table is divided into six panels (A through F) comparing Decile Sorts and Quintile Sorts. Each sort includes four columns: Premium, t-Stat, alpha super F F 6, and t-Stat.
* Panel A (Volatility Control): Includes T V volatility std., P C A-S Q control, C I Q level, and A R (1) shocks. Premium values for decile sorts range from 6.75 to 8.70.
* Panel B (Linear Specification): Compares F F 5 and F F 6 models. F F 5 shows a decile premium of 6.03 (t-stat 3.85) while F F 6 shows 4.38 (t-stat 2.84).
* Panel C (Stock Price): Compares all stocks to those with price > $5. All stocks show a higher decile premium of 7.76 compared to 6.71 for higher-priced stocks.
* Panel D (Firm Size): Lists N Y S E breakpoints and market cap thresholds (10%, 20%, 50%). Premia generally decrease as the market cap threshold increases, from 7.34 at 10% to 4.92 at 50%.
* Panel E (Time Split): Compares 01/1968–12/1996 (premium 4.06) to 01/1997–12/2024 (premium 10.87), showing a significant increase in the later period.
* Panel F (Multi-Period Returns): Shows results for the next 3, 6, and 12 months, and the period t + 2 to t + 12. Decile premia range from 4.30 to 5.61, with t-stats remaining robust above 3.7.
Next, to precisely measure the sensitivity of stocks to the lower-tail
$ \Delta $
 CIQ factor while controlling for the sensitivity to the changes in common idiosyncratic volatility, we estimate the lower-tail
$ \Delta $
 CIQ betas from equation (4) using multiple regression, and we also include the
$ \Delta $
 PCA-SQ factor as a control. The results show that this alternative does not affect the premium associated with lower-tail
$ \Delta $
 CIQ risks, as the premia remain at 6.75% (
$ t=4.26 $
 ) and 4.83% (
$ t=4.01 $
 ) in the cases of the decile and quintile sorts, respectively.
We also include results in which the exposures are estimated with respect to the levels of the CIQ factors. The premium remains strong even with respect to this specification, with values of 8.01% (
$ t=2.88 $
 ) and 5.87% (
$ t=2.57 $
 ) per annum for the respective sorts. Finally, we report results using AR(1) lower-tail CIQ factor innovations, which also yield strong performance within this setting.
In Panel B, we report the portfolio results using idiosyncratic returns with respect to the FF5 and FF6 models. While the FF5 specification does not quantitatively alter the results from our baseline FF3 specification, the results using the FF6 model yield a slightly diminished premium. Given that the only difference between the FF5 and FF6 models is the inclusion of the momentum factor in the linear specification, we can conclude that the momentum exposure is partially related to the common lower-tail events. The observation that momentum returns are associated with extreme negative events, so-called momentum crashes, has been well documented (see, e.g., Barroso and Santa-Clara (Reference Barroso and Santa-Clara2015), Daniel and Moskowitz (Reference Daniel and Moskowitz2016)). This observation sheds further light on the drivers of the momentum risk premium, capturing the risk of lower-tail events in the cross section of stock returns. Moreover, the alphas associated with the lower-tail
$ \Delta $
 CIQ risk remain high and significant, with annualized values of 6.08% (
$ t=3.77 $
 ) and 5.65% (
$ t=4.32 $
 ) for the decile and quintile sorts, respectively.
Next, in Panel C, we vary the stocks that we consider when forming the portfolios. First, as we restrict our universe to stocks with prices above $1 in our baseline specification, we report here the results using all available stocks. We observe that the premia estimated using either decile or quintile sorts remain high and significant. This situation holds if we restrict our universe to stocks with prices above the $5 threshold.
In Panel D, we first investigate how the results change if we sort stocks into portfolios on the basis of New York Stock Exchange breakpoints. We see that the results of both decile- and quintile-based high-minus-low portfolios remain high and significant. These results show that the portfolio results are not driven by microcap stocks.
Next, in the same panel, we restrict our investment universe to stocks with market capitalization above the
$ p $
 th percentile of the distribution of stocks traded on the New York Stock Exchange at a given time. We report the results for stocks with market capitalization greater than the 10%, 20%, and 50% percentiles. We observe a stable premium that, even if we focus on stocks with capitalization above the NYSE median, yields annual returns of 4.92% (
$ t=2.33 $
 ) and 4.06% (
$ t=2.38 $
 ) for decile- and quintile-based premia, respectively.
In Panel E, we report separate results for the two disjointed periods. The first period covers the time between January 1968 and December 1996, and the second period covers the time from January 1997 to December 2024. We observe that the premium is substantially lower for the first period—4.06% and 2.89% for the decile and quintile sorts, respectively. As shown in Figure 2, this situation is caused mostly by the period between approximately 1974 and 1980, in which the strategy did not yield any significant premium. On the other hand, since that time, relatively steady growth was observed from using the strategy, with a premium of 10.87% (
$ t $
 -stat of 4.48) for the decile-based high-minus-low strategy and a premium of 8.06% (
$ t $
 -stat of 4.25) for the quintile-based strategy.
A strengthening of the lower-tail premium in the second period is broadly consistent with our intermediary risk interpretation because the late 1990s saw the rise of market-based finance and leveraged dealer intermediation (e.g., expansion of securitization, repo funding, and hedge funds), making asset prices more sensitive to fluctuations in intermediary balance sheets. As a result, shocks such as the long-term capital management collapse or global financial crisis revealed that constrained intermediaries reduce risk-bearing capacity, increasing the required returns on assets exposed to funding and liquidity risk.
Finally, in Panel F, we consider the performance of the lower-tail
$ \Delta $
 CIQ-sorted portfolios as captured by the following multiperiod returns. This exercise helps us understand two points. First, we examine whether the investment strategy based on the lower-tail
$ \Delta $
 CIQ factor is feasible in terms of turnover by examining the returns of portfolios that are rebalanced with a lower than monthly frequency. Second, we can infer whether the premium associated with the exposure to the lower-tail
$ \Delta $
 CIQ factor is a compensation for risk and not just a reversal effect. If risk is the driving force underlying the abnormal returns, then multiperiod returns should remain economically and statistically significant. We proceed as follows: Each month, we form the portfolios using the same method used in the previous case. Instead of saving the next 1-month return of the sorted portfolios, we record the 3-, 6-, and 12-month returns after the formation period. We observe returns that are consistent with the results obtained using the 1-month returns; for example, the high-minus-low portfolio rebalanced every 6 months yields a 5.13% (
$ t=3.87 $
 ) decile-based premium and a 3.61% (
$ t=3.24 $
 ) quintile-based premium on an annual basis. These results suggest that an investor does not have to suffer the high turnover costs associated with the strategy to exploit the associated risk premium.
To mitigate the effect of return reversals, we also extend this analysis by working with 1-year returns but excluding returns immediately following the formation period. We report the results in the last row of Panel F. The resulting returns are almost indistinguishable from the returns over the full 1-year period, with premia of 4.30% (
$ t=4.05 $
 ) and 3.04% (
$ t=3.39 $
 ) for the decile and quintile sorts, respectively.
Furthermore, consistent with the intuition that assets hedging the states in which liquidity provision is costly and intermediary capital is scarce command higher prices and lower expected returns, we examine whether the lower-tail CIQ premium is related to forward-looking measures of risk.Footnote 28 Regressions of portfolio returns on expected variance and the variance risk premium show that the CIQ premium is primarily associated with variation in the variance risk premium rather than expected variance. This distinction is important: while expected variance reflects changes in aggregate uncertainty, the variance risk premium is typically interpreted as capturing fluctuations in risk-bearing capacity and liquidity supply. The results therefore reinforce the view that lower-tail CIQ risk is priced because it loads on states in which liquidity provision is costly rather than on periods of elevated uncertainty alone.
B. Time Series Implications for the Equity Premium
Having shown that innovations in the lower-tail
$ \Delta $
 CIQ factor reflect periods of strained intermediary balance sheets, elevated aggregate uncertainty, and sell-side liquidity stress, we now examine whether these states also carry information about the aggregate equity premium. If the lower-tail
$ \Delta $
 CIQ factor captures fluctuations in economy-wide risk-bearing capacity, it should predict subsequent market returns by identifying periods in which compensation for bearing risk is unusually high.
We investigate this hypothesis by examining the ability of the lower-tail
$ \Delta $
 CIQ factor to forecast short-horizon equity returns, measured as the value-weighted excess return of all CRSP firms. We show that the predictive content of the lower-tail
$ \Delta $
 CIQ factor is economically meaningful, robust to controls for existing predictors, and persists in an out-of-sample setting.
We begin with in-sample univariate predictive regressions of the form:

where
$ {r}_{m,t+1} $
 denotes the monthly market excess return. Each month, CIQ factors are estimated using the preceding 60 months of data, and the most recent innovation is used to predict the subsequent market return. Coefficients are scaled to represent the effect of a 1-standard-deviation change in the predictor on the annualized market return. Statistical inference is based on Newey–West standard errors with 6 lags.
The results, reported in Table 8, show that the lower-tail
$ \Delta $
 CIQ factor strongly predicts the equity premium. A 1-standard-deviation decrease in the factor—corresponding to a deterioration in common idiosyncratic downside conditions—predicts an increase of 5.49 percentage points in the subsequent annualized market return (
$ t=-2.26 $
 ). In contrast, univariate predictive power of the upper-tail
$ \Delta $
 CIQ factor is substantially weaker and less stable, with a smaller economic magnitude and lower explanatory power. This asymmetry mirrors the earlier evidence that downside CIQ innovations are closely tied to binding intermediation constraints, whereas upside realizations are not.

TABLE 8 Long description
The table consists of 13 columns and 13 main factor rows.
Factors and Coefficients (t-statistics in parentheses):
* Delta C I Q super L T: Coefficients range from -4.97 to -7.24, with t-statistics generally around -2.00, indicating statistical significance in most models.
* Delta C I Q super C: Coefficients range from -2.30 to -3.60, with t-statistics around -1.30, generally not significant.
* Delta C I Q super U T: Coefficients range from 3.75 to 8.30, with t-statistics between 1.71 and 2.81, showing positive significance.
* Delta P C A minus S Q: Included in models 5, 12, and 13 with coefficients around -1.50.
* Delta C I V: Included in models 6, 12, and 13 with coefficients around -3.50.
* T R (Tail Risk): Included in models 7, 9, 12, and 13 with coefficients between 2.27 and 4.92.
* C B I V: Included in models 8, 9, and 13 with coefficients between 2.63 and 4.87.
* M K T sub t minus 1: Included in models 10, 12, and 13 with coefficients between -0.75 and 0.43.
* S T R (Short-term Reversal): Included in models 11, 12, and 13 with coefficients between -0.53 and 0.00.
Statistical Performance Metrics:
* R super 2 I S (In-Sample): Values range from 0.17 in model 2 to a peak of 3.18 in model 12.
* R super 2 O O S (Out-of-Sample): Values range from -1.65 in model 13 to 1.67 in model 7.
* R super 2 O O S C T (Campbell and Thompson): Values range from -0.34 in model 13 to 1.59 in model 7.
From an economic perspective, large negative innovations in the lower-tail
$ \Delta $
 CIQ factor are tied to periods in which the intermediary risk-bearing capacity is impaired and sell-side liquidity is scarce. In such states, assets command higher expected returns, leading to an elevated subsequent equity premium. The ability of the lower-tail
$ \Delta $
 CIQ factor to predict the market return therefore reflects time variations in the price of aggregate risk driven by fluctuations in liquidity provisions and balance-sheet capacity.
We also evaluate the performance of the predictive regressions in an expanding-window out-of-sample framework. Specifically, we use data up to time
$ t $
 to estimate a prediction model and then forecast a return at time
$ t+1 $
 (the first window contains 120 monthly periods to obtain sufficiently reasonable estimates). Then, the window is extended by one observation, the prediction model is re-estimated, and a new forecast is obtained. We repeat this procedure until the entire sample is exhausted. The corresponding
$ {R}^2 $
 value is computed by comparing the conditional forecast and historical mean computed using the available data up to time
$ t $
 .Footnote
29 Unlike the case of the in-sample
$ {R}^2 $
 value, the OOS
$ {R}^2 $
 value can be negative if the conditional forecasts perform worse than the historical mean forecast.
We observe that the lower-tail
$ \Delta $
 CIQ factor delivers positive and economically meaningful out-of-sample
$ {R}^2 $
 values, whereas the predictive performance of the upper-tail factor deteriorates substantially out of sample. Applying the truncation following Campbell and Thompson (Reference Campbell and Thompson2007) further improves the out-of-sample performance for the lower-tail factor.
Next, we examine whether the predictive power of the lower-tail
$ \Delta $
 CIQ factor is subsumed by existing predictors. We estimate multiple regressions of the form:

where
$ {f}_t $
 includes controls such as innovations in common idiosyncratic volatility (PCA-SQ and CIV), the tail risk reported by Kelly and Jiang (Reference Kelly and Jiang2014) (TR), the cross-sectional bivariate idiosyncratic volatility reported by Han and Li (Reference Han and Li2025) (CBIV), lagged market returns, and short-term reversal (STR). Across all specifications, the coefficient on the lower-tail
$ \Delta $
 CIQ factor remains economically large and statistically significant, while the inclusion of volatility-based controls does not diminish its predictive ability. This evidence indicates that the ability of
$ \Delta $
 CIQ to aid in predictions is not driven by common volatility or generic tail risk but instead reflects a distinct channel related to fluctuations in aggregate liquidity provision and intermediary constraints. The predictability of the market return therefore complements the cross-sectional pricing evidence and reinforces the interpretation of
$ \Delta $
 CIQ as a state variable governing the price of risk in the economy.Footnote
30
VI. Conclusion
This article examines the circumstances in which idiosyncratic downside returns become systematically related across firms and the reasons why this comovement is priced. Using a quantile factor model applied to idiosyncratic returns, we identify CIQ factors that alter the lower, central, and upper regions of the residual return distribution. Our central empirical finding is that exposure to innovations in the lower-tail CIQ factor commands a large premium, whereas exposure to the median and upper-tail CIQ factors is not priced. The downside CIQ premium is robust to standard factor models and a wide range of volatility- and tail-based risk controls, suggesting that it represents a unique source of systematic risk.
This article makes three contributions. First, it introduces a new return-based measure of systematic risk that explicitly considers the distribution and distinguishes between downside and upside idiosyncratic comovement. Second, it demonstrates that only the downside of common idiosyncratic tail comovement is priced, with premia that survive an extensive set of risk and characteristic controls and that vary systematically across quantiles. Third, it links the priced downside factor to intermediary constraints and liquidity conditions, demonstrating that the same state variable forecasts the aggregate equity premium.
Our findings have implications for both asset pricing and risk management. In terms of asset pricing, they identify a state variable that links distributional shifts in residual returns to equilibrium risk premia, helping to explain why compensation for tail exposure is concentrated in the left tail. For practitioners and regulators, the results highlight that monitoring downside tail comovement in residual returns can provide information about latent fragility in market-making and risk-bearing capacity. Future work could investigate how these tail comovement states interact with market structure, dealer inventories, and the propagation of shocks across asset classes at higher frequencies.
Appendix A. Quantile Factor Model
We assume a panel of returns of length
$ T $
 and width
$ N $
 after eliminating the common mean factors from the time series regression:

to have a
$ \tau $
 -dependent structure-
$ {g}_t\left(\tau \right) $
 -in idiosyncratic errors that we coin the CIQ–CIQ(
$ \tau $
 )-factors, which satisfies

which implies

where
$ {g}_t\left(\tau \right) $
 is an
$ r\left(\tau \right)\times 1 $
 vector of random common factors,
$ {\gamma}_i\left(\tau \right) $
 is an
$ r\left(\tau \right)\times 1 $
 vector of nonrandom factor loadings with
$ r\left(\tau \right)\ll N $
 ,
$ {Q}_{\unicode{x025B}_{i,t}}\left[\tau |{g}_t\left(\tau \right)\right] $
 is a conditional quantile function of
$ {\unicode{x025B}}_{i,t} $
 at
$ \tau $
 , and the quantile-dependent idiosyncratic error
$ {u}_{i,t}\left(\tau \right) $
 almost certainly satisfies the quantile restriction
$ P\left[{u}_{i,t}\left(\tau \right)<0|{g}_t\left(\tau \right)\right]=\tau $
 for all
$ \tau \in \left(0,1\right) $
 .
To estimate common factors that capture the comovement of quantile-specific features of distributions of the idiosyncratic parts of stock returns, we use quantile factor analysis (QFA) introduced by Chen et al. (Reference Chen, Dolado and Gonzalo2021). In contrast to principal component analysis (PCA), QFA facilitates the capture of hidden factors that may shift more general characteristics, such as moments or quantiles of the distribution of returns other than the mean. The methodology is also suitable for large panels and requires less strict assumptions about the data generation process.
The quantile-dependent factors and their loadings can be estimated as follows:

where
$ {\rho}_{\tau }(u)=\left(\tau -\mathbf{1}\left\{u\le 0\right\}\right)u $
 is the check function while imposing the following normalizations:
$ \frac{1}{T}{\sum}_{t=1}^T{g}_t\left(\tau \right){g}_t{\left(\tau \right)}^{\top }={\unicode{x1D540}}_r $
 , and
$ \frac{1}{N}{\sum}_{i=1}^N{\gamma}_i\left(\tau \right){\gamma}_i{\left(\tau \right)}^{\top } $
 is diagonal with nonincreasing diagonal elements.
As discussed in Chen et al. (Reference Chen, Dolado and Gonzalo2021), this estimator is related to the PCA estimator studied in Bai and Ng (Reference Bai and Ng2002) and Bai (Reference Bai2003), similar to quantile regression, which is related to classical least squares regression. Unlike the PCA estimator of Bai (Reference Bai2003), this estimator does not yield an analytical closed-form solution. To solve for the stationary points of the objective function, Chen et al. (Reference Chen, Dolado and Gonzalo2021) proposed a computational algorithm called iterative quantile regression. These authors also showed that the estimator possesses the same convergence rate as the PCA estimators for the approximate factor model. We follow their approach when estimating the quantile factors.Footnote 31
Appendix B. Beyond Volatility Factors
To illustrate the discussion and provide the link between volatility and quantiles, let’s consider the data-generating process to be a typical location-scale model with two unrelated factors in the first and second moments. Idiosyncratic returns
$ {\unicode{x025B}}_{i,t} $
 of such a model will be 0 mean IID process independent of both factors with cumulative distribution function
$ {F}_{\unicode{x025B}_{i,t}} $
 . Further let
$ {Q}_{\unicode{x025B}_{i,t}}\left(\tau \right)={F}_{\unicode{x025B}_{i,t}}^{-1}\left(\tau \right)=\operatorname{inf}\left\{s:{F}_{\unicode{x025B}_{i,t}}(s)\le \tau \right\} $
 be a quantile function of
$ {\unicode{x025B}}_{i,t} $
 and assume the median is 0. Then the following model is considered, which is typical for finance:

where
$ {\sigma}_{i,t} $
 is time-varying volatility of an
$ i $
 th stock and
$ {\sigma}_{i,t}{f}_{2,t}>0 $
 can be assumed to generate returns. When
$ {f}_{1,t} $
 and
$ {f}_{2,t} $
 do not share common elements, then

for
$ \tau \ne 0.5 $
 and
$ {Q}_{r_{i,t}}\left[\tau |\hskip0.29em {f}_t\left(\tau \right)\right]={\beta}_i\hskip0.29em {f}_{1,t} $
 for
$ \tau =0.5 $
 . Note that here loadings on the factor are the only quantile-dependent objects and structure in the mean and volatility describes well the structure in quantiles. While this is already a restrictive example that operates with the assumption on the first two moments, even in such a case standard PCA will not provide consistent estimates if the distribution of
$ {\unicode{x025B}}_{i,t} $
 is heavy-tailed (Chen et al. (Reference Chen, Dolado and Gonzalo2021)).
But what if the data follow more complicated models than the one implied by location-shift models? Consider adding asymmetric dependence, such as

where
$ {\unicode{x025B}}_{i,t} $
 is a standard normal random variable with cumulative distribution function
$ \Phi (.) $
 . The quantiles of the returns will then follow:

for
$ \tau \ne 0.5 $
 , and we can clearly see that the second factor in
$ f\left(\tau \right)={\left[\hskip0.29em {f}_{1,t},{f}_{2,t}+{f}_{3,t}{\Phi}^{-1}{\left(\tau \right)}^2\right]}^{\top } $
 is quantile dependent.
Appendix C. A Simple Intermediary-Fragility Model
This appendix provides a simple model that formalizes the mechanism in Section C.2 of Appendix C. The goal is not to offer a fully calibrated structural model, but to show that a continuum of intermediary balance-sheet constraints can aggregate into a one-dimensional fragility state
$ {s}_t $
 that i) drives common shifts in firms’ idiosyncratic left-tail quantiles and ii) appears in the SDF through innovations
$ \Delta {s}_{t+1} $
 .
1. Setup
There is a continuum of competitive intermediaries
$ j\in \left[0,1\right] $
 with equity
$ {E}_{j,t} $
 . Intermediary
$ j $
 chooses a portfolio over a market factor
$ {F}_{t+1} $
 and a continuum of firm claims with returns
$ {r}_{i,t+1} $
 , subject to an expected shortfall (ES) constraint on portfolio losses. Let
$ {\lambda}_{j,t} $
 denote the Lagrange multiplier on this constraint.
We define systemic fragility as the equity-weighted average multiplier

where
$ {\omega}_{j,t} $
 are equity weights. Intuitively,
$ {s}_t $
 is the aggregate shadow cost of risk-bearing in the intermediary sector.
Firm
$ i $
 ’s idiosyncratic return
$ {\varepsilon}_{i,t+1} $
 has a conditional quantile representation:

with
$ {b}_i\left(\tau \right)<0 $
 for
$ \tau \le {\tau}_L $
 ,
$ {b}_i\left(\tau \right)\approx 0 $
 for
$ \tau \ge 0.5 $
 , and
$ {\nu}_{i,t}\left(\tau \right) $
 satisfies the appropriate quantile restriction. This captures the idea that tighter constraints shift firms’ left-tail quantiles downward through funding, covenant, and liquidity channels, but leave the central and right tail largely unaffected.
2. Quantile Factor Representation
Proposition C1 (Quantile factor representation) Under standard large-
$ N $
 conditions for approximate factor models, the first quantile principal component of idiosyncratic returns at
$ {\tau}_L $
 consistently estimates an affine transformation of
$ {s}_t $
 :

with
$ \kappa \ne 0 $
 and an error term
$ {\eta}_t $
 .
Sketch of proof. Equation (C2) defines a one-factor structure in the conditional
$ {\tau}_L $
 -quantiles of idiosyncratic returns. Under the assumptions of Chen et al. (Reference Chen, Dolado and Gonzalo2021) on cross-sectional pervasiveness and bounded idiosyncratic components, the quantile factor analysis estimator recovers the space spanned by
$ {s}_t $
 up to an affine transformation. Normalization conditions pin down the scale and sign up to a constant.Footnote
32 Subsequently, this result naturally implies the following proposition.
Proposition C2 (Quantile factor representation) Under standard large-
$ N $
 conditions for approximate factor models, a lower-tail CIQ innovation at
$ {\tau}_L $
 consistently estimates an affine transformation of
$ \Delta {s}_t $
 ,

with
$ \kappa \ne 0 $
 and an error term
$ {\nu}_t $
 .
3. Pricing Kernel
Each intermediary’s optimality condition with an ES constraint yields an SDF containing a term proportional to its marginal shortfall loss
$ {\mathrm{\ell}}_{j,t+1} $
 , in addition to a standard component
$ {m}_{t+1}^{\mathrm{std}} $
 . In equilibrium, all intermediaries share the same pricing kernel, which can be written as

where
$ {\mathrm{\ell}}_{t+1} $
 is the aggregate marginal shortfall and
$ {\phi}_t $
 is proportional to the cross-sectional average of
$ {\lambda}_{j,t} $
 , hence to
$ {s}_t $
 by (C1).
Assuming that portfolio shortfalls materialize precisely when the fragility state worsens, we can approximate
$ {\mathrm{\ell}}_{t+1} $
 as a linear function of
$ \Delta {s}_{t+1} $
 :

with
$ {a}_1>0 $
 . Substituting into (C3) yields

with
$ {\psi}_t={\phi}_t{a}_1>0 $
 in constrained states.
Proposition C3 (CIQ beta as fragility exposure) With
$ {CIQ}_t^L=\alpha +\kappa {s}_t+{\eta}_t $
 , the innovation
$ \Delta {CIQ}_t^L $
 is proportional to
$ \Delta {s}_t $
 up to noise. The CIQ beta

is therefore proportional to the covariance of
$ {r}_{i,t+1} $
 with
$ \Delta {s}_{t+1} $
 . Expected excess returns satisfy

with
$ {\lambda}_{CIQ,t}>0 $
 when constraints are tight.
Sketch of proof. Combine
$ \Delta {CIQ}_t^L=\kappa \Delta {s}_t+\Delta {\eta}_t $
 with (C4) and apply the standard linear beta pricing argument. Under mild assumptions on the noise term
$ \Delta {\eta}_t $
 , the projection of
$ {r}_{i,t+1} $
 on
$ \Delta {CIQ}_{t+1}^L $
 coincides with its projection on
$ \Delta {s}_{t+1} $
 up to a constant.
Proposition C4 (Left-tail asymmetry) Because ES constraints depend on losses, the marginal shortfall
$ {\mathrm{\ell}}_{t+1} $
 is insensitive to upside comovement and depends only on left-tail realizations. Under the quantile representation (C2), the resulting price of quantile-factor risk is monotone in
$ \tau $
 for
$ \tau <0.5 $
 and negligible for
$ \tau \ge 0.5 $
 . In particular, only the lower-tail CIQ factor is priced, while median and upper-tail CIQ factors do not command premia.
Sketch of proof. The ES constraint binds only in states where portfolio returns fall below a left-tail threshold. By construction,
$ {\mathrm{\ell}}_{t+1} $
 is orthogonal to purely central or right-tail shifts. Under (C2),
$ {s}_t $
 affects
$ {q}_{i,t}\left(\tau \right) $
 only for
$ \tau \le {\tau}_L $
 . Thus, only quantile factors estimated from the left tail proxy for
$ \Delta {s}_{t+1} $
 and receive a nonzero price of risk in (C4).
Appendix D. Cross-Sectional Quantiles

TABLE D1 Long description
Panel A, titled Variance Ratios, compares quantile series. For the Lower-Tail, the variance ratio of Raw to C A P M is 0.31, C A P M to F F 3 is 0.46, F F 3 to F F 5 is 0.90, and F F 5 to F F 6 is 0.94. For the Upper-Tail, Raw to C A P M is 0.32, C A P M to F F 3 is 0.37, F F 3 to F F 5 is 0.96, and F F 5 to F F 6 is 0.81.
Panel B, titled Regressions, reports results for F F 3 idiosyncratic quantiles.
* For Lower-Tail (columns 1 to 3): Intercepts range from minus 0.09 to minus 0.02. Volatility coefficient in column 2 is minus 0.23. C I Q factor in column 3 is 0.07. Adjusted R-squared percentages are 0.00, 0.32, and 0.40 respectively.
* For Upper-Tail (columns 4 to 6): Intercepts range from 0.08 to 0.02. Volatility coefficient in column 5 is 0.26. C I Q factor in column 6 is 0.06. Adjusted R-squared percentages are 0.00, 0.38, and 0.39 respectively.
Figure D1 shows various measures of cross-sectional stock return dispersion through time. For each month, we plot 20% and 80% cross-sectional quantiles of either excess or idiosyncratic excess returns. The idiosyncratic returns are computed with respect to the 3-factor model of Fama and French (Reference Fama and French1993). The data come from the CRSP database and cover the period from January 1968 to December 2024. The shaded areas represent NBER recessions.

FIGURE D1 Long description
A two-panel line graph with a shared x-axis labeled tau ranging from 0.05 to 0.95. A shared legend at the bottom identifies four data series: a solid line for quintile, a dashed line for decile, a circle marker for High minus Low, and a triangle marker for alpha F F 6.
Left Panel: Titled Mean Return (percent). The y-axis ranges from negative 2 to 8. All four data series follow a similar hump-shaped trajectory. They start between 4 and 6 at tau equals 0.05, peak between 6 and 8.5 at tau equals 0.20, and then steadily decline. The lines cross the zero threshold around tau equals 0.75 to 0.80, ending at negative values between negative 1.5 and negative 3 at tau equals 0.95. The alpha F F 6 series (triangles) generally shows the highest peaks and lowest troughs.
Right Panel: Titled t-statistic. The y-axis ranges from negative 2 to 5. The data series follow a similar pattern to the first panel but with more pronounced peaks. Values start between 3 and 3.5, rise to a peak between 3.8 and 5.5 at tau equals 0.25 to 0.35, and then drop sharply. The values become negative after tau equals 0.70, reaching a minimum near negative 2 at tau equals 0.95.
Appendix E. Bivariate Portfolio Sorts

TABLE E1 Long description
The table reports annualized out-of-sample excess returns for portfolios double-sorted on exposure to the lower-tail Delta C I Q factor and various control variables.
Column headers from left to right: beta super C A P M, Size, B / P, M O M, S T R, I V O L, I S K E W, C S K, C K T, beta super down, beta super P C A minus S Q, beta super C I V, beta super tail, and beta super V I X.
Panel A: Decile Sorts
* Low portfolio returns range from 4.54 for I S K E W to 6.82 for beta super C A P M.
* High portfolio returns range from 10.31 for S T R to 14.34 for beta super V I X.
* High minus Low spreads are positive across all variables, with the highest spread in beta super V I X at 7.85 and the lowest in S T R at 4.65.
* t-Statistics for the High minus Low spread range from 3.02 to 4.34.
* Alpha super F F 6 values range from 5.24 to 8.07, with t-statistics ranging from 3.73 to 5.71.
Panel B: Quintile Sorts
* Low portfolio returns range from 6.09 for Size to 7.86 for beta super V I X.
* High portfolio returns range from 10.76 for S T R to 14.20 for beta super V I X.
* High minus Low spreads range from 3.27 for beta super C I V to 6.34 for beta super V I X.
* t-Statistics for the High minus Low spread range from 2.74 to 4.11.
* Alpha super F F 6 values range from 4.69 to 6.83, with t-statistics ranging from 3.94 to 5.67.
Appendix F. Additional Fama–MacBeth Regressions

TABLE F1 Long description
The table consists of 8 numbered columns representing different regression specifications. The rows list coefficients and t-statistics in brackets for the following variables:
* beta sub L T super C I Q: Coefficients range from 1.08 to 1.34, with t-statistics between 3.12 and 3.48 across all 8 models.
* Size: Included in models 1 and 8, with coefficients of -0.02 and -0.01 and t-statistics of -1.91 and -1.71.
* Book-to-price: Included in models 2 and 8, with coefficients of 0.13 and 0.12 and t-statistics of 2.33 and 2.00.
* Net payout yield: Included in models 3 and 8, with coefficients of 1.16 and 0.84 and t-statistics of 1.59 and 1.18.
* Turnover: Included in models 4 and 8, with coefficients of -0.08 and t-statistics of -1.48 and -1.84.
* Illiquidity: Included in models 5 and 8, with coefficients of 1.49 and 1.92 and t-statistics of 1.27 and 1.22.
* Profit: Included in models 6 and 8, with coefficients of 0.45 and 0.48 and t-statistics of 3.75 and 3.87.
* Investment: Included in models 7 and 8, with coefficients of -0.43 and -0.38 and t-statistics of -6.62 and -6.38.
* Intercept: Values range from 0.60 to 0.87 with t-statistics from 2.99 to 4.03.
Summary statistics at the bottom include:
* R sub adj super 2 percentage: Ranges from 0.99 in model 1 to 3.26 in model 8.
* n-bar (average observations): Ranges from 2,741 to 3,045.
* T (number of months): Constant at 684 for all models.
Appendix G. CIQ Premium Across the Distribution
Figure G1 reports estimated risk premia for CIQ factors across quantile levels
$ \tau \in \left[\mathrm{0.05,0.95}\right] $
 in increments of 0.05.Footnote
33 The pricing pattern varies systematically across quantiles: only lower-tail exposures (
$ \tau <0.5 $
 ) command a significant premium, with the largest premia concentrated around
$ \tau \approx 0.2 $
 . These results reinforce the central theme of the article that downside idiosyncratic tail risk, rather than symmetric dispersion or upside potential, is the primary price dimension of common idiosyncratic risk.
Figure G1 describes premia related to the exposures to the
$ \Delta $
 CIQ factors. We report average annual returns of high-minus-low equal-weighted portfolios from decile and quintile sorts and their alphas with respect to the 6-factor model of Fama and French (Reference Fama and French2018). We also report
$ t $
 -statistics based on the correction of Newey and West (Reference Newey and West1994). The data come from the CRSP and cover the period from January 1968 to December 2024. We exclude penny stocks with prices of $1 or less.

FIGURE G1 Long description
A line graph with a vertical y-axis labeled Return ranging from negative 40 percent to 80 percent and a horizontal x-axis representing years from 1970 to 2025.
Legend at the top left identifies five data series
* Red line: 20 percent quantile of raw returns.
* Blue line: 20 percent quantile of idiosyncratic returns.
* Green line: 80 percent quantile of raw returns.
* Purple line: 80 percent quantile of idiosyncratic returns.
* Orange line: Idiosyncratic volatility.
Data Trends
* The orange line representing idiosyncratic volatility remains the highest throughout the period, showing significant spikes above 40 percent around 1990, 2000, 2008, and 2023.
* The green and purple lines (80 percent quantiles) fluctuate between 0 percent and 20 percent.
* The red and blue lines (20 percent quantiles) fluctuate between 0 percent and negative 20 percent, with a significant downward spike near the year 2000 reaching negative 30 percent.
* Vertical gray shaded bars indicate specific time intervals, likely recessions or high-volatility periods, occurring around 1970, 1974, 1980, 1982, 1991, 2001, 2008, and 2020.
To better understand the economic forces driving the cross-quantile variation in premia, we examine how differences in portfolio returns across quantiles vary over time. Specifically, for two quantile levels
$ {\tau}_1<{\tau}_2 $
 , we construct the return differential between the corresponding high-minus-low portfolios from equal-weighted decile sorts,

This difference is positive when exposure to more extreme lower tails is compensated for more than exposure to less severe states. We then compute the correlation between these return differentials and the lagged variance risk premium (VP) computed as suggested by Bekaert and Hoerova (Reference Bekaert and Hoerova2014), which proxies for fluctuations in risk aversion and risk-bearing capacity.
Panel A of Table G1 shows that these correlations are predominantly positive and increase as the distance between
$ {\tau}_1 $
 and
$ {\tau}_2 $
 increases. For example, the return differential between portfolios associated with
$ \tau =0.05 $
 and those associated with
$ \tau =0.35 $
 is strongly positively correlated with the lagged VP. This pattern implies that when risk aversion is elevated, compensation for exposure to more extreme downside tail risk increases disproportionately relative to milder tail exposures. In other words, investors require especially high compensation for assets that perform poorly in states associated with severe common downside realizations.

TABLE G1 Long description
The table is divided into two panels, Panel A for Variance Risk Premium (V P) and Panel B for Conditional Variance (C V). Both panels use a horizontal header for tau sub 2 with values 0.1, 0.15, 0.2, 0.25, 0.3, 0.35, and 0.4, and a vertical header for tau sub 1 with values 0.05, 0.10, 0.15, 0.20, 0.25, 0.30, and 0.35.
Panel A (V P) data points:
* Row tau sub 1 = 0.05: 0.04, 0.02, 0.06, 0.11, 0.15, 0.18, 0.17.
* Row tau sub 1 = 0.10: -0.01, 0.05, 0.12, 0.17, 0.19, 0.18.
* Row tau sub 1 = 0.15: 0.08, 0.16, 0.20, 0.23, 0.20.
* Row tau sub 1 = 0.20: 0.13, 0.21, 0.23, 0.20.
* Row tau sub 1 = 0.25: 0.17, 0.21, 0.18.
* Row tau sub 1 = 0.30: 0.14, 0.12.
* Row tau sub 1 = 0.35: 0.04.
Panel B (C V) data points:
* Row tau sub 1 = 0.05: 0.00, -0.02, 0.00, 0.01, 0.01, 0.03, 0.02.
* Row tau sub 1 = 0.10: -0.03, 0.00, 0.02, 0.01, 0.04, 0.02.
* Row tau sub 1 = 0.15: 0.04, 0.05, 0.04, 0.07, 0.04.
* Row tau sub 1 = 0.20: 0.02, 0.01, 0.05, 0.02.
* Row tau sub 1 = 0.25: 0.00, 0.06, 0.02.
* Row tau sub 1 = 0.30: 0.08, 0.02.
* Row tau sub 1 = 0.35: -0.04.
This evidence is consistent with quantile-dependent preference models, in which agents focusing on lower quantiles behave in a more risk-averse manner (de Castro and Galvao (Reference de Castro and Galvao2019)). Importantly, repeating the same analysis using conditional variance instead of the VP in Panel B of Table G1 yields no comparable pattern, indicating that the cross-quantile variation in premia is driven by risk aversion and risk-bearing capacity rather than by fluctuations in aggregate uncertainty.
In addition, Section IAVI of the Supplementary Material provides numerous approaches for aggregating exposures across CIQ factors and further evidence of the clear asymmetry between the pricing implications of downside and upside CIQ factors.
Appendix H. Predictability of the CIQ Premium

TABLE H1 Long description
The table consists of 6 columns representing different regression models and 7 primary rows for variables and performance metrics.
* V I X squared: Model 1 shows a coefficient of 6.10 with a t-statistic of 1.90.
* V P (Equity Variance Premium): Model 2 is 7.28 (2.27); Model 5 is 8.61 (2.71); Model 6 is 7.81 (2.34).
* C V (Conditional Variance): Model 3 is 4.30 (1.37); Model 5 is minus 1.86 (minus 0.84); Model 6 is 1.23 (0.43).
* Mkt (Market Return): Model 4 is 2.74 (1.14); Model 6 is 5.36 (2.23).
Performance metrics at the bottom of the table:
* R-squared I S (In-Sample): Ranges from 0.45 in Model 4 to 4.58 in Model 6.
* R-squared O O S (Out-of-Sample): Ranges from minus 2.45 in Model 4 to 2.44 in Model 2.
* R-squared O O S C T (Campbell-Thompson): Ranges from minus 0.97 in Model 4 to 2.44 in Model 2.
Appendix I.
$ \Delta $
CIQ Betas and Firm Characteristics


TABLE I1 Long description
The table presents Fama-MacBeth regression results with five columns representing different model specifications: 1 Liquidity, 2 Funding, 3 Risk, 4 Fundamental, and 5 Full.
Key variables and coefficients (with t-statistics in parentheses):
* Liquidity fragility: lturnover shows a strong negative coefficient of -0.22 in model 1 and -0.21 in model 5. suv shows positive significance at 0.02 and 0.01 respectively.
* Funding and financial slack: roc is negative at -0.07 in model 2 and -0.03 in model 5. nop is positive at 0.09 and 0.06.
* Risk controls: beta is negative at -0.06 in model 3 and -0.03 in model 5. total_vol is negative at -0.22 and -0.08.
* Fundamental controls: pm_adj is negative at -0.06 in model 4 and -0.04 in model 5. investment is negative at -0.06 and -0.02.
Summary statistics at the bottom:
* Intercepts are -0.00 across all models.
* R-squared sub adj values range from 6.88 in model 2 to 12.86 in the Full model 5.
* Average number of observations n-bar is 2,578 for all models.
* Time periods T is 612 for all models.

TABLE I2 Long description
The table is organized into four sections:
Liquidity fragility and trading:
1. spread_mean: Average daily bid–ask spread.
2. dto: De-trended turnover – market turnover.
3. lturnover: Last month’s volume to shares outstanding.
4. std_turn: Standard deviation of daily turnover.
5. std_volume: Standard deviation of daily volume.
6. suv: Standard unexplained volume.
Funding and financial slack:
7. debt2p: Total debt to size.
8. roc: Size plus long-term debt – total assets to cash.
9. c: Cash to A T.
10. c2d: Cash flow to total liabilities.
11. free_cf: Free cash flow to B E.
12. nop: Net payouts to size.
13. d_so: Log change in split-adjusted shares outstanding.
Risk controls:
14. beta: C A P M beta using daily returns.
15. total_vol: Standard deviation of daily returns.
16. idio_vol: Idio vol of Fama–French 3-factor model.
17. ret_max: Maximum daily return.
18. rel_to_high_price: Price to 52 week high price.
19. cum_return_1_0: Return 1 month before prediction.
Fundamental controls:
20. lme: Price times shares outstanding.
21. beme: Book-to-market ratio.
22. e2p: Income before extraordinary items to size.
23. q: Tobin’s Q.
24. prof: Gross profitability over B E.
25. roa: Return on assets.
26. pm_adj: Profit margin – mean P M in Fama–French 48 industry.
27. investment: Percent change in A T.
28. noa: Net-operating assets over lagged A T.
Supplementary Material
To view supplementary material for this article, please visit http://doi.org/10.1017/S002210902610307X.
Funding Statement
This research has received support from the Czech Science Foundation under the 24-11555S project.


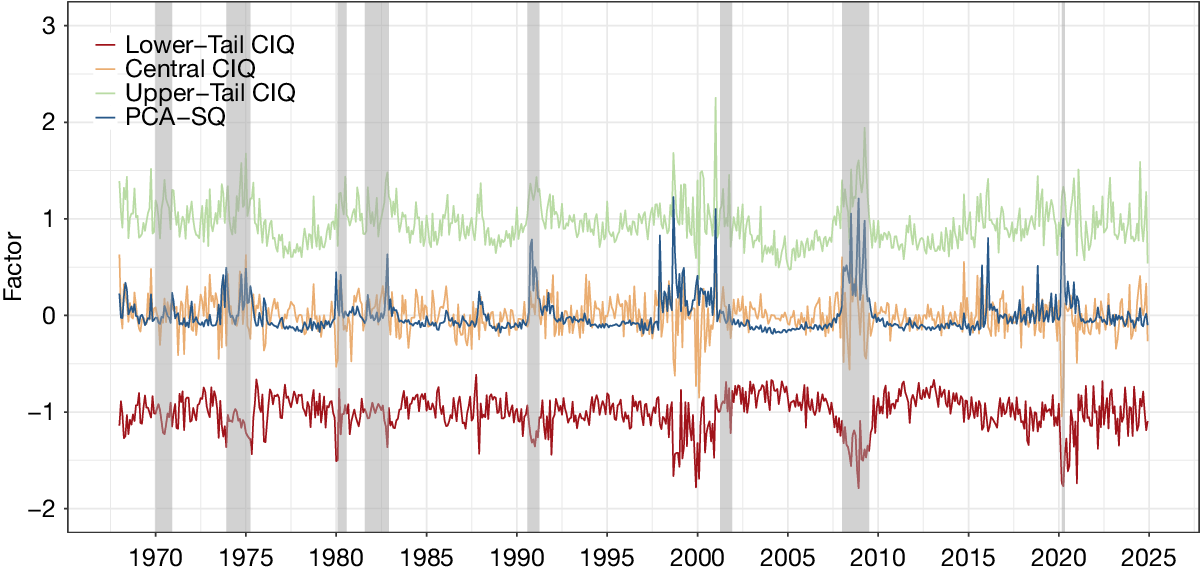


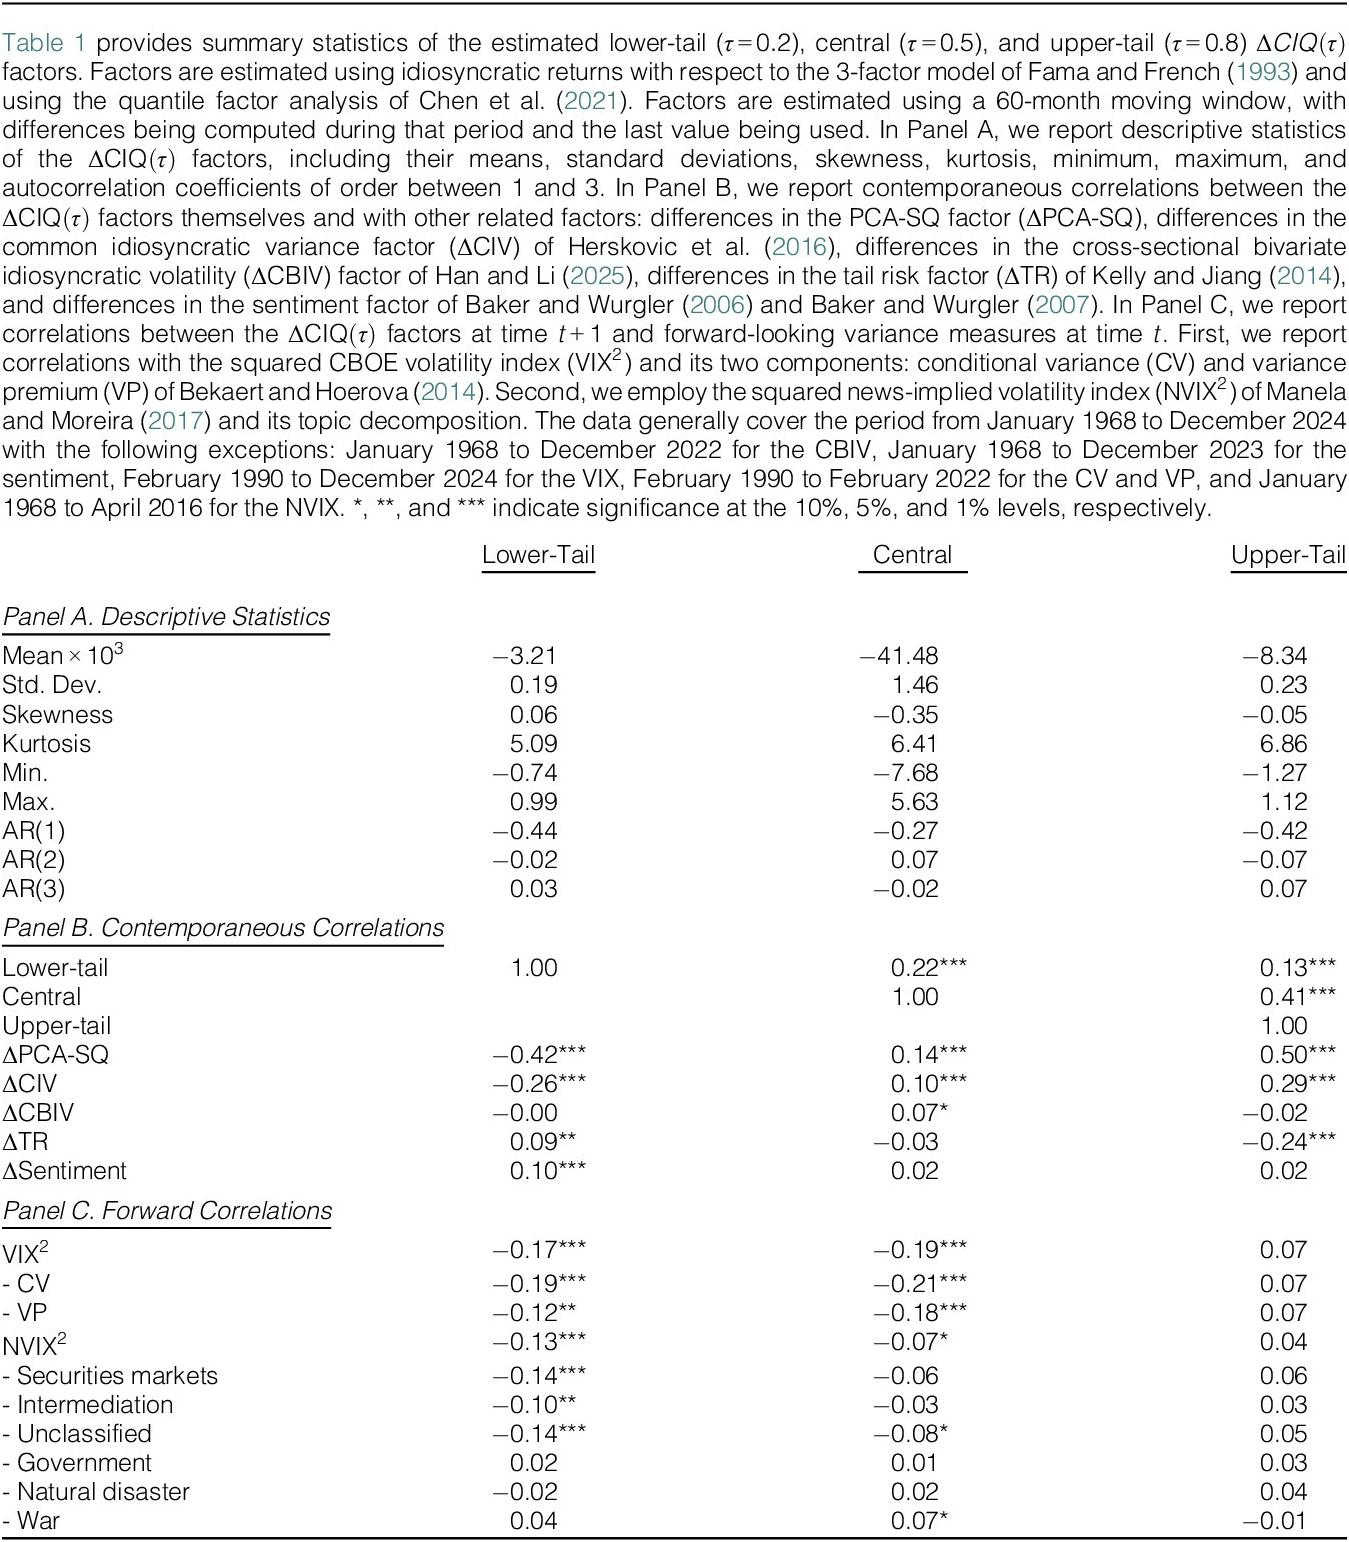

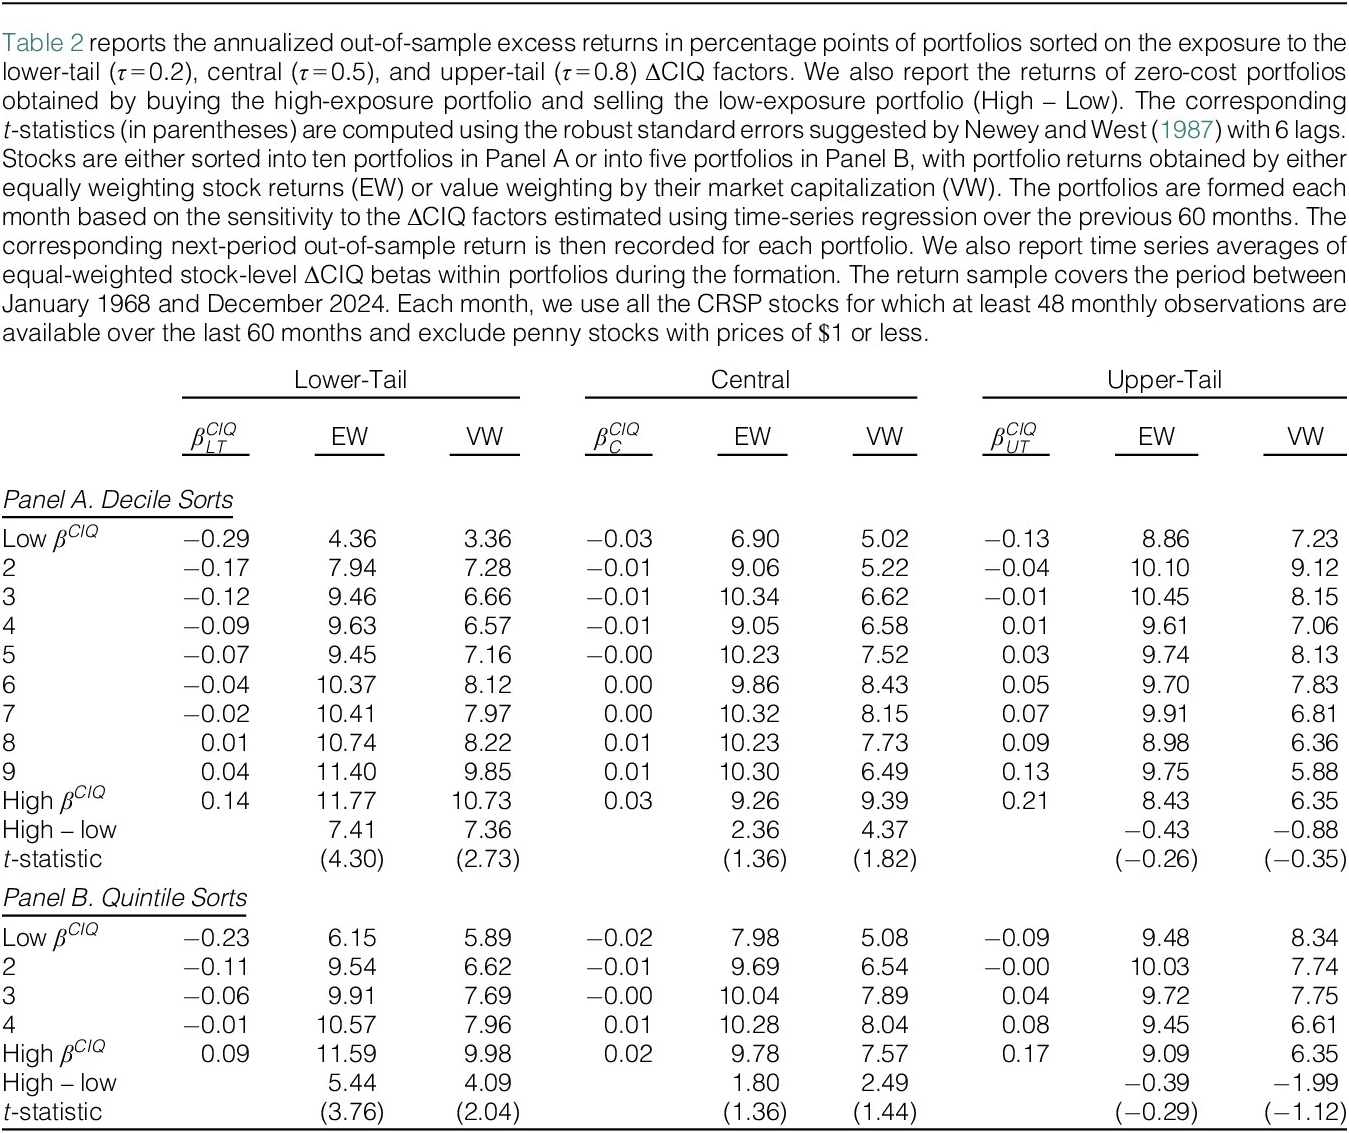

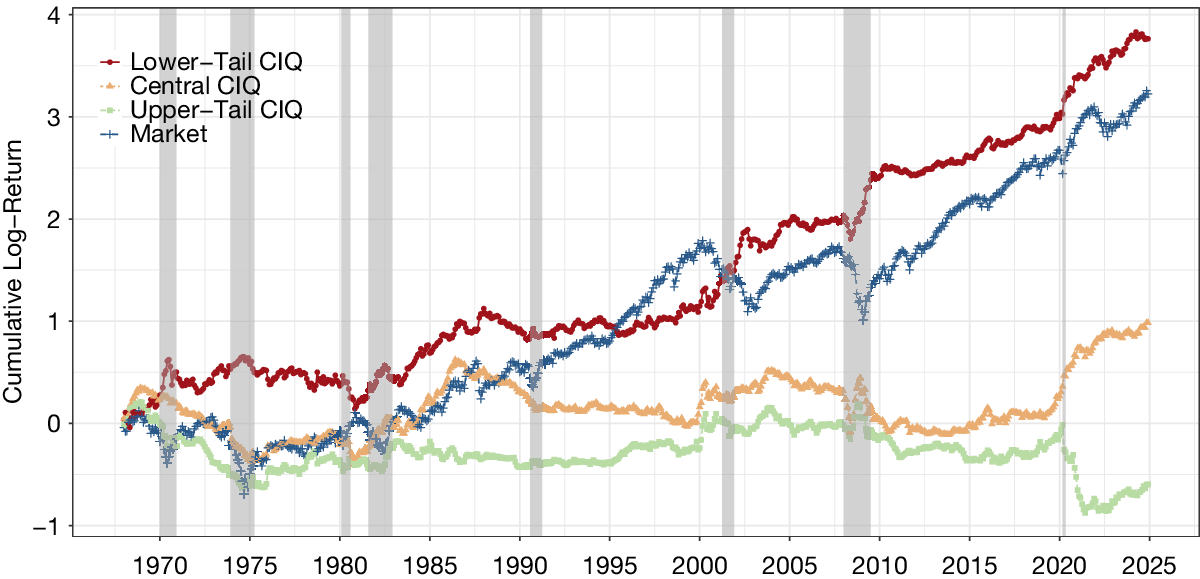


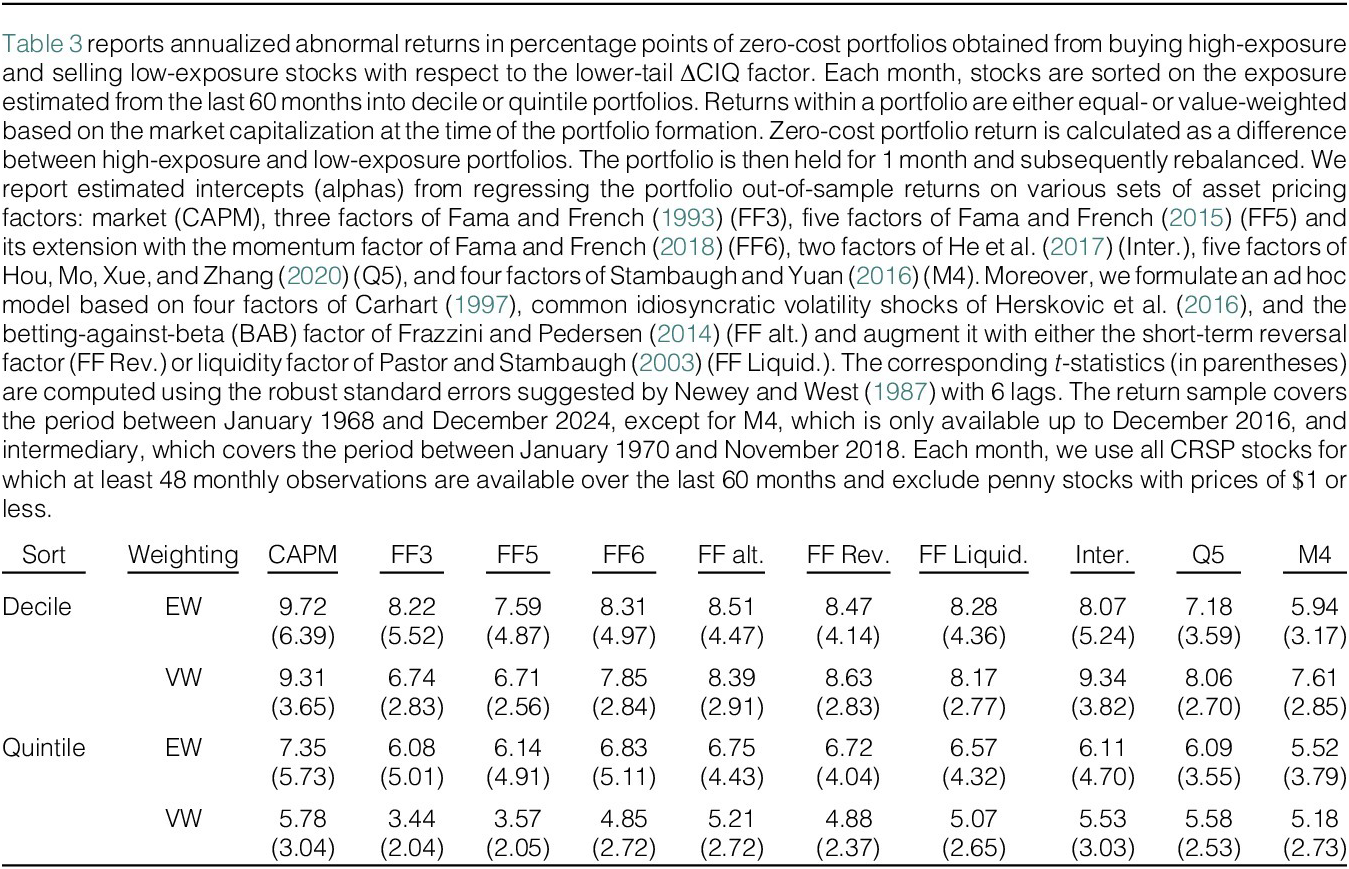

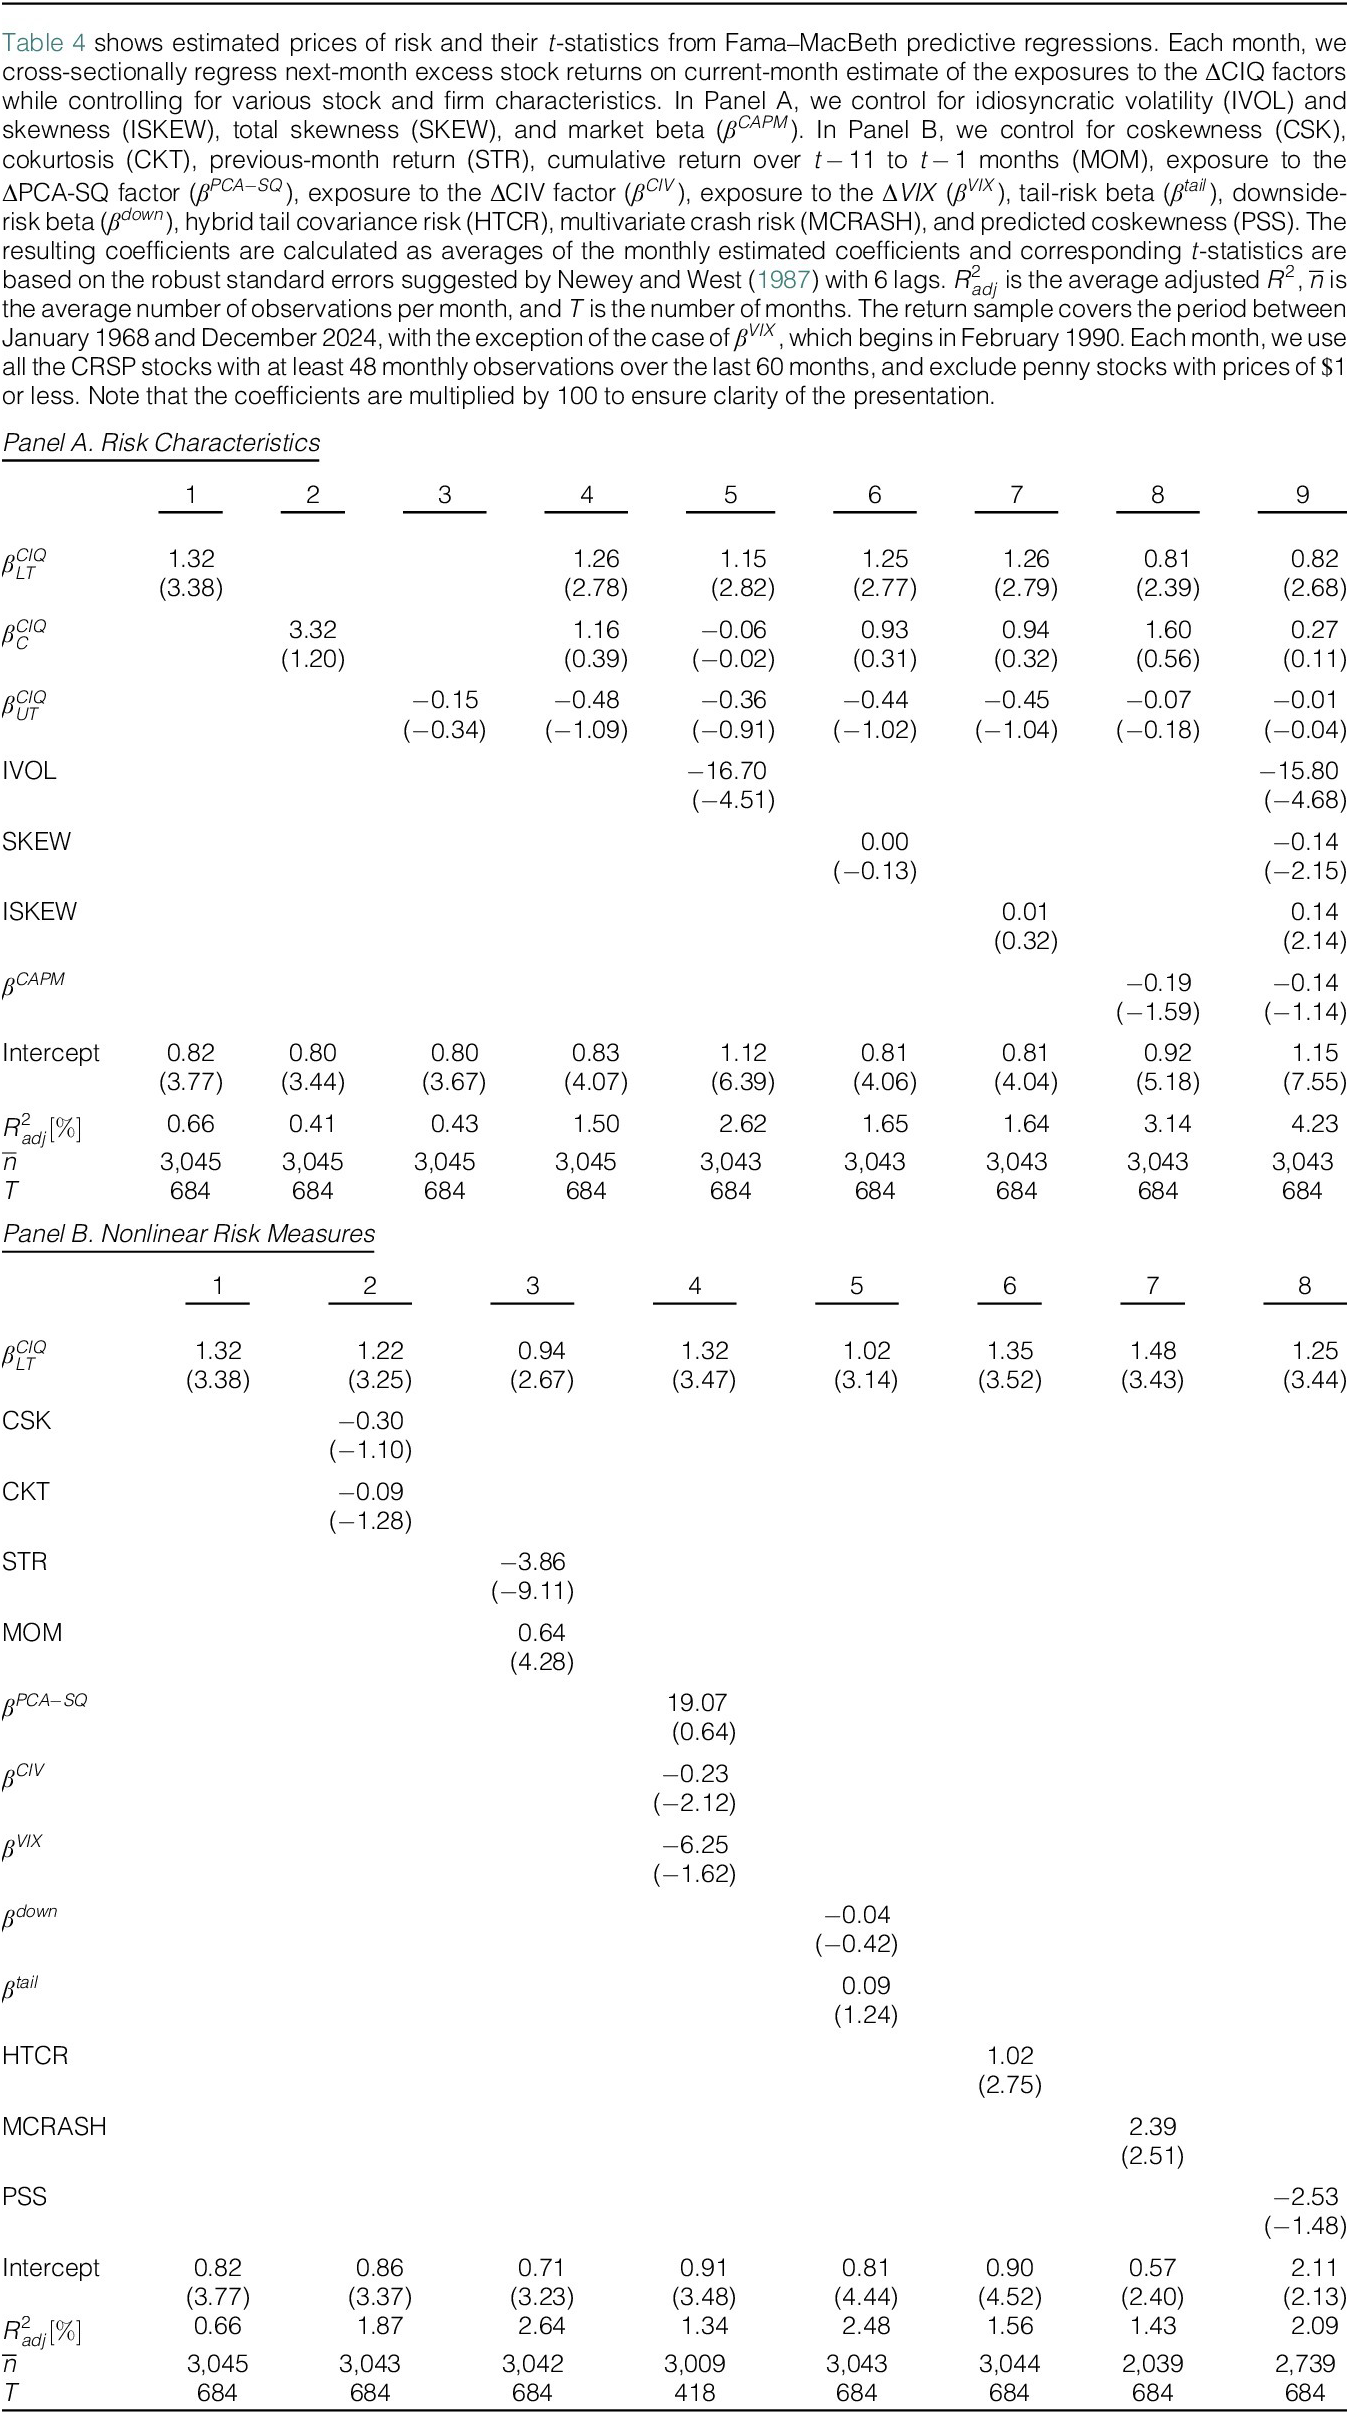
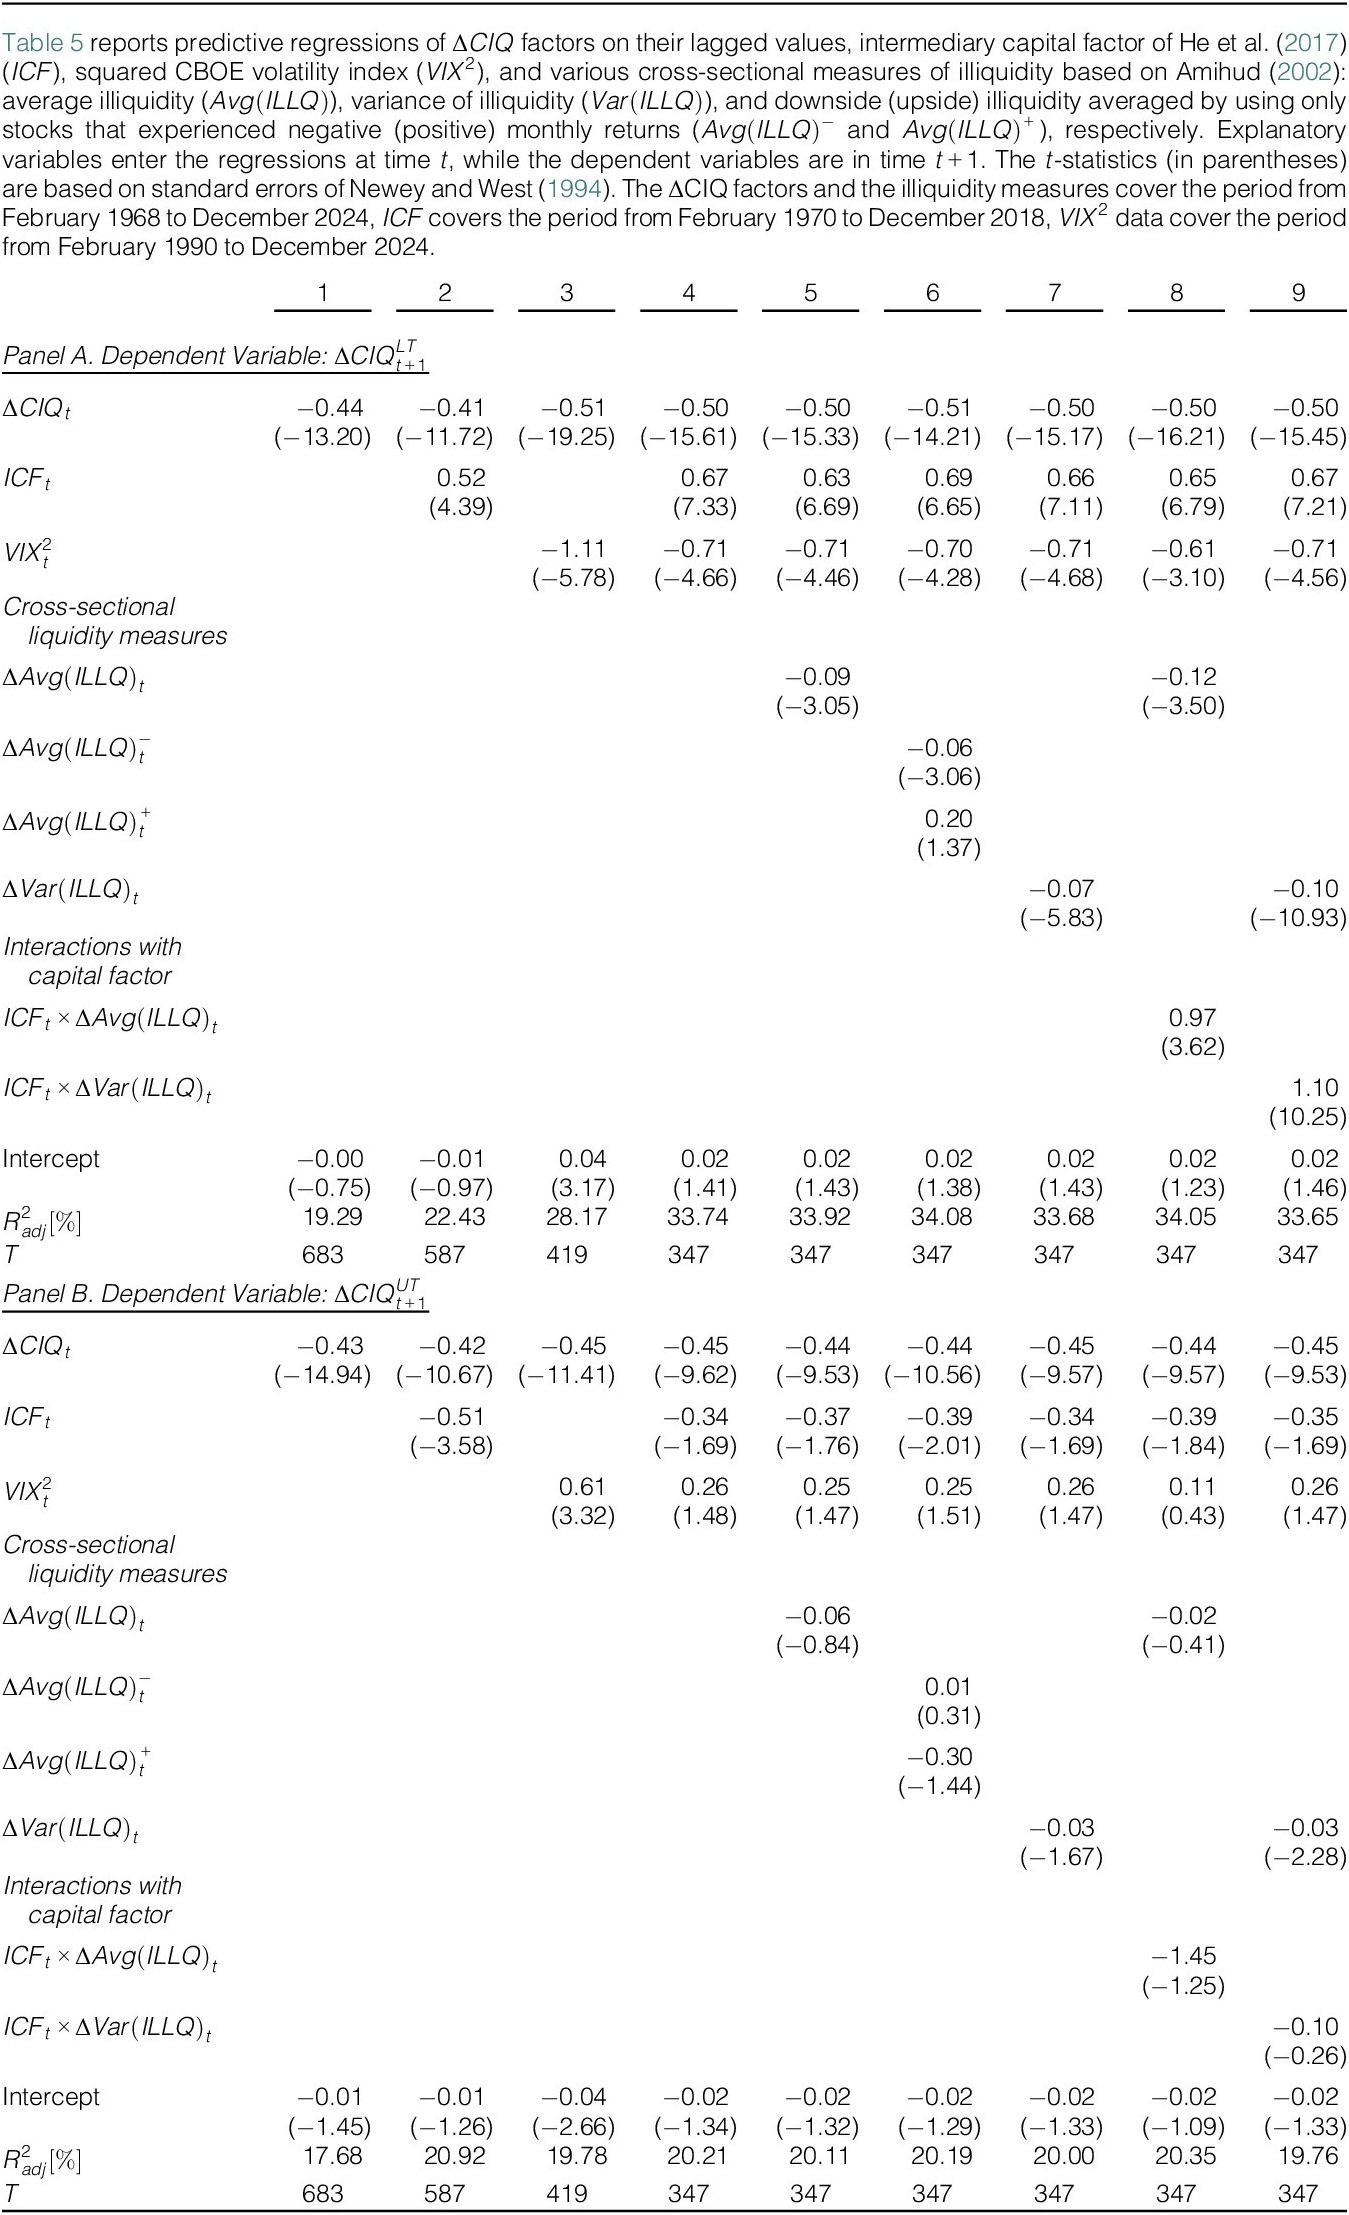

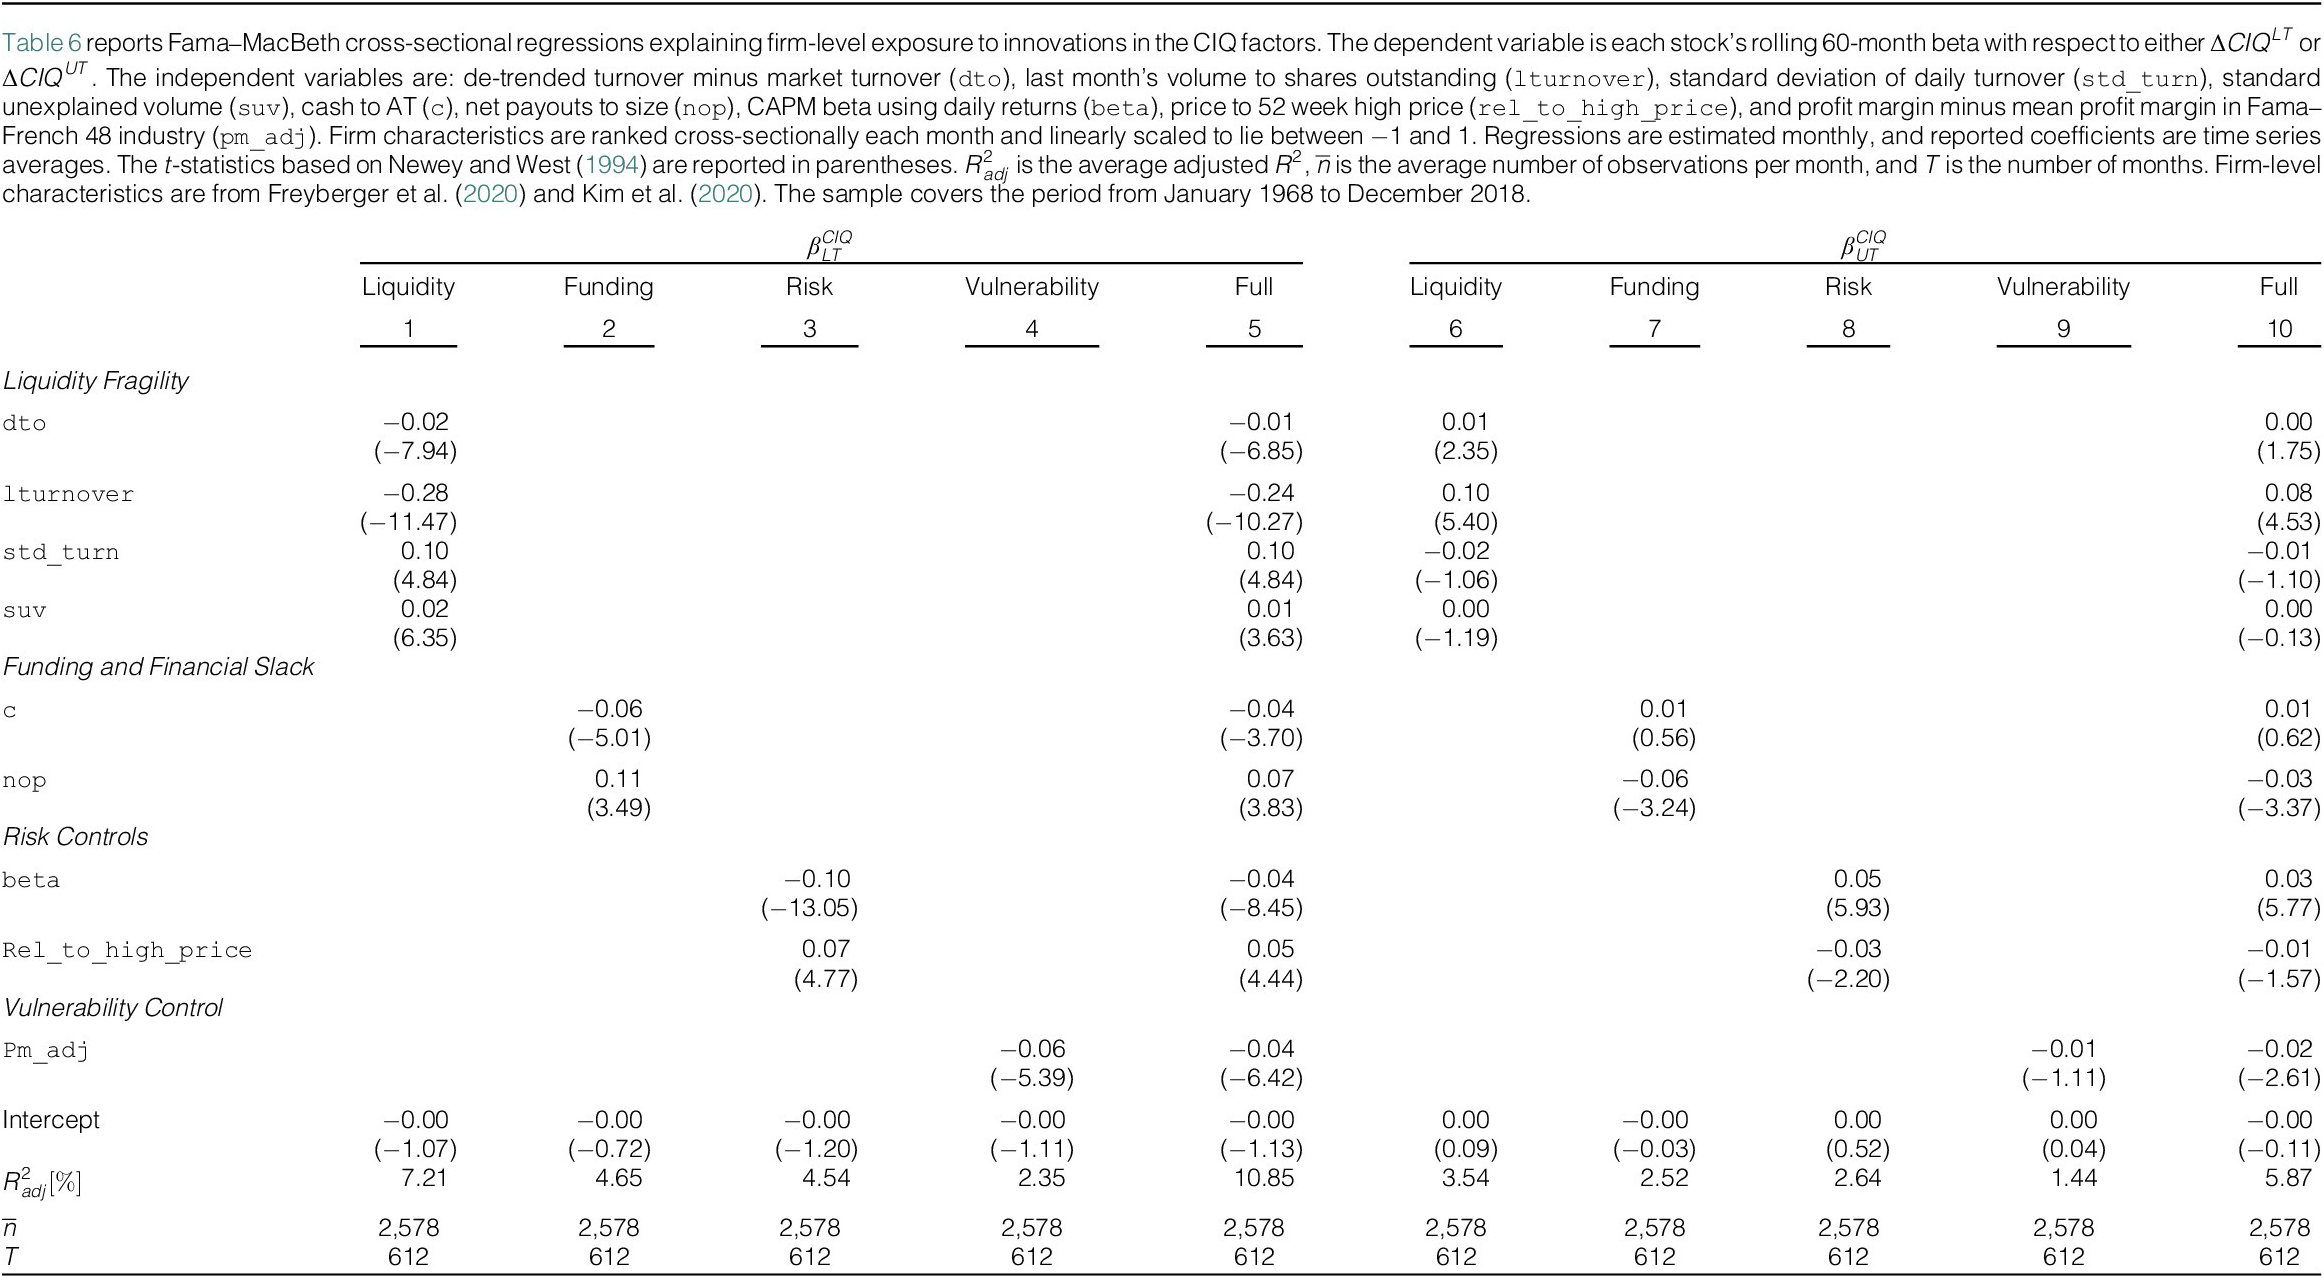
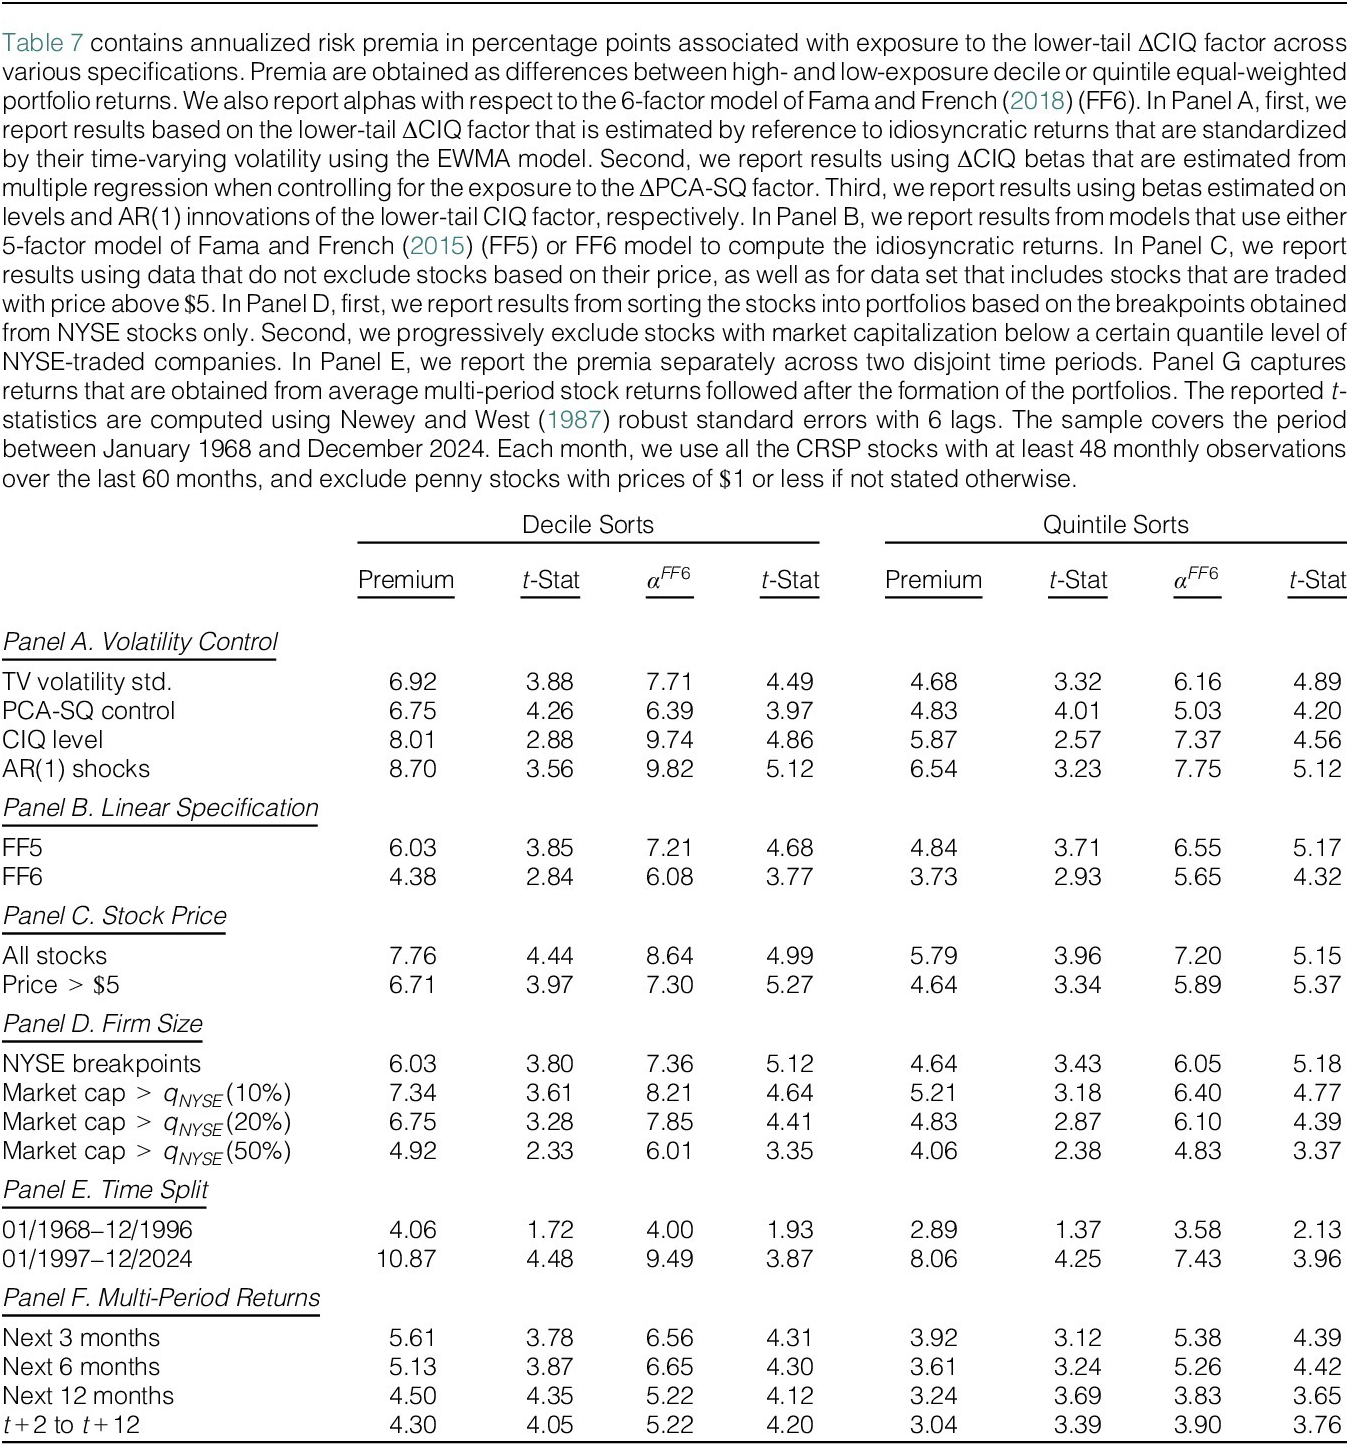

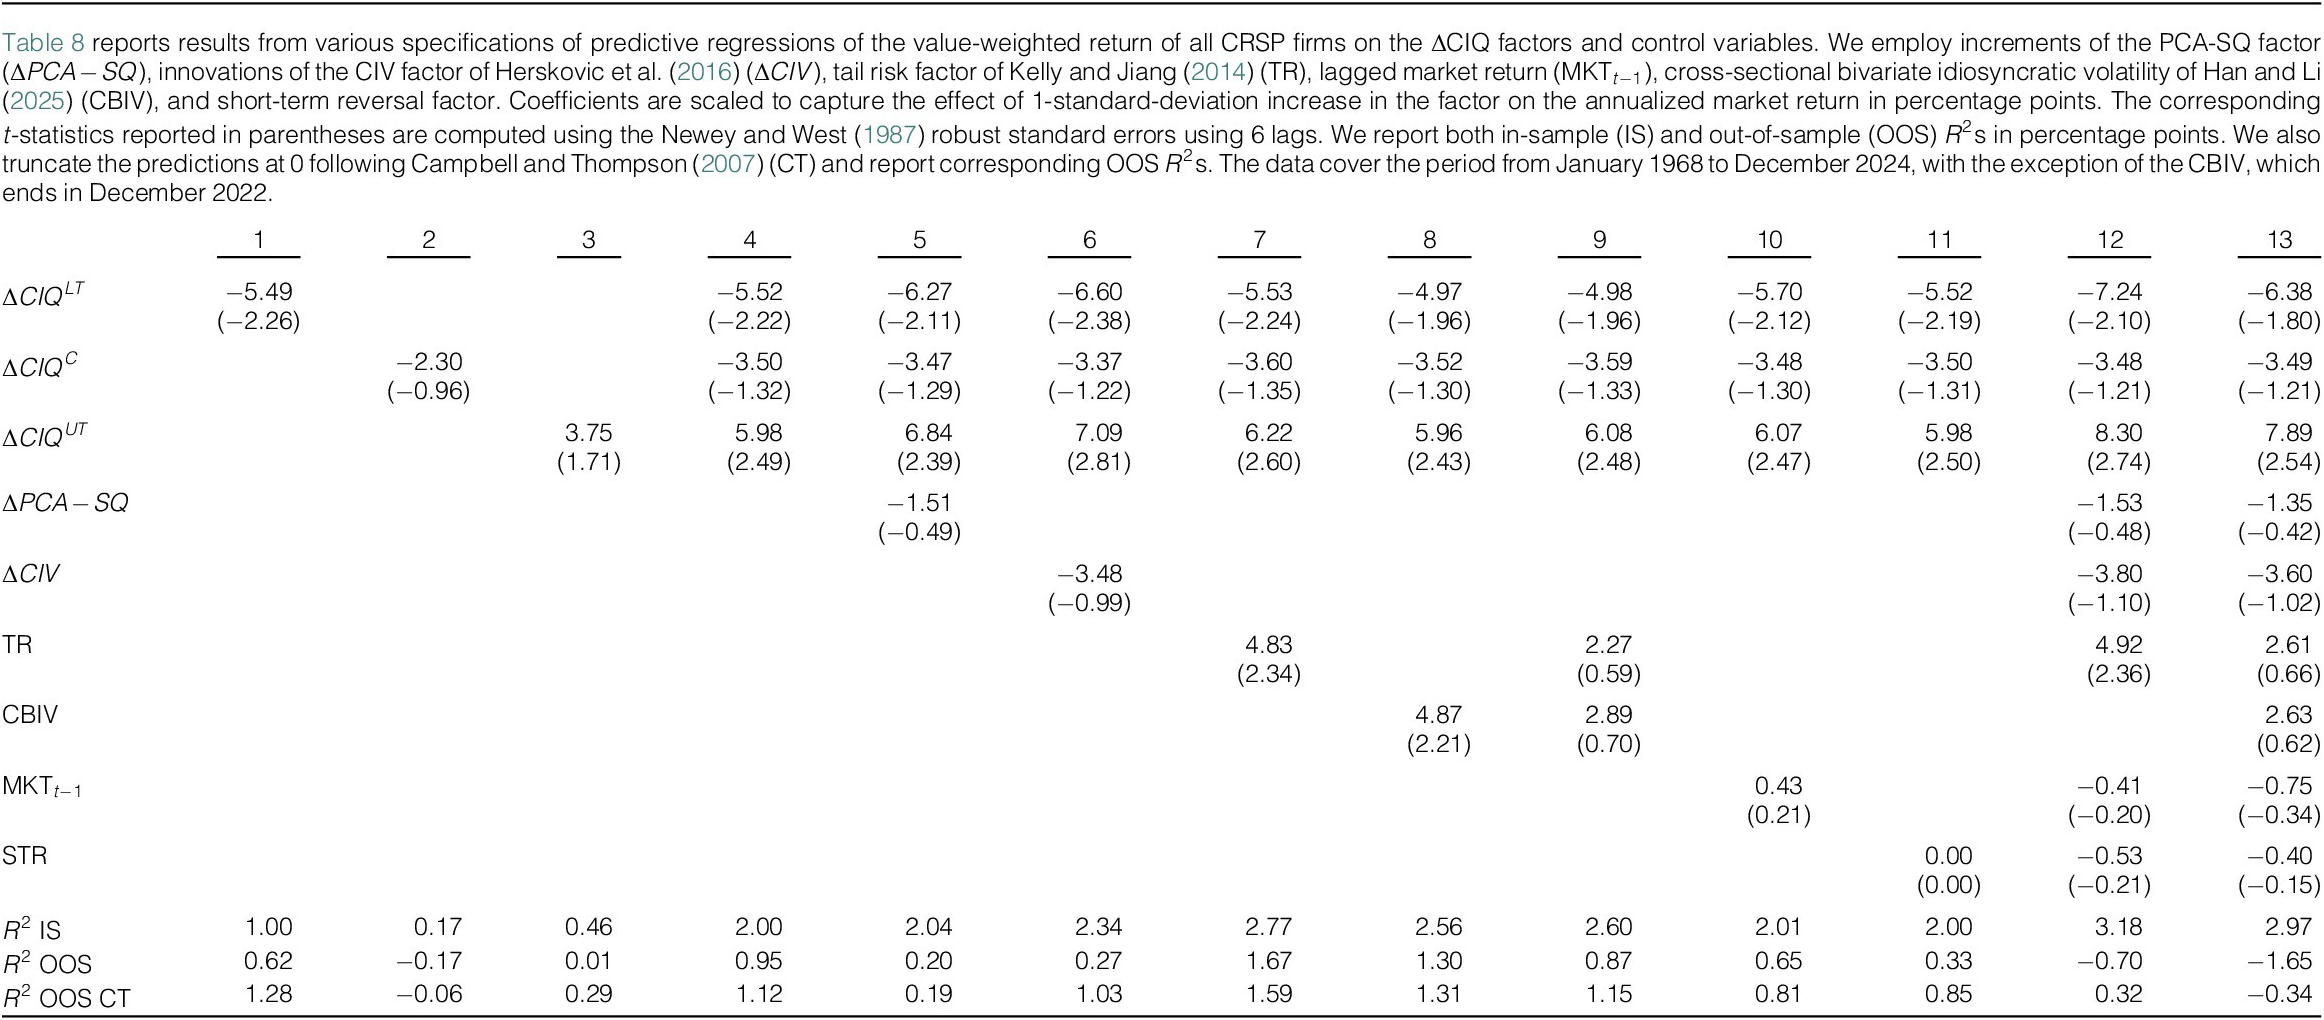

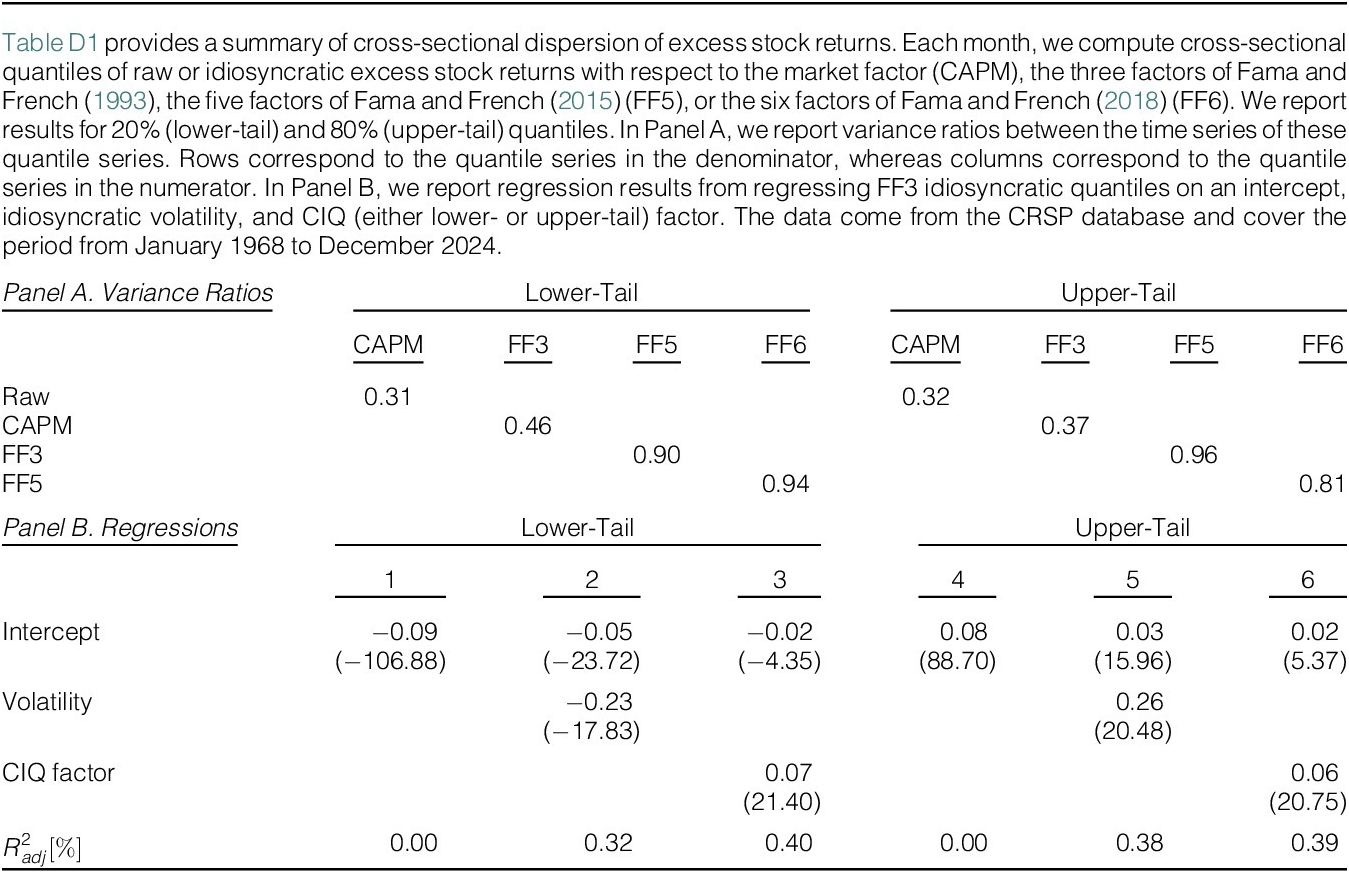
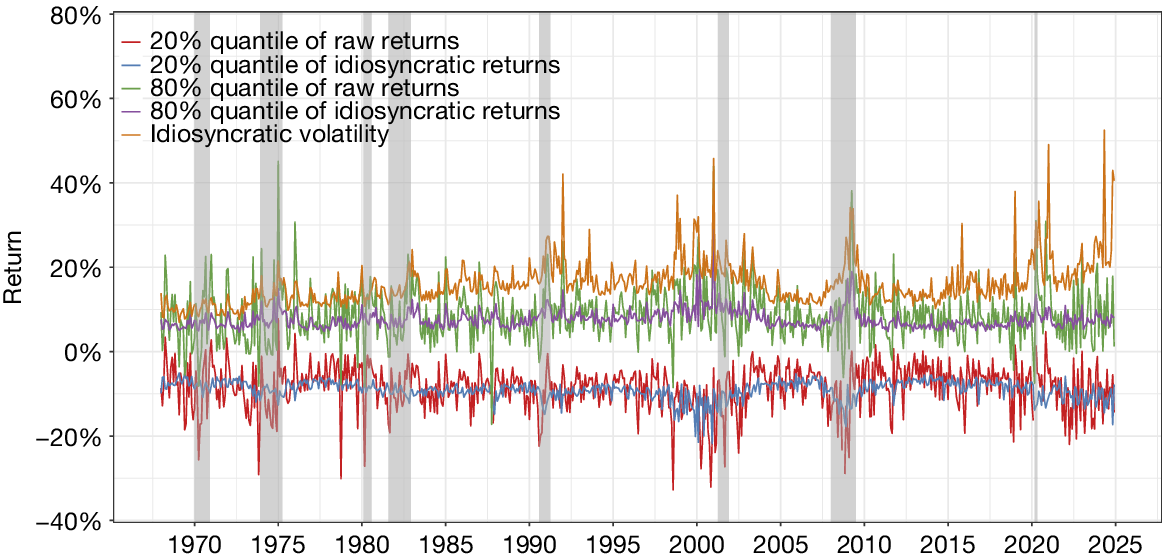
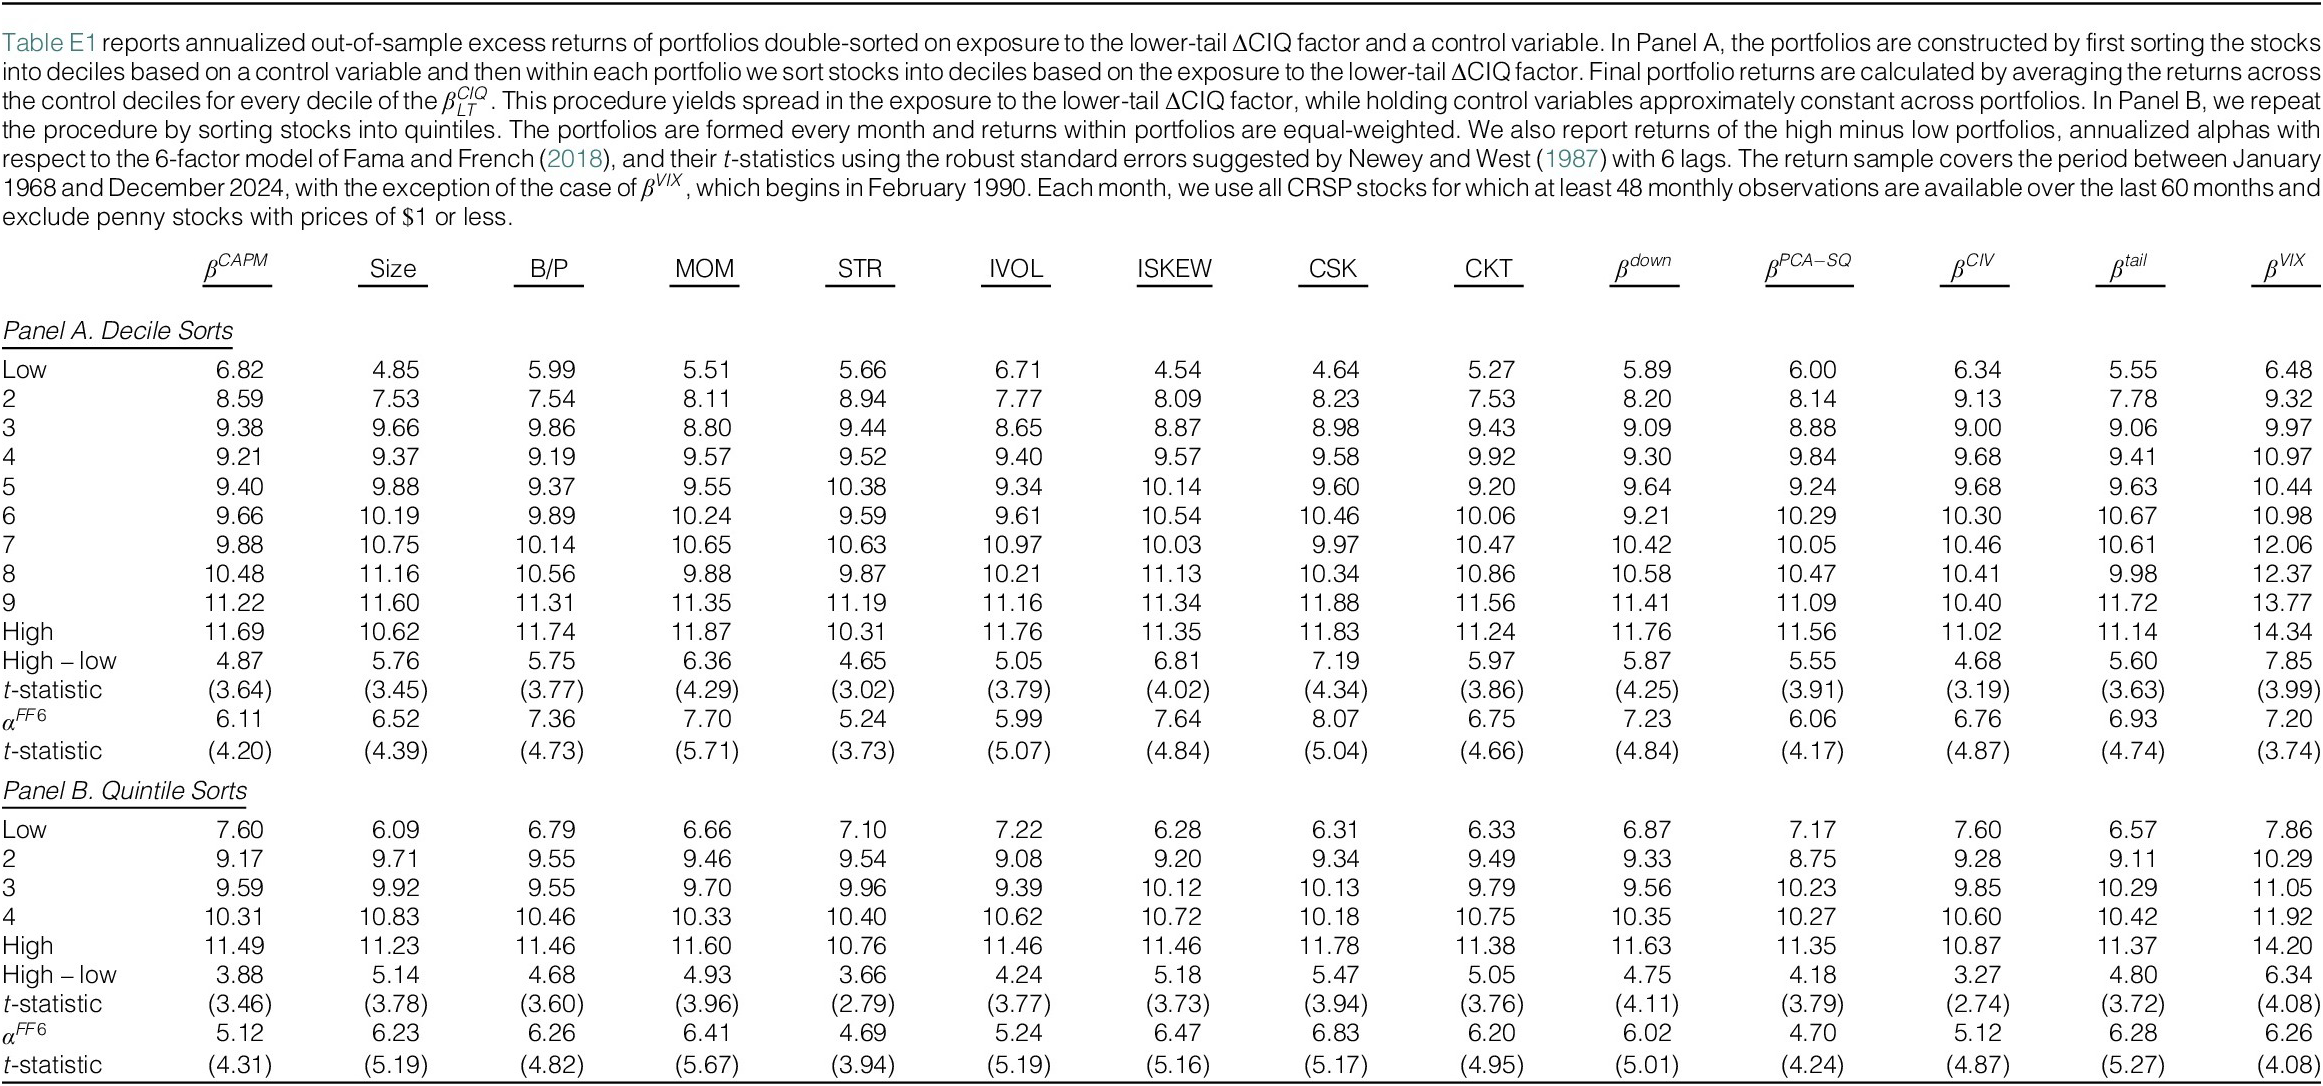
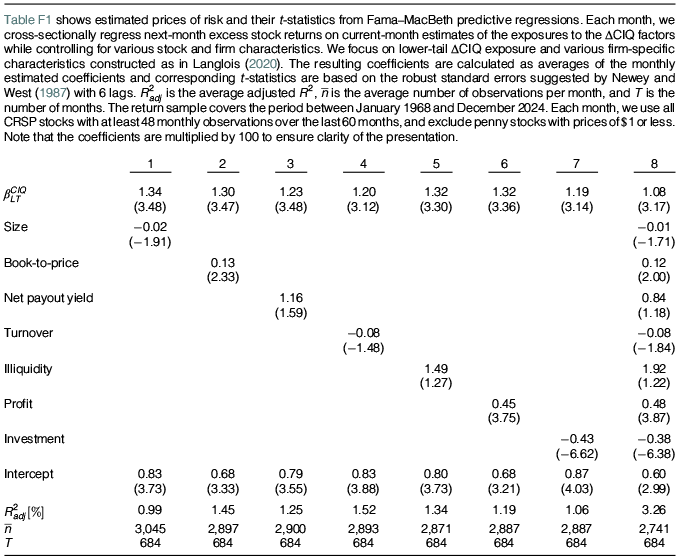
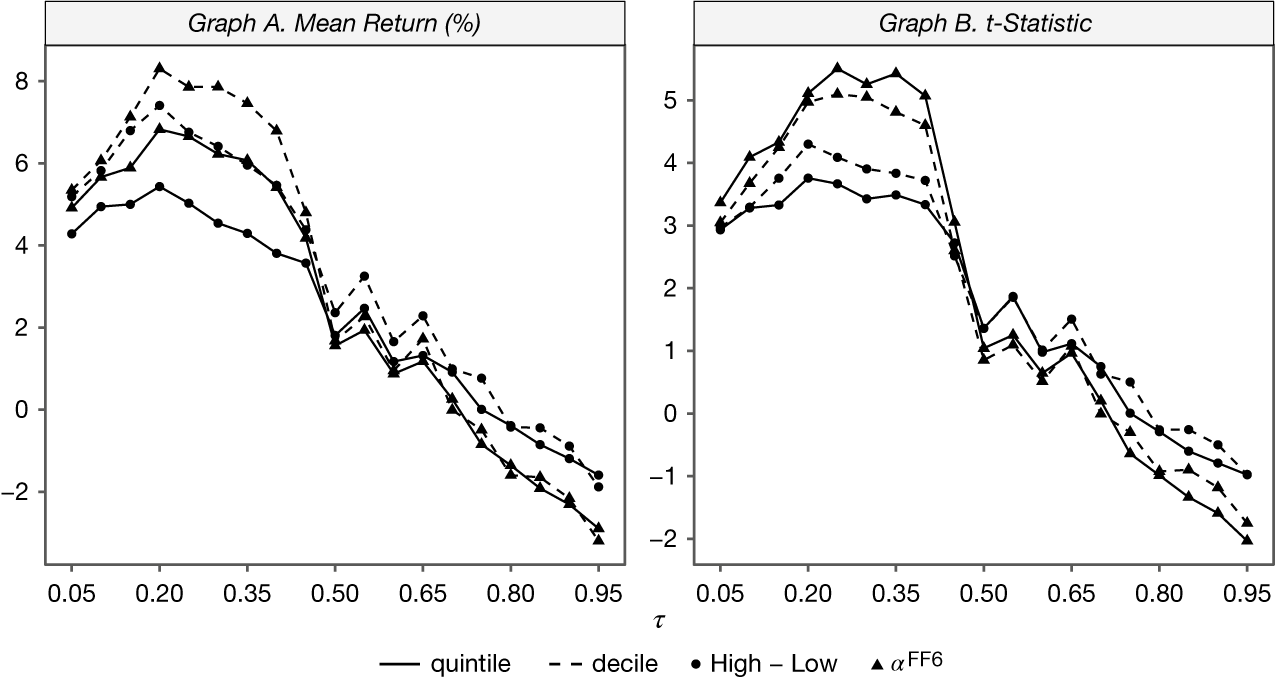


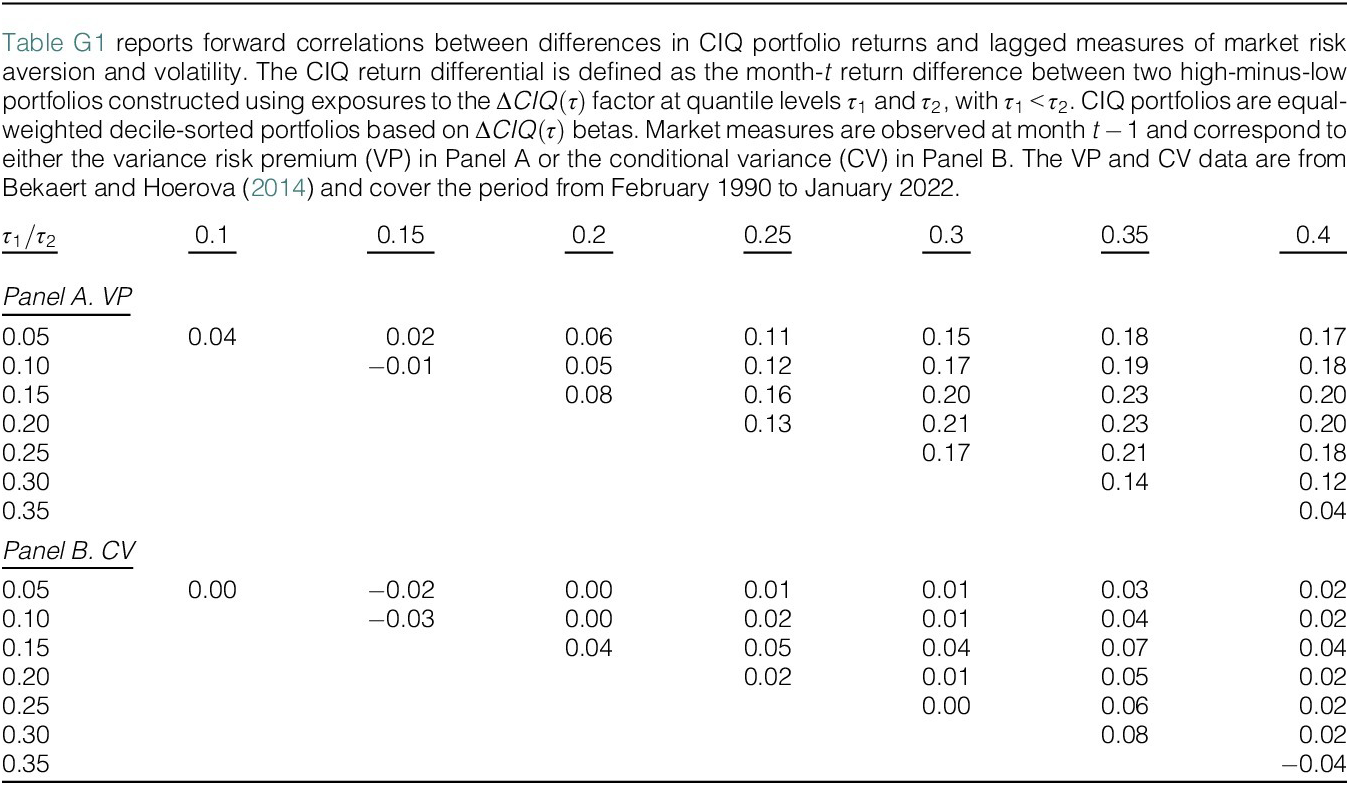
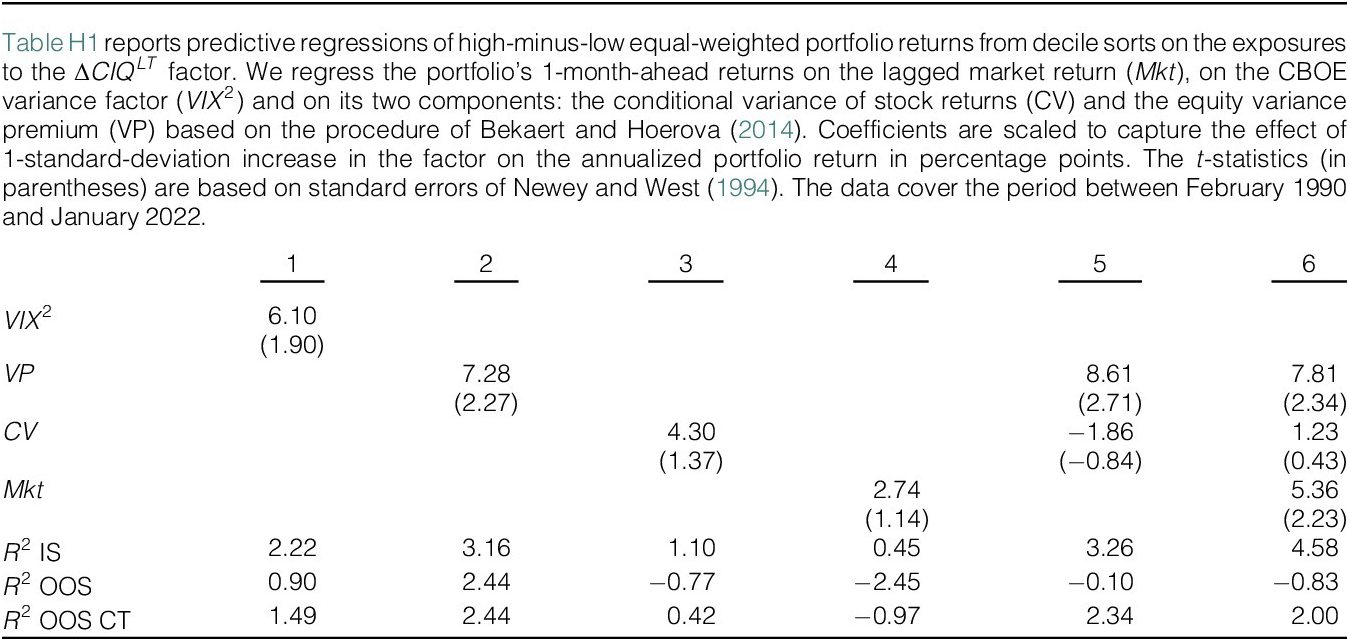

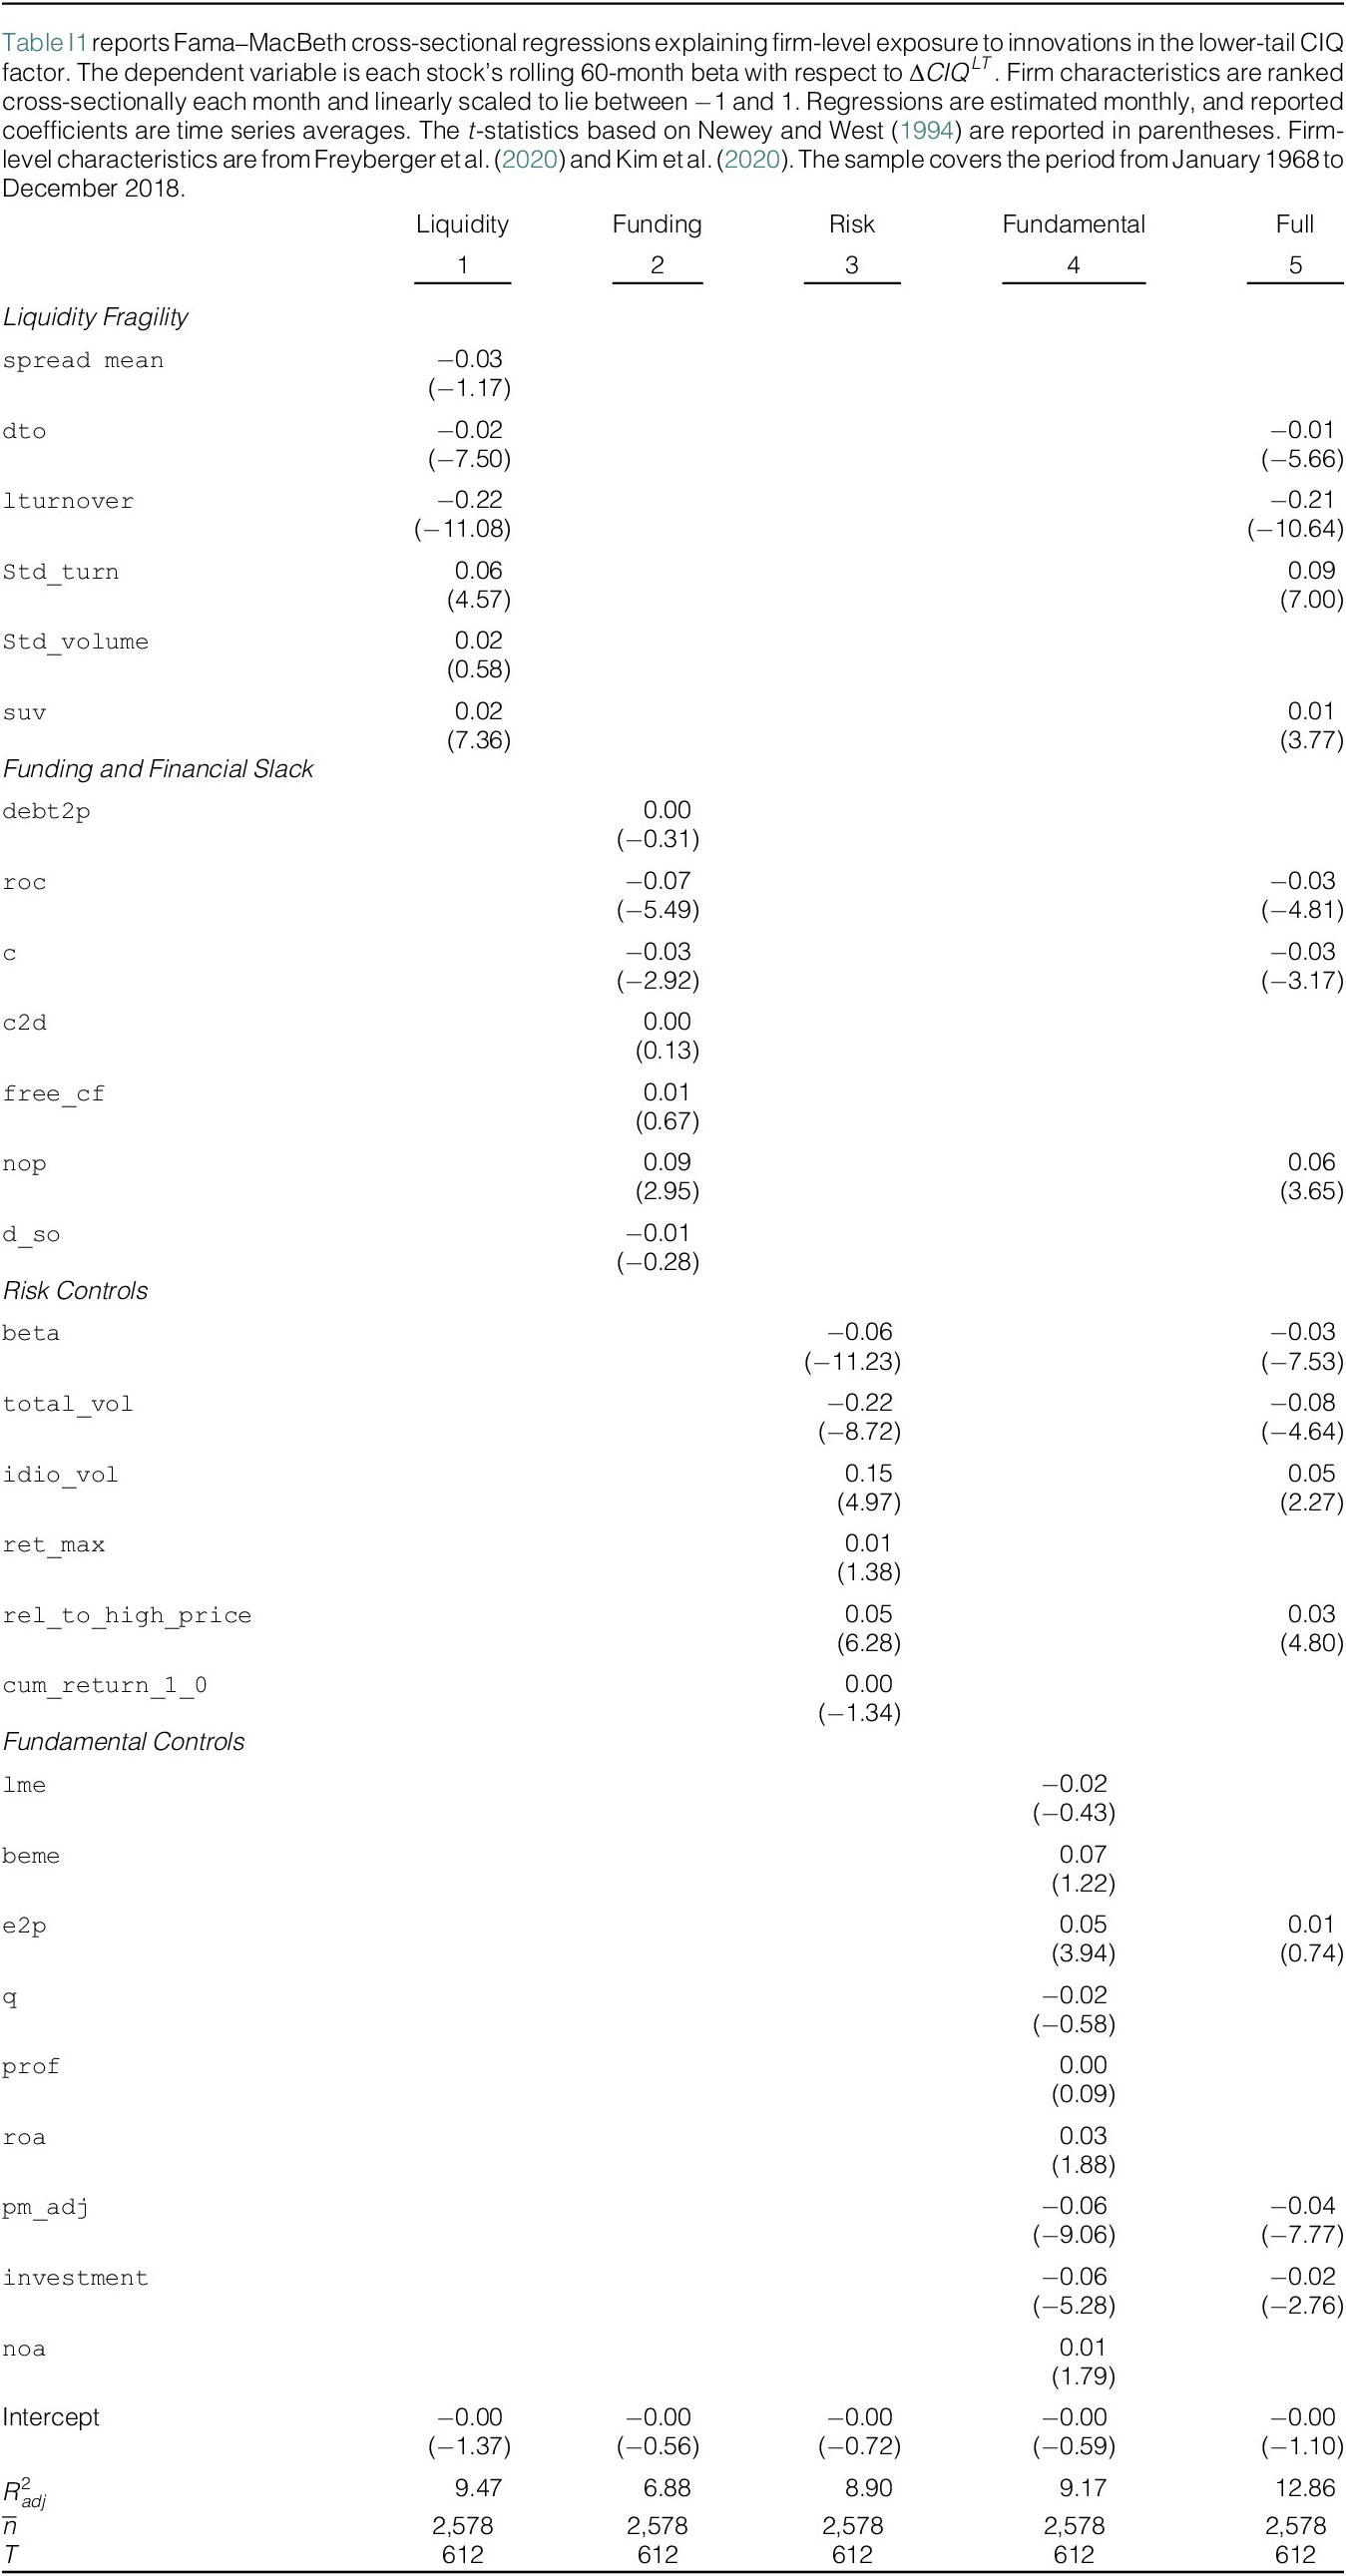
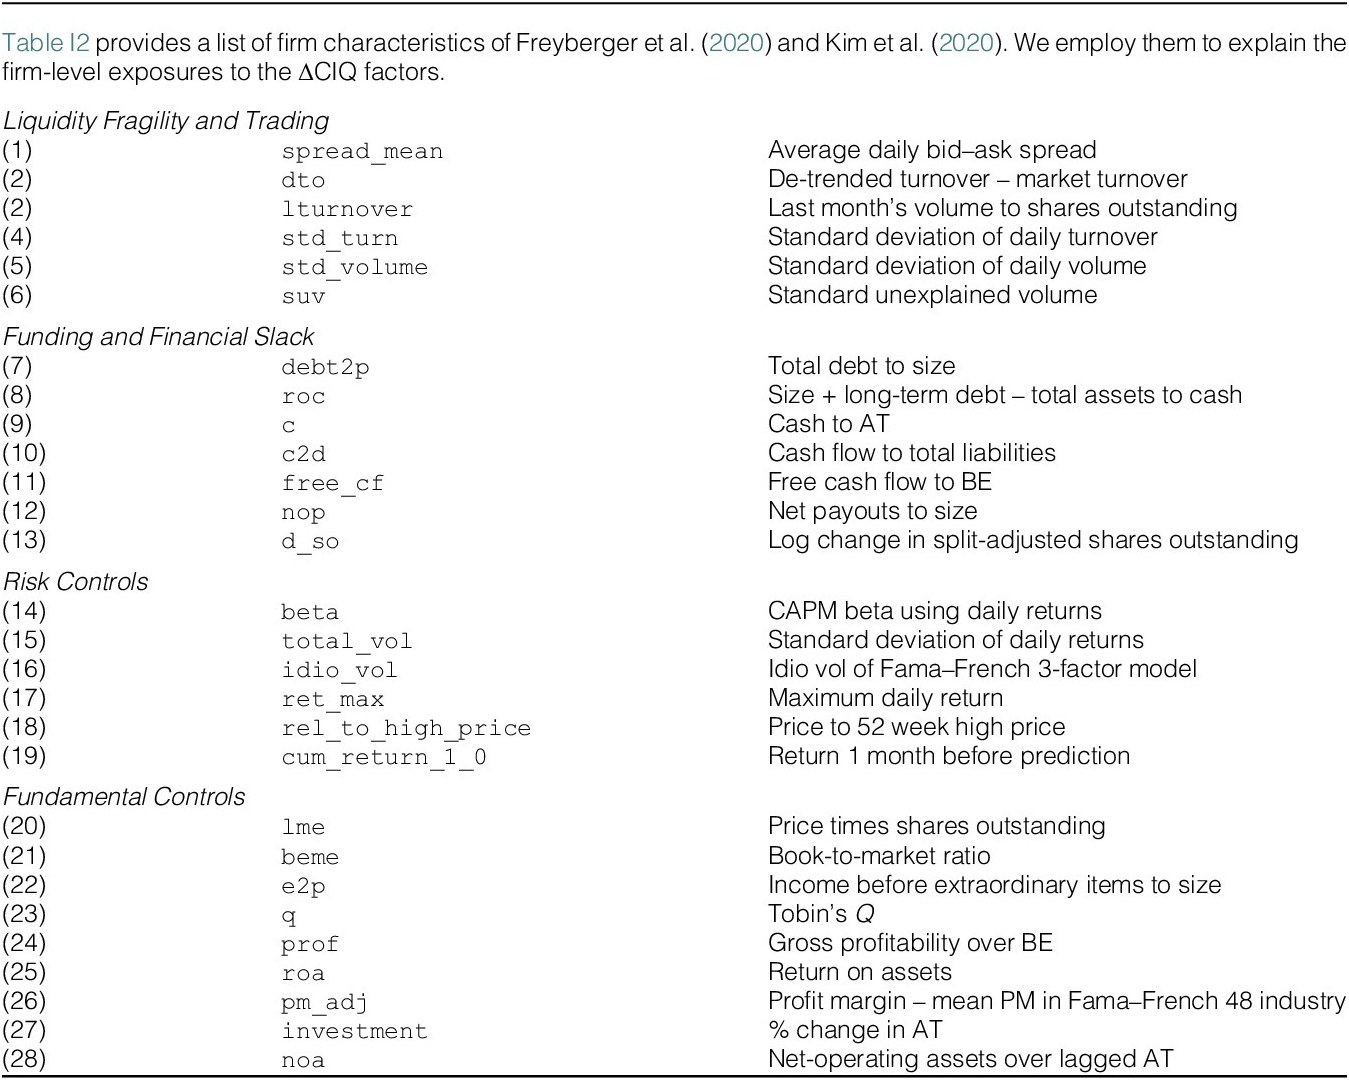


 Open access

