1. Challenges facing negotiators
Following an initiativeFootnote 1 at the Davos Forum of January 2014, a group of 14 countries launched negotiations on liberalizing trade in ‘green goods’ within the ambit of the WTO six months later in July. This move has been welcomed both as a sign that the WTO is still alive, and that a group of countries may, after all, take measures to reduce barriers to trade in environmental goods (EGs) and environmental services (ESs), as they had been mandated at the launch of the Doha Round in 2001.Footnote 2 At this stage, the commitment is only to a reduction in tariffs on EGs. Negotiations on ESs are off the agenda as they are still pending the outcome of the Trade in Services Agreement (TiSA) negotiations. Although the immediate objective is to reach a plurilateral agreement (PA), which requires consensus by WTO members and hence a ‘critical mass’ (usually measured by the share in world trade of the goods under negotiation by the participants to the agreement) of participants, any agreed reductions by the group of countries will be extended to other members. In 12 years, negotiations among WTO members on the reductions of barriers to trade in EGs and ESs have lost momentum. The PA route – which has already delivered progress on government procurement and on information technology products – could well become an alternative route to the multilateral and regional approaches to reach a negotiated agreement that would slash trade barriers in green goods.Footnote 3
The Davos announcement is intended to extend the reach of the tariff reductions to a larger group of countries than if these negotiations had taken place in the Asia-Pacific Economic Cooperation (APEC) regional setting. The countries have also agreed to start negotiations from an existing list of 54 goods drawn by the APEC members in 2012, a progress over the previous multilateral negotiations where countries failed to agree on the approach. However, will the list be extended to more goods and to non-tariff barriers (NTBs)? And how significant are these negotiations likely to be since ESs may not be included? Aside from China's participation and the possibility that reluctant WTO members like Brazil, India and South Africa might join in, is this initiative largely symbolic?Footnote 4 In short, what is the significance of this initiative (henceforth the Davos negotiations)?
Despite the WTO's recent failure to deliver negotiated agreements, its other functions (monitoring government decision making, resolving disputes) remain. Yet, it is still the case that, for many, the ultimate purpose of the WTO is to deliver negotiated deals that reduce discrimination. Knowing what is at stake as negotiations start is useful to better apprehend what can be achieved when negotiations first take place among a smaller group of countries. With a world moving towards variable geometry, an issue-specific PA can offer advantages over a preferential trade agreement (PTA) as it avoids the linkage issue and is open to newcomers wishing to join the negotiations. A PA should hence be able to sustain greater multilateral trade cooperation (Hoekman, Reference Hoekman2014). By documenting what is now on the table and the successes and shortcomings of the 12 years of the Doha negotiations (see Melo and Vijil, Reference Melo and Vijil2014), this paper informs on what might be hoped for from issue-specific negotiations among a smaller group of countries compared with a counterfactual PTA situation. The case of green goods examined here could also serve as a benchmark for other areas where dialogue, learning and negotiations could take place among a subset of WTO members, such as in the case of investment, competition policies and climate negotiations more generally (Victor, Reference Victor2015).
The more immediate objective of the paper is to inform about the likely gains of the agreed-upon Davos agenda which only includes tariffs (and perhaps NTBs) on EGs and to identify which complementary steps should be undertaken to reach the ultimate objective of global free trade in green goods and services. This appears a timely contribution to negotiations, as suggested by the comprehensive public consultation launched in June 2014 by the European Commission, which aims to collect the business community and the general public's views on barriers to trade in EGs and services.Footnote 5 As emphasized in work by the OECD and others, trade in EGs often embodies ESs with strong complementarities between the two, especially for developing countries that carry out environmental projects that embody EGs and ESs. This implies that reductions in policy-imposed barriers to trade in ESs should also be pursued. As discussed here, these restrictions are difficult to assess, but qualitative indices comparing commitments to market access and national treatment for ESs with those for other services give an idea of the extent of restrictions and of differences across countries.
Section 2 reviews the first challenge facing negotiators: the ‘technical’ difficulties encountered in identifying EGs and ESs in previous negotiations that will extend to the current negotiations. Section 3 documents the tariff structure for two lists of EGs for the Davos group members. These are then compared to those for a larger group of 120 countries to point out that the Davos group members have only small leeway to reduce protection. Estimates of import response to a 50 per cent and total reduction in tariffs are also provided. As an indication of the gains that might result from a reduction in barriers to trade in services, section 4 then reviews what has been achieved in terms of commitments to market access and national treatment. Section 5 concludes.
2. Obstacles in classifying environmental goods and servicesFootnote 6
Since all human activities have an impact on the environment (we are in the ‘anthropocene’), it is very difficult to measure progress (or lack thereof) relative to other activities that have a lesser impact on the environment. For EGs, once defined, a reduction or elimination of tariffs and NTBs should help diffuse the products and technologies necessary to reduce environmental damage (e.g., pollution at source or at end-of-pipe). But very often these products and technologies are part of environmental projects that include ESs (e.g., wastewater management services, water collection and purification, recycling). Thus, environmental projects have a great degree of ‘jointness’ or complementarity between the services provided by EGs and those provided by ESs. Actually, the latter tend to represent the predominant element in the package, about 65 per cent in value terms (Geloso Grosso, Reference Geloso Grosso2005). Moreover, as summarized in several case studies, ESs included in environmental projects cover an increasingly large array of services that extend beyond those that are classified as ESs (e.g., business and engineering services, telecommunications) in the WTO Services Sectoral Classification (W/120) list based on the UN Central Product Classification (CPC).Footnote 7 Complementarities are particularly strong in developing countries where trade in EGs and trade in ESs often involve the sale of turnkey installations (e.g., entire plants). Hence a reduction of barriers to trade in EGs unaccompanied by a reduction in barriers to complementary ESs may have little effect. These are the difficulties facing the negotiators from the countries who pledged to launch negotiations in the WTO on ‘green goods’.
2.1. How extensive is the classification of environmental goods?
Even though the negotiators have now agreed on a list of 54 goods as a starting point, they ‘… are committed to exploring a broad range of additional products’. Divergences in perceptions about what is an EG, and the inadequacy of the harmonized system (HS) for dealing with multiple-use goods remains an obstacle for any envisaged extension to that list. One solution is to use ‘ex’ headings for identification at the national line level, the implication then being that within an HS-6 digit level line, reductions may only cover a subset of products. Furthermore, the implementation of the agreement may vary between countries due to differences in interpretation by custom officials of the ‘ex’ heading description and to the complexity of national customs classifications, thus potentially leading to costly uncertainty for traders.
For instance, on average, the 14 Davos members have 118 national tariff lines at the HS-6 digit level (see online appendix, available at http://journals.cambridge.org/EDE). Extending, say, the HS system to distinguish energy-efficient refrigerators from others still does not solve the problem of multiple end-use, which besets many goods for environmental management (GEM).Footnote 8 An alternative would be to use the project or define-by-doing approach, which did not get support during the Doha negotiations. The drawback is that it is temporary and up for capture by interest groups.
Next, negotiators have been bogged down by the treatment of environmentally preferable products (EPPs) and ‘like products’ at the WTO. For some, an agreement on EGs should take into account how environmentally friendly a product is in its production, consumption or disposal. This calls for a life cycle analysis which might entail distinguishing goods by their processes of production methods (PPMs). While differentiation for statistical purposes should be possible, this would run into an interpretation of ‘like products’ since WTO agreements require that imported products receive no less favourable treatment than ‘like products’ of national origin, such as an energy-efficient washing machine or the use of low-emission technology in aluminium production.Footnote 9 Along the same vein, criteria are lacking to judge what is ‘environmentally friendly’. Apart from the divergence in preferences (conceptions of the ‘environment’) across countries, this is also due to the hurdles facing the completion of a life-cycle assessment as the same good may be used and disposed of in different ways. Again, using ‘ex’ headings for identification at the 8-digit or 10-digit level would be part of the solution. Among the 411 products on a WTO combined list, more than two-thirds only appeared on one submission list, an indication that the perception of EGs differs widely across countries (Balineau and Melo, Reference Balineau and de Melo2011).
Aware of these challenges, EGA participants decided to adopt an exchange of lists approach for final goods and their parts used in 10 environmental categories or sectors.Footnote 10 Products could be proposed if they had an environmental use (e.g., wind turbine gearboxes) or were part of an environmental system (e.g., waste container within a waste management chain). However, as previously discussed, reaching a consensus on the environmental credibility may be difficult for some products. As examples, Steenblik (Reference Steenblik2007) and Hufbauer et al. (Reference Hufbauer, Charnovitz and Kim2009) stress that the use of bio-fuels to save on energy and reduce CO2 emissions is at best doubtful, not to mention that today's cleanest available technology will change as technological progress occurs, calling for regular updates of the list of goods that would benefit from tariff exemptions. Moreover, the identification of EPPs requires an efficient disclosure mechanism, which can be very costly when attributes are not observable in the final product (e.g., efficient third-party certification for ‘credence goods’, calling for an international standard and certification process).Footnote 11
Several lists of EGs have been drawn up. After many rounds of submissions, in 2010 13 developed countries proposed lists resulting in a combined list (the ‘WTO list’ of 411 products that included many of the products in the earlier OECD and APEC lists). Another negotiated list is the ‘Friends of the Environment List’ of 154 products. Then in 2011, Australia, Colombia, Hong Kong, Norway and Singapore agreed on a supposedly non-controversial ‘core list’ of 26 products. An examination of the products on these lists showed that countries mostly submitted goods in which they had a revealed comparative advantage, which is commendable on efficiency grounds. But submitters also systematically excluded from their submission lists goods with tariff peaks, confirming mercantilistic behaviour (see Balineau and Melo, Reference Balineau and de Melo2013: table 1). It is quite likely that this behaviour will prevail when it comes to adding any further goods to the APEC starting list of 54 goods. Indeed, the APEC list of 54 products is the outcome of trimming from an original list of some 200-odd products. Melo and Vijil (Reference Melo and Vijil2014) reported estimates with both the ‘core list’ of 26 products proposed by a group of countries in 2011 and the ‘WTO list’ of 411 products drawn by adding all the lists, obtaining similar results with both lists. Since agreement on an extended list may be difficult to reach, we concentrate here on the APEC list of 54 products, but also report on some estimates with the most comprehensive WTO list, as an estimate of what might be at stake should countries agree on an all-encompassing list of EGs.
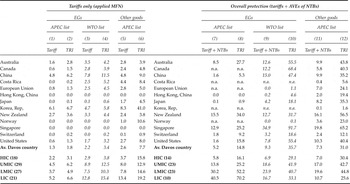
Overall protection by Davos country and income group

Notes: The income groups (number of countries in parenthesis) are (abbreviation and 2011 GNI per capita, y p , cut-offs in US$ in parenthesis): high-income (HIC, y p >US$12,476), upper-middle Income (UMIC y p > US$4,036 and US$ < 12,475), lower-middle income (LMIC, y p > US$1,026 and <US$4,035) and low-income countries (LIC, y p < US$1,025). To reduce the weight of extreme elasticity estimates, for each income group estimates outside the 1st and 9th deciles were fixed at the respective decile cut-offs.
The TRI is the uniform tariff which, if applied to imports instead of the current structure of protection, would leave welfare at its current level. Melo and Vijil, (Reference Melo and Vijil2014) also report estimates of the uniform tariff (the OTRI) which, if applied on home imports instead of the current structure of protection, would leave aggregate imports at their current level. The formula captures the fact that the welfare costs of tariffs rises more than proportionately with the tariff and that it is positively related to the variance in tariffs. The formula for the TRI for country c is:
 $$TRI_{c} = \left(\displaystyle{{\sum_{n}m_{n\comma c}\varepsilon_{n\comma c}T_{n\comma c}^{2}} \over {\sum_{n}m_{n\comma c}\varepsilon_{n\comma c}}}\right)^{\displaystyle{{1}\over{2}}}\semicolon \; T_{n\comma c}=\lpar mfn_{n\comma c}\semicolon \; mfn_{n\comma c}+ntb_{n\comma c}\rpar \semicolon \;$$
mfn n,c = applied MFN tariffs and ntb n, c = ad valorem equivalent of NTBs from Kee et al., (Reference Kee, Nicita and Olarreaga2009), for product n at the HS six-digit level in country c;
m n,c = import value (thousand US$) and
ε n,c = price import demand elasticities for product n in country c taken from Kee et al. (Reference Kee, Nicita and Olarreaga2008).
Source: Authors’ calculations from TRAINS and WDI data from the World Bank, BACI data from CEPII and Kee et al., (2008, Reference Kee, Nicita and Olarreaga2009) for elasticities. Data was extracted in 2013. APEC list has 54 products and WTO list has 411 products. Income groups are simple average values. Applied MFN tariffs and imports are mean values for 2010–2011. All tariffs and ad-valorem equivalent of NTBs are import-weighted. Estimates for ‘other goods’ using the WTO list are not reported as they follow a similar pattern to the APEC list of 54 products. Trade data is missing for Chinese Taipei in the BACI database hence the Davos group list is reduced to 13 countries. Furthermore, as data on NTBs are scarce for many countries, individual Davos countries figures displayed in columns 7–10 must be considered with extreme caution as the lines with missing NTB estimates are eliminated from the estimates in column 9. For example, China only has NTB data for five products on the APEC list, so the average estimate in column is over five products, which explains why that total protection estimate in column 7 is lower than the tariff estimate in column 1.
2.2. Classifying environmental servicesFootnote 12
The difficulties facing the TiSA negotiations are an order of magnitude greater than those facing negotiations on EGs. It is therefore likely that any negotiation will take place around the WTO Services Sectoral Classification (MTN.GNS/W/120, hereinafter ‘W/120’) list which is largely based on the Provisional UN CPC codes, although the inadequacies of that list and CPC codes will present a major hurdle in reaching agreement, even for OECD countries.
Production is increasingly taking the form of trade in tasks (i.e., services) as opposed to trade in products. Services play an input function through space (transport, telecommunications) and time (financial services) as well as direct inputs into economic activity as they generate knowledge and human capital. Recent developments in the study of global value chains show that services may account for more than 50 per cent of exports when measured in value added (OECD, 2014). Indeed, manufacturing increasingly buys, produces, sells and exports services (called ‘the servicification of manufacturing’). However, the linkage between intermediate services, regulation and policies is still largely unexplored, if only because of the lack of data both on services and on regulations (services do not meet customs for registration, and regulations are, at best, imperfectly captured). Unlike goods trade flows for which data exist because they are taxed, services – except for labour and FDI flows – are not directly observed crossing borders. Furthermore, since disembodied trade is becoming more important as the burden of proximity has loosened, the tracking of flows is poor and, at best, spotty. These characteristics make it difficult to draw an informative and comprehensive list of ESs, even though some tentative lists exist (WTO, 2000; National Board of Trade, 2014).
Negotiators would like to have indicators of trade restrictiveness measures for services. Building indicators implies taking into account three characteristics of services: (i) the proximity burden; (ii) their ‘change-effecting’ nature; and (iii) their ‘margin sectors’ characteristic. A proximity burden is imposed on certain forms of services because, unlike goods, they cannot be stored. Even though technological change has led to the geographical splintering of the production chain for both tangible inputs and for services, trade in services may require a heavier dose of local presence of suppliers in the mix of cross-border and locally produced services than in the case of goods. In addition, services provision will often have ‘jointness in production’ as complementary inputs – including other services – are needed to allow effective exchange (trade) to occur. The proximity burden is handled in the general agreement on trade in services (GATS) four-way classification of services:
-
• Mode 1: No movement of either supplier or buyer (direct cross-border trade; for example, remotely monitoring of air pollution levels);
-
• Mode 2: Customer moves to the country of the provider (for example, country A shipping waste to country B for treatment and disposal);
-
• Mode 3: Commercial presence through sales of an affiliate (multinational enterprise; is the predominant mode of supply in ESs as many are infrastructure dependent and require a continuous and long-term local presence);
-
• Mode 4: Temporary movement of natural persons to provide services (very relevant for ESs; for example, intra-corporate transferees of managers and technicians with specialized skills, or independent suppliers of environmental consulting and audit).
For modes 2 and 4, indicators of reducing restrictions on the movement of natural persons and providing market access on non-discriminatory terms (and guarantees for repatriation of funds as provided for in the large number of bilateral investment treaties) for foreign firms can provide a rough approximation of trade liberalization. For modes 1 and 3, much like the choice between vertical and horizontal FDI, the mix of trade and coordination costs (inclusive of policy-imposed trade barriers) will determine firms’ choices. Changes in trade policies that affect the balance of these costs (e.g., contract costs vs. management costs) will then determine the choice of mode, if choice there is, since modes of supply may be complements or substitutes. If the unconstrained mode is the most efficient mode, and modes are substitutes, changes in constrained modes will have no effect, whereas if modes are complements, a liberal policy in one mode would have no effect on the provision of the service.
ESs are mainly ‘change-effecting services’ or ‘transformation services’, in the sense that they are the result of a production activity that changes the conditions of the consuming unitsFootnote 13 (e.g., remediation and clean-up of soil and water). The complete list of services sectors negotiated at the GATS during the Uruguay Round has 155 subsectors, among which four subsectors are categorized as ESs. These are:
-
(a) sewage services (CPC Prov. 9401);
-
(b) refuse disposal services (CPC Prov. 9402);
-
(c) sanitation and similar sectors (CPC Prov. 9403); and
-
(d) other services (CPC Prov. 9404; CPC Prov. 9405; CPC Prov. 9406; CPC Prov. 9409).
These include cleaning services for exhaust gases, noise abatement services, nature and landscape protection services and other ESs not elsewhere classified.
In addition to these traditional ESs, other services may have an environmental end-use. However, the subsectors in this W/120 list are exclusive so services subsectors such as engineering services and construction services cannot appear twice, as environmental service sectors and as ‘standard’ service sectors.
In addition, as pointed out by Francois and Hoekman (Reference Francois and Hoekman2010), barriers to entry (policy and natural), network externalities (telecommunications, finance) and heavy regulation (communications, finance) all conjure to giving these services sectors market power, especially since they are ‘margin sectors’, i.e., they facilitate transactions between agents. Indicators of policy stance for ESs would then need to capture not only regulation and competition for their own sector (i.e., ‘change-effecting’ services) but also for downstream and upstream ‘margin sectors’, while recognizing that not all policies affecting foreign services transactions are discriminatory.
Capturing these characteristics in indicators of restrictiveness will be difficult. Up to now, measures of restrictiveness are still drawn from the W/120 list and CPC codes. Since there are complementarities in the provision of services across subsectors, any measure of barriers to trade in services based on the W/120 list and CPC classification is an inadequate approximation of the state of restrictions in the ES sector.
Dating from the GATS commitments negotiated during the Uruguay Round nearly 20 years ago, this classification is outdated. This narrow GATS classification defines ESs as end-of-pipe public infrastructure services, largely focused on waste management and pollution control. It fails also to reflect the current market and policy characteristics of the ES sector as the proximity burden has fallen, opening the road to linkages across modes and across services subsectors. Neither does it take account of the growing public sensitivity towards the environment, which would call for more services sectors being classified as ESs, as well as the shift from pollution control towards pollution prevention through the adoption of cleaner technologies for production and products (OECD, 2005). Furthermore, as sectors in the W/120 list and CPC classification systems are mutually exclusive, they cannot take into account ESs that fall within the scope of other sectors, such as business, construction and engineering, and education and tourism. Finally, as illustrated in case studies where the services needed to implement greenhouse gas-reducing projects were identified, this classification fails to take into account the fact that many operators, especially in developing countries, integrate the supply of ESs with imports of EGs (see, for example, Steenblik and Geloso Grosso, Reference Steenblik and Geloso Grosso2011, and the cluster of services described in their figure 1, as well as National Board of Trade, 2014, for a wind farm example) and that the customer would not demand the good without the services. However, as noted by Kirkpatrick (Reference Kirkpatrick2006), the liberalization of the ES is negotiated under the GATS while liberalization of goods is negotiated under non-agricultural market access (NAMA).
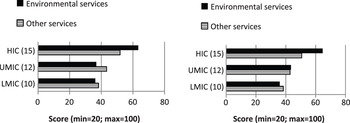
GATS score commitments for environmental services and other services Notes: There are no available data for LIC in the service commitments database. The narrow definition only considers ES as defined by the W/120 list; the wide definition adds to these ES the following W/120 sectors: professional services, research and development services, other business services, and construction and related engineering services. The qualitative ESL index inspired from Miroudot et al., (Reference Miroudot, Sauvage and Sudreau2010) uses penalty scores covering all 4 services modes. It aggregates two indexes, one for commitments to national treatment, another for commitment to market access (see Melo and Vijil, Reference Melo and Vijil2014, annexes 1 and 2, for the derivation and choice of weights).

3. Barriers to trade in environmental goods: trends and expected effects from the Davos initiative
3.1. Trends in tariffs and non-tariff barriers by income group
We start with a comparison of patterns of protection for EGs and non-EGs for all countries, as a hope of the Davos communiqué is that participation will be enlarged – a requisite for reaching a PA at the WTO. The bottom of table 1 reports current (averages over 2010 and 2011) applied (MFN) tariffs for EGs (APEC list of 54 products) vs. all other (non-EGs) products for 120 countries at the HS-6 digit level. (Corresponding estimates for the ‘core’ list of 26 products are reported in Melo and Vijil, Reference Melo and Vijil2014: table 1.) The data show several patterns.
First, for all income groups, EGs are less protected on average than other goods, with average tariffs for EGs for each income group about half that for non-EGs. This regularity could reflect a combination of two patterns. Insofar as EGs are mostly intermediate goods producing sectors, they meet the opposition to protection by downstream sectors, a pattern observed worldwide of intermediate goods producing sectors from final goods users (Cadot et al., Reference Cadot, de Melo and Olarreaga2004; WTO, 2011: figure D-2). But it could also be that countries would only put on their lists products with relatively low tariffs. Balineau and Melo (Reference Balineau and de Melo2013: table 2) show that submitters of EG lists included products in which they had a revealed comparative advantage, but also that they had a very low percentage of products with tariff peaks, an indication of mercantilistic behaviour.Footnote 14
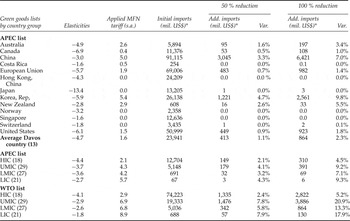
Simulated import responses to a reduction in trade barriers (tariffs only)

Notes: *Million US$. For income groups, means calculated over countries within each group. (s.a.) is simple average applied MFN tariffs. Initial imports (in million US$) are mean values for 2010–2011. To reduce the weight of extreme elasticity estimates when calculating import responses, for each income group, estimates outside the 1st and 9th deciles were fixed at the respective decile cut-offs. Estimates are from equation (1) in Melo and Vijil (Reference Melo and Vijil2014).
Source: Authors’ calculations. Kee et al. (Reference Kee, Nicita and Olarreaga2008), BACI, TRAINS and WDI data extracted in 2013.
Secondly, protection of EGs remains highest in the low-income country (LIC) group, with average tariffs of 5.2 per cent at the end of period (see table 1, column 1). This level is barely high enough for a bilateral barter among developing countries by a request-and-offer approach to be rewarding as it had been in the early days of the GATT. Thus, it is no surprise that this approach was discarded by negotiators. As for high-income countries (HIC), average tariffs were 2.2 per cent, so their expected gains from participation in the negotiations would be from reduction in tariffs by developing countries (which explains why developing countries were generally opposed to a list approach, which would have resulted in larger tariff reductions for them under a proportional reduction formula). Taking into account that many countries are members of PTAs that are mostly free trade areas, actual applied tariffs are even lower than the MFN-based estimates reported here.
Thirdly, Melo and Vijil (Reference Melo and Vijil2014) report the difference between consolidated tariffs and applied MFN tariffs or ‘binding overhang’, a margin of flexibility (‘policy space’) for governments. This flexibility is greatest for middle-income countries, and practically non-existent for HIC. So if there were a standstill compromise whereby tariffs would be bound at applied rather than bound rates, the UMIC and LMIC groups would lose the most leeway as the current gap of 16 and 14 percentage points would have to be closed (using the WTO list). For the LIC group, the gap is 3 percentage points, so average applied tariffs would have to be reduced from their current level of 15 per cent to 12 per cent (HIC would only have to reduce their average tariffs by 2 percentage points to 2 per cent).
Fourthly, an examination of the profile of tariffs for EGs vs. non-EGs over the Doha negotiation period (Balineau and Melo, Reference Balineau and de Melo2013: figure 1) shows no acceleration in the reduction of tariffs on EGs (or on non-EGs) and the trends were almost the same for EGs and for other products, suggesting no evidence that the environment was taken on board at the country level during the negotiations.Footnote 15
Finally, the right-hand side of table 1 gives average estimates of overall ‘protection’, taking into account NTBs. These are, at best, indicative. First, unlike tariffs, not all NTBs are welfare reducing as some are correcting for market failures. Secondly, estimates are for a smaller group of 70 countries at the HS-6 digit commodity level for 2010–2011. Thirdly, the ad valorem equivalents (AVEs) of NTBs are obtained from NTBs represented by binary variables for 2003–2004 with a small number of AVEs for some countries. Adding these AVEs to the tariff estimates for 2010–2011 gives the estimate of the combined measures of protection in columns 7–10.Footnote 16 Except for the HIC, the resulting overall ‘protection’ estimates for the APEC list reported in column 7 are high or very high. The estimates preserve the rank ordering for tariffs: highest for the LIC, followed by LMIC, UMIC and HIC.
3.2. Tariff and non-tariff barriers protection of the Davos group of countries
We now compare the protection indicators for the Davos group of 14 countries (there are only 13 here as trade data for Chinese Taipei are missing) with the averages by income group. Several patterns stand out. Among those who pledged to reduce tariffs, six countries have zero tariffs (see Melo and Vijil, Reference Melo and Vijil2014: table 3, for simple average tariffs). Unless NTBs are included in the negotiations – or the list is expanded in the case of Costa Rica – these countries will have nothing to ‘offer’ at the table of negotiations.
This lack of substance to negotiate on is reflected in average tariffs of 1.3 per cent for the Davos group. Only four countries have average tariffs above 1 per cent on the APEC list and among the OECD countries only Korea and New Zealand would have significant reductions to carry out if tariffs were to be eliminated. Using the TRI measure of protection which gives the average uniform tariff that would give the same welfare loss as the current structure with dispersion, at most (for the WTO list), the tariff protection for the group is equivalent to a uniform tariff of 3.4 per cent, hardly a high estimate.
What about expanding the list along the lines suggested in the Davos communiqué (‘APEC [list] has given us a good start, and we are committed to exploring a broad range of additional products’)? As can be seen from column 3, average reductions would be greater in the expanded list because countries have omitted from their submission lists products with tariff peaks. Yet, average protection is only 2.2 per cent, equivalent to a uniform tariff of 3.4 per cent. On the other hand, expanding the list of countries while keeping the APEC list would probably encounter greater resistance since, with the exception of China which has a higher protection than the average for the UMIC group, the Davos countries are the countries with low average protection in EGs in their respective income group.
Secondly, China and Korea stand out with average tariffs at least twice as high as for others. Comparing EG tariffs for the Davos participants with the averages for their income category, China, Korea and New Zealand have above-average tariffs. Korea would probably be interested in pushing for an extension towards the WTO list, as average tariffs on that list are lower than on the APEC list. The disparity between China and Korea and the rest of the Davos members hints at a possible scenario in which these two countries might insist on a less than full elimination of tariffs, say a 50 per cent cut across the board.
Thirdly, even though the country-level tariff-equivalent estimates of NTBs are dated, incomplete (see notes in table 1), and difficult to interpret in terms of welfare, the values are generally high, although they are close to the averages for their respective groups as discussed earlier. In conclusion, since there are very few tariff peaks in the Davos group (see table A.1 in the online appendix), as it now stands, the Davos initiative will do little to help moving towards global free trade.
3.3. Import response estimates to a lowering of trade barriers
Even though the Davos group accounts for 74 per cent of trade (intra-EU trade excluded) in EGs using the APEC list, increased country participation is essential to reach free trade in green goods. So far, all but HIC countries have been adamant about submitting lists of goods for tariff-reduction negotiations. This is because of a fear of being inundated by imports from industrialized countries. Taking the same format as table 1, table 2 gives first-order estimates of import response to a 50 per cent and total reduction in tariffs for individual Davos countries and averages across country groupings. The import response for each product depends on the height of the tariff at the HS-6 digit level and on the corresponding price elasticity for that product. Price elasticity estimates are from Kee et al. (Reference Kee, Nicita and Olarreaga2008). The price elasticity estimates are applied to average import data for 2010–2011 at the HS 6-digit level and the reduction in protection is carried out only for tariffs on the APEC list (and also on the WTO list for the classifications by income group). Estimates for each Davos country are obtained by adding up estimates at the product level. For those at the region level, to save space, only group averages are reported.Footnote 17
Because the import response is the result of applying the price elasticity estimate to the tariff rate, one could obtain low import response for a country (group of countries) with high tariffs if the corresponding price elasticity is low. Despite substantial differences in price elasticities across country groupings, with higher average price elasticity estimates for HIC (as one would expect, since substitutes for imports are higher for the low-protection HIC group), the estimates show a monotonic relation between average protection and import response. Taking the WTO list where disparities in protection are greatest across groups, the LIC group with the highest average protection (8.9 per cent) shows the highest average import response (7.9 per cent) to a cut in half of tariffs. This estimate is, however, barely greater than the one for the UMIC group, whose average protection rate is 30 per cent lower than that of the LIC group.
The estimated magnitudes are small. An average increase in imports ranges between 2 and 4 per cent for a 50 per cent reduction on the APEC list and between 2 and 8 per cent for the WTO list – estimates that are far from hinting at a possible import surge. For the Davos group, only China, Korea and New Zealand could expect import increases in the 7–10 per cent range in an ambitious scenario where tariffs are completely eliminated.Footnote 18 However, these estimates do not account for any supply response that would entail a reduction in output and employment requiring adjustment assistance. Still, the estimates are obtained by applying the MFN tariffs on all imports while imports under free trade agreements should have been omitted from the estimates.
4. Barriers to market access and national treatment in environmental services: how important are they?
Environmental projects have a great degree of ‘jointness’ or complementarity between the services provided by EGs and those provided by ESs. This is particularly the case in developing countries, for which case studies show that the ESs included in environmental projects incorporate an increasingly large array of services that extend beyond those that are classified as ESs (OECD, 2005; WTO, 2010). Hence, as in figure 1(b), it is necessary to go beyond the standard W/120 list with corresponding UN CPC codes of ESs to get an approximation of the ESs that are most intensively used in environmental projects, whether because they accompany the delivery of a core ES or an EG. The challenge is to measure the restrictiveness of trade in ESs in a comprehensive manner.
As far as we know, no comprehensive identification of barriers to trade in ESs exists yet. However, they should not be fundamentally different from those for other services, except that modes 3 and 4 are particularly important for the delivery of ESs. Recent estimates of trade costs in services suggest that they are higher than for trade in goods. Solving a gravity model from trade to obtain trade costs as suggested by Miroudot et al., (Reference Miroudot, Sauvage and Shepherd2013); Novy (Reference Novy2013) reports estimates of trade costs for mode 1 (cross-border services trade) and mode 2 (movement of consumers) services for 55 countries over the period 1999–2009. They conclude from their estimates that trade costs in services could be two to three times higher than those for trade in goods (estimated using the same method). These should be low estimates of the trade costs faced by ESs, as most of their barriers come from modes 3 and 4. As many countries did not participate in the GATS, the authors also investigate whether RTAs have resulted in a reduction in trade costs. Using a services liberalization index measuring the commitments to national treatment and market access, they estimate only a small reduction in trade costs for services via RTAs, confirming the often-made remark that commitments at the GATS – for those countries that made commitments (since countries were not obliged to table any offer) – just consolidated members’ existing domestic regulation regarding services.Footnote 19
In Melo and Vijil (Reference Melo and Vijil2014) we construct a similar environmental services liberalization (ESL) index to check if there is any difference in commitments for ESs vs. other services (the assumptions and resulting formulas to derive the ESL index are described in Melo and Vijil (Reference Melo and Vijil2014): annex A.2). Figure 1 uses this index to confirm greater commitments for HIC and slightly higher commitments for ESs than for the rest. However, the informational value of the index is limited because actions to improve the environmental use of services go beyond those categorized as ES in the W/120 list and CPC codes, which are the only services considered as belonging to the ES category.Footnote 20
It is likely that negotiations on ESs will also be off the Davos agenda, as negotiators will hold off taking them on board, pending the outcome of the TiSA negotiations. Some specialists have recommended liberalizing in EGA only those services that are indispensable for trade in EGs to take place following a ‘cluster’ approach to circumvent classification issues (National Board of Trade, 2014).Footnote 21 Should these agreements result in participants exchanging the best commitments they have so far undertaken in their PTAs (Marchetti and Roy, Reference Marchetti and Roy2013), ESs could be substantially liberalized, as most of the opening has occurred on a North–South preferential basis. Because complementarities between trade in EGs and trade in ESs are especially strong in LIC, they are likely to lose the most if the agenda is not extended to tackle NTBs and ESs. Should ESs be on the agenda, negotiators are likely to stumble when it comes to agreeing a more appropriate list based on the UN CPC, as these codes are often not sufficiently explicit to identify services with an environmental end-use.
Even with a more appropriate list of ESs, because it is far harder to monitor the fulfilment of commitments to liberalization, disincentives to negotiate on services will be strong, especially when negotiating partners lack trust in each other. Reflecting on the lack of success with liberalization of services, Messerlin (Reference Messerlin, Evenett and Jara2013) argues that ‘mutual equivalence’ rather than mutual recognition or harmonization is the better way to go, and that this route – which was followed by the EU Services Directive – might be best implemented on a regional basis where the trust necessary to agree on the regulations to be covered by mutual agreement is more likely.
5. Conclusions
The relaunch of negotiations on EGs liberalization in July 2014 with the hope of reaching an environmental goods agreement has given new hope that the WTO is not dead. PAs extended to all WTO partners on an MFN basis have been pointed out as a multilateral-friendly solution to continue liberalization while Doha negotiations linger on. It is expected that talks will first focus on goods, starting with the APEC list of 54 green goods that will be further extended, but the WTO members behind the initiative hope to create a ‘living agreement’ that will grow and evolve towards tackling other barriers to trade in green goods and services. Indeed, today NTBs are relatively more important than tariffs and there is a high complementarity between green goods and services at the project level. Some observers even hope that an environmental goods agreement might be the stepping stone towards a multilateral treaty on the environment.Footnote 22
Looking at tariff and non-tariff barriers to trade in EGs and ESs through the lens of all countries and with a special focus on Davos partners, we find that the Davos initiative, as it stands, will only help a little in the move towards global free trade. However, this perspective could change if at least one (and preferably all) of the following options are considered: (i) a complete elimination of all tariffs for all countries as they are already low; (ii) an extension of the list of EGs in line with the WTO list of 411 products, even though few tariff peaks remain on these goods; (iii) the participation of an increased number of countries, particularly middle-income countries, since a substantial reduction in tariffs would not be followed by an inundation of imports; (iv) tackling NTBs, recognizing that an agreement on their identification will be difficult; and finally and importantly, (v) the liberalization of ESs with a degree of commitment close to the best regional agreement.
Supplementary materials and methods
To view supplementary material for this article please wait http://dx.doi.org/S1355770X15000285