


%20--%3e%3c!DOCTYPE%20svg%20PUBLIC%20'-//W3C//DTD%20SVG%201.0//EN'%20'http://www.w3.org/TR/2001/REC-SVG-20010904/DTD/svg10.dtd'%3e%3csvg%20version='1.0'%20id='Layer_1'%20xmlns='http://www.w3.org/2000/svg'%20xmlns:xlink='http://www.w3.org/1999/xlink'%20x='0px'%20y='0px'%20width='64px'%20height='64px'%20viewBox='5.5%20-3.5%2064%2064'%20enable-background='new%205.5%20-3.5%2064%2064'%20xml:space='preserve'%3e%3cg%3e%3ccircle%20fill='%23FFFFFF'%20fill-opacity='0'%20cx='37.785'%20cy='28.501'%20r='28.836'/%3e%3cpath%20fill='%23595959'%20d='M37.441-3.5c8.951,0,16.572,3.125,22.857,9.372c3.008,3.009,5.295,6.448,6.857,10.314%20c1.561,3.867,2.344,7.971,2.344,12.314c0,4.381-0.773,8.486-2.314,12.313c-1.543,3.828-3.82,7.21-6.828,10.143%20c-3.123,3.085-6.666,5.448-10.629,7.086c-3.961,1.638-8.057,2.457-12.285,2.457s-8.276-0.808-12.143-2.429%20c-3.866-1.618-7.333-3.961-10.4-7.027c-3.067-3.066-5.4-6.524-7-10.372S5.5,32.767,5.5,28.5c0-4.229,0.809-8.295,2.428-12.2%20c1.619-3.905,3.972-7.4,7.057-10.486C21.08-0.394,28.565-3.5,37.441-3.5z%20M37.557,2.272c-7.314,0-13.467,2.553-18.458,7.657%20c-2.515,2.553-4.448,5.419-5.8,8.6c-1.354,3.181-2.029,6.505-2.029,9.972c0,3.429,0.675,6.734,2.029,9.913%20c1.353,3.183,3.285,6.021,5.8,8.516c2.514,2.496,5.351,4.399,8.515,5.715c3.161,1.314,6.476,1.971,9.943,1.971%20c3.428,0,6.75-0.665,9.973-1.999c3.219-1.335,6.121-3.257,8.713-5.771c4.99-4.876,7.484-10.99,7.484-18.344%20c0-3.543-0.648-6.895-1.943-10.057c-1.293-3.162-3.18-5.98-5.654-8.458C50.984,4.844,44.795,2.272,37.557,2.272z%20M37.156,23.187%20l-4.287,2.229c-0.458-0.951-1.019-1.619-1.685-2c-0.667-0.38-1.286-0.571-1.858-0.571c-2.856,0-4.286,1.885-4.286,5.657%20c0,1.714,0.362,3.084,1.085,4.113c0.724,1.029,1.791,1.544,3.201,1.544c1.867,0,3.181-0.915,3.944-2.743l3.942,2%20c-0.838,1.563-2,2.791-3.486,3.686c-1.484,0.896-3.123,1.343-4.914,1.343c-2.857,0-5.163-0.875-6.915-2.629%20c-1.752-1.752-2.628-4.19-2.628-7.313c0-3.048,0.886-5.466,2.657-7.257c1.771-1.79,4.009-2.686,6.715-2.686%20C32.604,18.558,35.441,20.101,37.156,23.187z%20M55.613,23.187l-4.229,2.229c-0.457-0.951-1.02-1.619-1.686-2%20c-0.668-0.38-1.307-0.571-1.914-0.571c-2.857,0-4.287,1.885-4.287,5.657c0,1.714,0.363,3.084,1.086,4.113%20c0.723,1.029,1.789,1.544,3.201,1.544c1.865,0,3.18-0.915,3.941-2.743l4,2c-0.875,1.563-2.057,2.791-3.541,3.686%20c-1.486,0.896-3.105,1.343-4.857,1.343c-2.896,0-5.209-0.875-6.941-2.629c-1.736-1.752-2.602-4.19-2.602-7.313%20c0-3.048,0.885-5.466,2.658-7.257c1.77-1.79,4.008-2.686,6.713-2.686C51.117,18.558,53.938,20.101,55.613,23.187z'/%3e%3c/g%3e%3c/svg%3e)
%20--%3e%3c!DOCTYPE%20svg%20PUBLIC%20'-//W3C//DTD%20SVG%201.0//EN'%20'http://www.w3.org/TR/2001/REC-SVG-20010904/DTD/svg10.dtd'%3e%3csvg%20version='1.0'%20id='Layer_1'%20xmlns='http://www.w3.org/2000/svg'%20xmlns:xlink='http://www.w3.org/1999/xlink'%20x='0px'%20y='0px'%20width='64px'%20height='64px'%20viewBox='5.5%20-3.5%2064%2064'%20enable-background='new%205.5%20-3.5%2064%2064'%20xml:space='preserve'%3e%3cg%3e%3ccircle%20fill='%23FFFFFF'%20fill-opacity='0'%20cx='37.637'%20cy='28.806'%20r='28.276'/%3e%3cg%3e%3cpath%20fill='%23595959'%20d='M37.443-3.5c8.988,0,16.57,3.085,22.742,9.257C66.393,11.967,69.5,19.548,69.5,28.5c0,8.991-3.049,16.476-9.145,22.456%20C53.879,57.319,46.242,60.5,37.443,60.5c-8.649,0-16.153-3.144-22.514-9.43C8.644,44.784,5.5,37.262,5.5,28.5%20c0-8.761,3.144-16.342,9.429-22.742C21.101-0.415,28.604-3.5,37.443-3.5z%20M37.557,2.272c-7.276,0-13.428,2.553-18.457,7.657%20c-5.22,5.334-7.829,11.525-7.829,18.572c0,7.086,2.59,13.22,7.77,18.398c5.181,5.182,11.352,7.771,18.514,7.771%20c7.123,0,13.334-2.607,18.629-7.828c5.029-4.838,7.543-10.952,7.543-18.343c0-7.276-2.553-13.465-7.656-18.571%20C50.967,4.824,44.795,2.272,37.557,2.272z%20M46.129,20.557v13.085h-3.656v15.542h-9.944V33.643h-3.656V20.557%20c0-0.572,0.2-1.057,0.599-1.457c0.401-0.399,0.887-0.6,1.457-0.6h13.144c0.533,0,1.01,0.2,1.428,0.6%20C45.918,19.5,46.129,19.986,46.129,20.557z%20M33.042,12.329c0-3.008,1.485-4.514,4.458-4.514s4.457,1.504,4.457,4.514%20c0,2.971-1.486,4.457-4.457,4.457S33.042,15.3,33.042,12.329z'/%3e%3c/g%3e%3c/g%3e%3c/svg%3e)
Introduction
Practical and reliable indicators of affective states in animals are important for animal welfare assessment. Cognitive paradigms have emerged as promising measures for this purpose (Paul et al. Reference Paul, Harding and Mendl2005). One such measure is attention bias, defined as the differential allocation of attention towards one stimulus compared to others (Crump et al. Reference Crump, Arnott and Bethell2018). The cognitive system is unable to process all sensory input simultaneously, and attentional processes are necessary for the selection of salient stimuli for subsequent processing (Hutton Reference Hutton2008). Being able to allocate attentional resources effectively in situations that either enhance or threaten survival provides an adaptive advantage, and this attentional resource allocation depends on the emotional state. For example, anxious people are quicker to detect threats and pay more attention to them than non-anxious people (Bar-Haim et al. Reference Bar-Haim, Lamy, Pergamin, Bakermans-Kranenburg and Van Ijzendoorn2007), have more difficulty disengaging from the threat or may direct their attention away from threat in an attempt to regulate the affective state (Cisler & Koster Reference Cisler and Koster2010). Therefore, attention bias in the human literature is considered to consist of several different components, including facilitated engagement (initial vigilance), sustained attention, difficulty in disengagement (difficulty in shifting their focus away), and attentional avoidance (especially in long-term negative states) (Cisler & Koster Reference Cisler and Koster2010; Liu & Bell Reference Liu and Bell2020).
Like humans, animals allocate their attention automatically and rapidly towards threat signals, because these pose an immediate threat to survival (Dolan & Vuilleumier Reference Dolan and Vuilleumier2003). However, the initial vigilance is often measured by eye tracking or computer responses in humans, which is difficult to replicate in freely moving animals. In animal studies, the measures of attention bias are therefore slightly adapted and the main indicators of (cognitive) attention bias to threat are attention towards the threat (i.e. head turned in the direction of the threat), vigilance behaviour (i.e. head at or above shoulder height), and latency to disengage from the threat signal, often measured as the animal choosing to engage in a different behaviour, such as eating a food treat after the threat exposure (Notari et al. Reference Notari, Burman and Mills2015; Lee et al. Reference Lee, Verbeek, Doyle and Bateson2016; Raoult & Gygax Reference Raoult and Gygax2019; Verbeek et al. Reference Verbeek, Colditz, Blache and Lee2019, Reference Verbeek, Dicksved and Keeling2021). Vigilance behaviour has been seen to increase in response to an alarm call in anxious starlings (Sturnus vulgaris) (Brilot et al. Reference Brilot, Asher and Bateson2010). Furthermore, vigilance behaviour and attention to a threat increased in anxious sheep (Ovis aries) (Lee et al. Reference Lee, Verbeek, Doyle and Bateson2016), barren-housed pigs (Sus scrofa) (Luo et al. Reference Luo, Reimert, de Haas, Kemp and Bolhuis2019) as well as in socially stressed tufted capuchin monkeys (Sapajus apella) (Boggiani et al. Reference Boggiani, Addessi and Schino2018) compared to non-anxious and non-stressed animals. A longer latency to start consuming food after threat exposure might be consistent with a greater difficulty disengaging from a threatening stimulus, as has been shown in sheep and cattle (Bos taurus) with pharmacologically induced anxiety (Lee et al. Reference Lee, Verbeek, Doyle and Bateson2016, Reference Lee, Café, Robinson, Doyle, Lea, Small and Colditz2018; Monk et al. Reference Monk, Doyle, Colditz, Belson, Cronin and Lee2018). However, not all attention bias studies have found effects in the expected directions and some have found no effect (Kappel et al. Reference Kappel, Collins, Mendl and Fureix2025).
The advantage of the attention bias approach is that it requires little or no animal training and therefore does not have the same practical limitations as alternative cognitive approaches (e.g. cognitive judgement bias, cognitive memory bias or attentional scope) (Verbeek et al. Reference Verbeek, Ferguson and Lee2014; Burman & Mendl Reference Burman and Mendl2018; Crump et al. Reference Crump, Arnott and Bethell2018; Hamlaoui et al. Reference Hamlaoui, Keeling, Burman and Verbeek2022). To our knowledge, only a few studies have investigated attention bias in dogs. In one study, dogs that had received corticosteroid treatment showed less exploration and ate less food after hearing a threatening dog growl (Notari et al. Reference Notari, Burman and Mills2015), although attention to the threat (one of the main measures of attention bias) was not assessed in this study. Another study assessed behavioural responses to a wind fan (as a threatening stimulus) after positive and negative social interactions with the owner, and dogs reacted to the threat with increased anxious behaviours (e.g. pacing and staying closer to the door) after the negative interaction, but attention to threat was not recorded (Molinaro et al. Reference Molinaro, Smith, Crawford-Paz Soldán and Wynne2025). Furthermore, social enrichment in shelter dogs did not alter the duration of attention to a threatening stimulus, although the enriched dogs spent more time eating than non-enriched dogs (Baqueiro-Espinosa et al. Reference Baqueiro-Espinosa, Lo, Hunter, Donnelly, McEvoy, Crump and Arnott2023). Therefore, further validation of the attention bias test as a potential indicator of affective states is required. Attention bias could be a practical method when working with larger numbers of animals or when working in animal shelters where resources are limited.
It is possible that attention bias is not only influenced by the affective state, but also by personality traits. Personality is associated with individual differences in affective and cognitive processes in humans and other species (Dougherty & Guillette Reference Dougherty and Guillette2018; Améndola et al. Reference Améndola, Weary and Zobel2022; Dong et al. Reference Dong, Xiao, Xu, Liang, Gu, Wang and Huang2022). It describes relatively stable differences among individuals when responding to challenging or rewarding situations (Gosling & John Reference Gosling and John1999; Gosling et al. Reference Gosling, Kwan and John2003; John et al. Reference John, Robins and Pervin2010). For example, neurotic people are more likely to experience negative affect, while extraverted people are more likely to experience positive affect (Gross et al. Reference Gross, Sutton and Ketelaar1998). Dogs that scored higher on sociability, excitability and non-social fear had a more optimistic judgement bias (Barnard et al. Reference Barnard, Wells, Milligan, Arnott and Hepper2018). More sociable dogs are also less likely to show aggression and fear towards their owners, unfamiliar people and situations (Gobbo & Zupan Reference Gobbo and Zupan2020; Svartberg Reference Svartberg2021). Dogs with high fearfulness and aggression were more pessimistic during a judgement bias task, but social enrichment reduced these pessimistic responses somewhat (Willen et al. Reference Willen, Schiml and Hennessy2019). Furthermore, fearful dogs were more likely to be reactive or aggressive compared to non-fearful dogs (Batista et al. Reference Batista, Lavrador and da Graça-Pereira2025). In dogs, personality has been associated previously with unwanted behaviour (Salonen et al. Reference Salonen, Mikkola, Hakanen, Sulkama, Puurunen and Lohi2022). Therefore, there may be an interplay between personality, cognition and the affective state in dogs, similar to that found in humans. Investigating this may help us better understand how personality traits influence cognitive responses in positive and negative situations in dogs.
Given the consequences of the animals’ affective states for their welfare, as well as the potential relationship between affective state and personality, the present study had two aims. Our first aim was to assess whether attention bias towards a potentially threatening sound is influenced by the affective state. If this is the case, attention bias might serve as a novel, practical and non-invasive indicator of affective state in dogs. To do this, we aimed to induce a negative affective state by a brief separation from the owner, which has previously been shown to change behaviours indicative of stress and negative affect (Mariti et al. Reference Mariti, Carlone, Sighieri, Campera and Gazzano2018; Harvey et al. Reference Harvey, Christley, Giragosian, Mead, Murray, Samet, Upjohn and Casey2022; Silbermann & Gansloßer Reference Silbermann and Gansloßer2023), and a positive affective state through a play session with the owner, which has previously been associated with indicators of positive affect (Conley et al. Reference Conley, Fisher and Hemsworth2014; Willen et al. Reference Willen, Schiml and Hennessy2019; Hamlaoui et al. Reference Hamlaoui, Keeling, Burman and Verbeek2022). We cannot be sure whether our dogs perceived the sound as threatening, or whether our two manipulations achieved the intended state, so these are putatively positive and negative affective states. We hypothesised that dogs would show increased attention towards a threatening sound following the negative manipulation compared to the positive manipulation.
Our second aim was to explore which aspects of a dog’s personality may correlate with their responses in the attention bias test. To test this, we assessed the personality of dogs via the Dog Personality Questionnaire (Jones Reference Jones2008) sent to their owners, combined with an exploratory behavioural test battery conducted in the lab to assess personality traits and then performed an exploratory analysis. We hypothesised that dogs that scored higher on traits related to sociability and lower on traits related to fear and aggression would show less reactive behaviours (i.e. low activity, vigilance, attention to threat, attention to the door, vocalisations and high exploration) in an attention bias test.
Materials and methods
The study was approved by Uppsala animal ethics committee (document number 5.8.18-01758/2020). Written informed consent was obtained from all dog owners prior to participating in the study.
Study subjects
Sixteen adult family dogs were recruited through fliers on campus and social media on a voluntary basis. Inclusion criteria entailed being physically and mentally healthy as indicated by their owners, not displaying any anxious or other undesirable behaviours, being able to participate in the task, not taking any medication, and being at least 12 months of age. The youngest dog was 2 years of age and the oldest was 11, the mean (± SD) age was 5.8 (± 2.8) years, 13 were female and 3 were male, there were 2 Australian Kelpies, 1 Cane Corso, 1 Cocker Spaniel, 1 Finnish Lapphund, 1 German Shepherd, 1 Golden Retriever, 3 Labrador Retrievers, 1 Nova Scotia Duck Tolling Retriever, 3 Shetland Sheepdogs, 1 Samoyed and 1 Yorkshire Terrier × Shih Tzu cross. All dog owners were female. Owners were requested not to feed their dog for the 2 h prior to any of the tests.
Experimental procedure
Owners were first asked to answer the Dog Personality Questionnaire (DPQ) about their dog. Then, animals underwent a test battery of personality tests in the lab. Finally, and on two additional days, dogs were tested twice in an attention bias test in random order. They were tested once after a 5-min play period with their owner and a ball (to induce a putatively positive state) and once after a 5-min separation period from the owner (to induce a putatively negative emotional state). Tests took place indoors at a facility of the Swedish University of Agricultural Sciences (Uppsala).
Dog Personality Questionnaire
The short form of the previously validated DPQ was used in this study prior to any behavioural testing (Jones Reference Jones2008). It aims to assess canine personality across 5 factors (Activity/Excitability, Responsiveness to training, Aggression towards people, Aggression towards animals, and Fearfulness). Respondents had to rate their dog on a 7-point scale, indicating how well they agreed with each of the 45 statements (from 1 [disagree strongly] to 7 [agree strongly]). The DPQ was distributed to the owners in the form of an online survey distributed via Netigate (Netigate AB, Sweden). The scores from Netigate were compiled into an Excel® file and the individual scores for each dog for the 5 factors were calculated according to the DPQ scoring system (Jones Reference Jones2008), which were later used as outcome variables in the analysis.
Dog Personality Behavioural Test Battery
The personality behaviour test consisted of eight behavioural subtests performed consecutively and in the same order (see Supplementary material 1). It was conducted by the same two female experimenters for all dogs. All subjects were tested individually and on the first visit to the lab (prior to the attention bias test). The owner stayed in the same room as the dog during the tests (except during the social separation tests) without interacting with their dog, but they could interact with their dog between each subtest. No food was given to the dogs outside the tests. The dog’s behaviour was directly coded by the observer during each sbtest. The different variables and scoring of the different subtests are shown in Table S1 (see Supplementary material 2). The full testing procedures are described in Supplementary material 1.
The first subtest was adapted from the greeting test as described by (Wan et al. Reference Wan, Hejjas, Ronai, Elek, Sasvari-Szekely, Champagne, Miklósi and Kubinyi2013) and was performed upon the first meeting between the dog and the experimenter (outside the facility), to assess behavioural reactions to a stranger (Table S1; Supplementary material 2). Subtests 2 to 6 were carried out in a 3.5 × 4.7 m (length × width) room of the facility, with water available ad libitum, as described in Supplementary material 1. We performed a social separation test to assess behavioural responses to brief separation; a novel food toy, novel object and novel sound test to assess responses to novelty and fearfulness; and a play test to assess play behaviour (Table S1; Supplementary material 2).
The motivation tests (subtests 7 and 8) were performed in a 15.8-m long corridor of the facility and consisted of measuring the running speed of the dogs to reach a bowl with treats (feeding motivation), or their owner (social motivation), as previously described (Hamlaoui et al. Reference Hamlaoui, Keeling, Burman and Verbeek2022). These tests were included to quantify potential individual differences in willingness to approach a food and social rewards under standardised conditions. This is important because differences in feeding motivation could potentially influence the latency to eat the reward in the attention bias test, while differences in social motivation could influence dogs’ responses to the separation and/or play with the owner.
Attention Bias Test
The attention bias test (ABT) took place between 4–8 days after the behavioural test battery, in a different but similar room to the behavioural test battery (3.5 × 4.7 m). The room was divided into 20 squares using tape on the floor (to facilitate further video analysis; Figure 1). A rug and water were available for the dog in one corner. In the middle of one sidewall, there was a purpose-built wooden box that hid the speakers (to play back the sound) and a camera (to observe the head orientation and other behaviours of the dog). The door of the room was always slightly open to make space for a tube for treat delivery, but access to the door was blocked by a cage that the dogs could not enter (see Figure 1). The food delivery tube was 3.05-m long, so that the treats (Dog training treats beef flavour, FourFriends, Doncaster, UK) could be delivered to the dog from outside the room. Black plastic bags were hung over the door to block visual access to the outside of the room during the tests and so the dog could not see the experimenter who was giving the treats. A second camera was used so that we could observe the dog when it was out of view of the first camera.
Diagram of arena use for testing attention bias in dogs. The location of the speakers and cameras, door, treat delivery tube, mat/drinking bowl and zones to assess activity are indicated.

Figure 1 Long description
Rectangular attention-bias test arena measuring 4.69 by 3.45 metres. Dotted lines divide the floor into 20 zones, arranged in five columns and four rows, for measuring activity. A dog mat and water bowl are located in the upper-right corner. The door is in the lower-right corner and is blocked by a cage. A tube passes through the door to deliver treats inside the arena. A wooden box containing a concealed speaker and camera is positioned along the lower wall, and a second camera is positioned along the left wall.
The ABT was conducted in the same room as where the treatments were applied, to not disturb the induced state by moving the dog. Before the start of the test and treatment, the dog was given two treats through the feeding tube. The ABT was divided into two 90-s periods: a ‘before’ and an ‘after’ the sound period. The sound was a 14-s playback of a lion roar, not exceeding 70 dB. This sound was chosen rather than a dog bark, since it was most likely to be unfamiliar to the dogs yet still may have potentially threatening characteristics. In a pilot study prior to the ABT, we confirmed that the lion sound indeed captured the dogs’ attention and was sufficiently long for dogs to notice and orient towards the sound, without inducing panic, and could therefore be considered a salient auditory cue.
There were two treatments applied prior to the ABT and these were applied at least 5 days apart. Each dog was randomly assigned a treatment order, and the number of dogs per treatment order was evenly distributed. Random numbers were generated using the standard = RAND() function in Microsoft Excel®.
Treatments
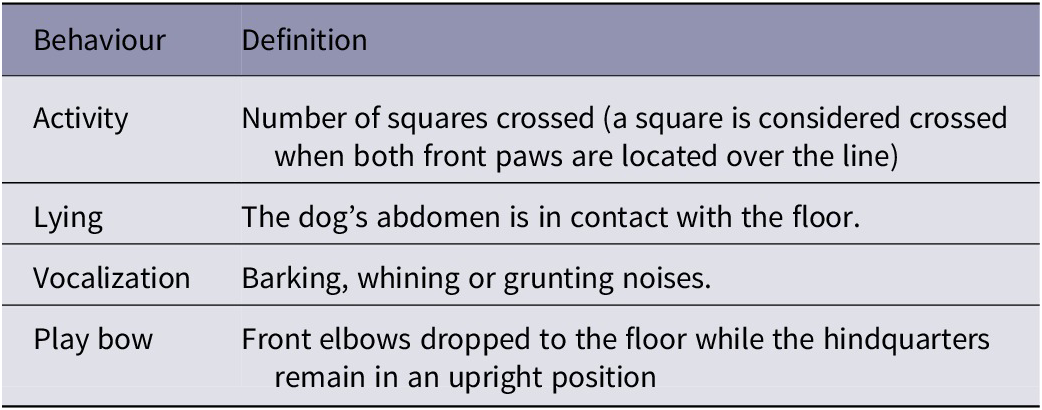
In order to induce putatively negative and positive states, dogs were exposed to different conditions in random order, i.e. half the dogs started with the social separation treatment and the other half with play treatment. In total, 16 dogs participated in the separation condition and 14 in the play condition. In the separation treatment, the dog was left alone in the room for 5 min before the start of the ABT. In the play treatment, the owner was in the room with their dog for 5 min before the beginning of the test. The owner was given a ball and instructed to invite the dog to a dog-led play session, meaning that dogs were never forced to play because forced play could be perceived as aversive. All dogs did engage in play. The behaviour of the dogs was video-recorded and analysed according to the ethogram in Table 1 to obtain behavioural indicators of the affective state. These behaviours were chosen because they are frequently observed during negative (social) conditions (Mariti et al. Reference Mariti, Carlone, Sighieri, Campera and Gazzano2018; Harvey et al. Reference Harvey, Christley, Giragosian, Mead, Murray, Samet, Upjohn and Casey2022; Silbermann & Gansloßer Reference Silbermann and Gansloßer2023) and positive (social play) conditions (Horowitz Reference Horowitz2009).
Ethogram used for behaviours of dogs scored during play (n = 14) and social separation periods (n = 16) prior to the Attention Bias Test

Table 1. Long description
The table has two columns, Behaviour and Definition, and describes four behaviours scored during play and social separation before the attention-bias test. Activity is the number of squares crossed; a square is crossed when both front paws pass over the line. Lying is recorded when the dog’s abdomen is in contact with the floor. Vocalization includes barking, whining or grunting. A play bow is recorded when the front elbows are lowered to the floor while the hindquarters remain upright. These behaviours were scored for 14 dogs during play and 16 dogs during social separation.
The ABT started directly after the treatment, and was based on a previously published ABT (Verbeek et al. Reference Verbeek, Dicksved and Keeling2021). The test started with a 90-s baseline period during which the dog was alone in the room, and this was called the ‘before’ sound period (i.e. after the 5 min of social separation or after the owner had left the room in the play treatment). To make sure that the two ABTs were performed under the same conditions and to control for the owner as a potential confounding variable, both the owner and experimenter waited outside the room, out of the dog’s sight, and remained silent. The baseline period allowed us to separate the effects of more general reactions to the emotional treatments and the reaction to the sound itself. Fifteen seconds before the threat (t = 75 s), three successive treats were delivered through the tube, to make sure that the dog was near the camera and speaker, at a relatively standardised distance from the sound. At 90 s, the sound was played through the speaker. The treats were always the same type and size. We defined the 90 s following the sound as the ‘after’ sound period. In addition, three treats were delivered through the tube during the 15 s following the end of the sound (starting at 104 s and ending at 119 s). As the dogs were moving freely, they could be at any location in the room during treat delivery.
The behaviours, locations, vocalisations and activity were later analysed by an observer blind to the treatments from video recordings using the mangold interact software for behavioural analysis (Mangold International GmbH, Arnstorf, Germany). Intraclass correlation coefficients ranged from 0.73–0.87. The ethogram (Table 2) was adapted from a previous study of ABT on pigs (Verbeek et al. Reference Verbeek, Dicksved and Keeling2021). Note that attention towards the sound and eating were mutually exclusive, because the food was on the floor, whereas the camera was at eye height at a different location, so dogs could not orient towards both at the same time.
Ethogram used for behaviours of dogs scored during the Attention Bias Test following play (n = 14) and social separation periods (n = 16)

Table 2. Long description
The table has two columns, Behaviour and Definition, and describes nine behaviours recorded during the attention-bias test following play and social separation. Activity is the number of squares crossed; a square is crossed when both front paws pass over the line. Attention to the sound is recorded when the dog’s head is oriented towards the camera located next to the speaker playing the lion growl. Attention to the door or exit is recorded when the head is oriented towards the door. Eating is the ingestion of food treats. Latency to eat is the time in seconds from the start of the sound until the dog eats the first treat and is measured only during the after-sound period. Exploring consists of sniffing or licking the floor or walls. Lying is recorded when the abdomen is in contact with the floor. Vigilance is recorded when the head is positioned at shoulder height or higher. Vocalization includes barking, whining or grunting. These behaviours were scored for 14 dogs following play and 16 dogs following social separation.
Statistical analysis
Mixed models
Data were analysed using R (version 4.6.1) and RStudio (version 2026.05.0) (R Core Team Reference Team2026). All behavioural variables in the ethograms were analysed. Linear mixed models were fitted with lme4 (Bates et al. Reference Bates, Mächler, Bolker and Walker2015) and generalised linear mixed models with glmmTMB (Brooks et al. Reference Brooks, Kristensen, Van Benthem, Magnusson, Berg, Nielsen, Skaug, Mächler and Bolker2017). Sum-to-zero contrasts were applied to the fixed effects so that the main effects can be interpreted as effects averaged over the other factor. The package DHARMa (Hartig Reference Hartig2016) was used to obtain simulation-based residual diagnostics and emmeans (Lenth Reference Lenth2023) was used for contrasts and estimated means.
Model diagnostics and model selection
For Gaussian linear mixed models, normality of the residuals was assessed using quantile–quantile (Q-Q) plots and homoscedasticity was assessed by plotting residuals against fitted values. For generalised mixed models, model adequacy was assessed using simulation-based scaled residuals generated with DHARMa, using 1,000 simulations. Residual plots were inspected visually, and tests of residual uniformity, dispersion, outliers and, where applicable, zero inflation were done. Model convergence and possible numerical problems, including non-positive-definite Hessian matrices, boundary estimates and unusually large coefficients, were additionally evaluated using glmmTMB::diagnose(). In case a model did not meet assumptions, Poisson, negative-binomial and COM-Poisson distributions were used for count outcomes, and the Tweedie distribution was used for continuous data that had exact zeros and right-skewed data. Final model selection was based on model convergence and residual adequacy, and Akaike Information Criterion (AIC) was used to compare candidate models.
Behaviour during the treatment period prior to the ABT
The behaviour during the 5-min treatment applied before the ABT was analysed separately from the ABT. Treatment (play vs social separation) was included as a fixed effect and dog identity as a random effect to account for repeated testing of dogs across treatments, see also Table 1. Play-bow frequencies contained many zeros and no play bows were observed during the separation treatment. We first converted play bows to a binary variable, but this resulted in complete separation so that we could not get reliable estimates with a binomial mixed model. Therefore, we used an exact paired binomial test, equivalent to an exact McNemar test based on the discordant pairs. Vocalisation frequency was analysed using a negative-binomial generalised linear mixed model with a log-link. Lying duration was analysed using a Tweedie generalised linear mixed model with a log-link because the outcome was non-negative, contained exact zeros and had a continuous right-skewed distribution.
The number of squares crossed was also analysed as a count outcome, with treatment as a fixed effect and dog identity as a random effect and with a COM-Poisson model (glmmTMB package) providing appropriate residual diagnostics. The dog-level variance in this model approached zero and the corresponding reduced mixed model could not be estimated stably. Therefore, the treatment effect was evaluated using a Wald χ2 test from the full COM-Poisson mixed model rather than a likelihood-ratio comparison.
Behaviour during the Attention Bias Test
The ABT variables were recorded both before and after presentation of a threatening sound, and treatment (play vs separation), period (before vs after sound presentation), and their interaction were included as fixed effects. Dog identity and test session nested within dog identity were included as random effects. Sum-to-zero contrasts were applied before model fitting, with play coded +1 and separation −1, and the before-sound period coded +1 and the after-sound period −1. This coding allowed the treatment and period main effects to represent effects averaged over the other factor, see Table 3 for an overview of the different models fitted.
Outcome variables and the statistical model used in the final analysis of the treatment period and Attention Bias Tests, including fitted fixed and random effects

Table 3. Long description
The table has five columns: Phase, Outcome, Final analysis, Fixed effects and Random effects. Four outcomes from the treatment period were analysed. Play-bow occurrence was analysed using an exact paired binomial test, equivalent to an exact McNemar test, with treatment as the fixed effect and pairing by dog. Vocalization frequency was analysed using a negative-binomial generalized linear mixed model with a log link. Lying duration was analysed using a Tweedie generalized linear mixed model with a log link. The number of squares crossed was analysed using a COM-Poisson generalized linear mixed model with a log link. For these last three outcomes, treatment was the fixed effect and dog was the random effect.
Nine outcomes from the attention-bias test were analysed using treatment, period and their interaction as fixed effects, with dog and session within dog as random effects. Attention to the threat, eating, vigilance and exploration durations were analysed using Tweedie generalized linear mixed models with log links. Attention to the door was analysed using a Gaussian linear mixed model. Vocalization frequency was analysed using a negative-binomial generalized linear mixed model with a log link. The number of zones crossed was analysed using a COM-Poisson generalized linear mixed model with a log link. Latency to start eating after the sound was analysed using a gamma generalized linear mixed model, with treatment as the fixed effect and dog as the random effect. Lying occurrence was summarized descriptively because sparse data and separation prevented reliable model estimation.
The duration of attention to the threatening stimulus, eating behaviour, vigilance, and exploration were non-negative continuous variables containing exact zeros and/or substantial right skew and were therefore analysed using Tweedie generalised linear mixed models with log-links. Attention to the door was approximately normally distributed and was analysed using an untransformed Gaussian linear mixed model. Vocalisation frequency was analysed using a negative-binomial generalised linear mixed model with a log-link, whereas the number of zones crossed was analysed using a COM-Poisson generalised linear mixed model with a log-link. These count distributions were selected after comparison of candidate count models and evaluation of residual diagnostics. Lying behaviour during the ABT was also converted to a binary occurrence variable. However, lying occurred in only 6 of 58 observations, resulting in quasi-complete separation in the binomial mixed model. Model coefficients and odds ratios could therefore not be estimated properly, and lying during the ABT was summarised descriptively instead.
Hypothesis testing and interpretation of interactions
The full treatment × period factorial structure was used for ABT outcomes irrespective of the significance of the interaction. For generalised models fitted with glmmTMB, the treatment × period interaction was evaluated with a one-degree-of-freedom likelihood-ratio test comparing the full factorial model with the corresponding additive model. Main effects were evaluated while retaining the interaction by constraining the relevant sum-coded coefficient to zero, with a one-degree-of-freedom likelihood-ratio test. For Gaussian linear mixed models, fixed effects were evaluated using parametric-bootstrap tests with the pbkrtest package (Halekoh & Højsgaard Reference Halekoh and Højsgaard2014) while retaining the full factorial model and sum-to-zero contrast coding. When a treatment × period interaction was significant, it was further evaluated by simple contrasts based on estimated marginal means and adjusted using the Holm procedure. Where the interaction was not significant, treatment and period main effects from the full sum-coded model were interpreted without simplifying the model.
Correlations
To explore links between ABT and animal personality, we initially explored a principal component analysis (PCA). However, our dataset was not suitable for PCA. Bartlett’s test indicated that the correlation matrix differed from an identity matrix; however, the Kaiser-Meyer-Olkin measure of sampling adequacy [KMO] and Measure of Sampling Adequacy [MSA] were extremely poor. As a consequence, the data could not be factored in a meaningful way, most likely due to the small sample size relative to many potential variables.
Therefore, we needed to find another suitable way to reduce the number of variables. Because variables from a single behavioural subtest should reflect the same response tendency in a specific context, we did this by grouping them (aggregating) according to each behavioural subtest using the COINr package. The COINr package is specifically designed for this purpose and is suitable for studies in which many diverse indicators are collected (Becker et al. Reference Becker, Caperna, Del Sorbo, Norlén, Papadimitriou and Saisana2022). Composite indicators are aggregated sets of indicators designed to assess complex and multifaceted data. COINr consolidates all the data and organises it into a structured framework known as a “coin”.
The composite indicators to be aggregated were decided by the researchers in advance and prior to any further analysis, and these were the attention bias test, the DPQ and behavioural test battery. The DPQ and behavioural test battery were treated as separate composites because they were obtained using different methods and in different contexts. The DPQ was based on owner-reported behaviour through questionnaires, whereas the behavioural test battery was based on directly observed behaviour in our testing facilities. As there is insufficient evidence that these measures reflect the same underlying traits in a directly comparable way, we did not want to use them as a single composite indicator. We recognise that behaviours within the same behavioural subtest may still reflect (partially) different processes and the results should therefore be interpreted as test-level composites and not as validated personality traits or as evidence of a unified structure.
To build this coin, we first defined the indicator structure, directions and weights using the COINr package (Becker et al. Reference Becker, Caperna, Del Sorbo, Norlén, Papadimitriou and Saisana2022) (see below). Outliers were treated (winsorisation) followed by data normalisation with the “min-max” normalisation method that scales indicators to 0–100 intervals, so that variables measured on different scales could be aggregated without any one variable dominating due to its raw metric. The third step was to build the coin by aggregating the different indicator variables according to COINr’s default weighted arithmetic mean (a_amean()), applied hierarchically according to the predefined indicator structure and weights so that each indicator could contribute equally after scaling. All indicator variables were given a weight of 1, because we did not want to assume that some indicators were more important than others in this exploratory analysis. This linear aggregation approach is standard for composite indicators, but it assumes compensability, which means that lower scores on one indicator can be offset by higher scores on another.
The coin consisted of 4 levels, with level 1 containing all individual behavioural indicators (i.e. all test variables) and the DPQ calculated scores left intact (e.g. activity, aggression towards people and animals, fearfulness and response to training; Figure 2). These are called iCodes within the Coin framework (see also Table S2; Supplementary material 2). Level 2 contained test-specific subdomains (i.e. grouping based on a specific behavioural test), with the ABT split up according to condition (separation and play) and period (before and after the sound) and the behavioural test battery split up according to each specific behavioural test (i.e. response to the umbrella, response to the sound, response to novel food, greeting a stranger, feeding motivation and social motivation). The DPQ was split according to undesirable (i.e. aggression and fear) and desirable (i.e. response to training and activity) traits. This was somewhat arbitrary, but this level was not used directly in the main analyses and served only as an intermediate step in constructing the DPQ domain and overall index. Level 3 contained the main domain-level composites (i.e. attention bias test, personality measures from the DPQ and personality measures from the behavioural test battery) and level 4 was the overall reactivity index. The indicator variables, subareas and areas can be seen in Figure 2.
Hierarchical organisation of the COIN dataset and construction of the overall index used in the statistical analysis. Individual indicator variables (fourth column) were grouped into subdomains (third column), which were grouped into main domains (second column) and combined into the overall index (first column). Connecting lines indicate how the indicators were assigned within this hierarchy.

Figure 2 Long description
The diagram is titled Composition of the C O I N index. It is organized into four vertical columns from left to right.1. Index: A single grey vertical bar labeled Index.2. Main domain: Three large colored blocks.- Attention Bias (red)- Personality D P Q (gold)- Personality Behaviour (blue)3. Subdomain: These blocks branch from the main domains.- From Attention Bias: Before - Separation (olive), After - Separation (green), Before - Play (dark green), and After - Play (teal).- From Personality D P Q: D P Q desirable (pink) and D P Q undesirable (magenta).- From Personality Behaviour: Greeting Test (cyan), Novel Food Test (light blue), Umbrella Test (purple), Sound Test (lavender), and Motivation test (dark cyan).4. Indicator: full name (iCode): Individual data points branching from subdomains.- Before - Separation leads to: Vigilance - before - Separation (vig1iso), Exploration - before - Separation (exp1iso), and Attention to door - before - Separation (door1iso).- After - Separation leads to: Vigilance - after - Separation (vig2iso), Exploration - after - Separation (exp2iso), Attention to sound - after - Separation (att2iso), and Attention to door - after - Separation (door2iso).- Before - Play leads to: Vigilance - before - Play (vig1play), Exploration - before - Play (exp1play), and Attention to door - before - Play (door1play).- After - Play leads to: Vigilance - after - Play (vig2play), Exploration - after - Play (exp2play), Attention to sound - after - Play (att2play), and Attention to door - after - Play (door2play).- D P Q desirable leads to: Activity (activity) and Response to Training (responseTraining).- D P Q undesirable leads to: Aggression towards Animals (aggresAnimals), Aggression towards People (AggressPeople), and Fearfulness (fear).- Greeting Test leads to: Approach Person (approachperson), Contact with Person (contact), Tail Wagging (tailwag), and Greeting behaviour (greet).- Novel Food Test leads to: Eating treats (treats) and Latency to consume treats (timetreats).- Umbrella Test leads to: Reaction towards Umbrella (reactionum), Back up from Umbrella (backum), Look at Umbrella (lookum), and Other behaviour towards the Umbrella (elseum).- Sound Test leads to: Activity after Sound (activitysound) and Approach the sound (approachsound).- Motivation test leads to: Feeding Motivation (FoodMotivation) and Social Motivation (SocialMotivation).
At the indicator level (level 1), the direction of each indicator of the attention bias test was set conceptually prior to aggregation so that higher values represent greater expression of the focal behaviour. Therefore, high values were defined to reflect greater reactivity in response to the sound (+1, i.e. attention to sound and door, vigilance behaviour) while low values were defined as reflecting low reactivity in response to the sound (-1, i.e. exploration). The directions of the variables from the personality behaviour tests were assigned so that higher scores aligned with the intended behavioural construct within each test (e.g. sociability, reactivity towards novelty or motivation). Variables with no variation or where the indicator was absent in the majority of the animals (i.e. scored a 0) were removed (these were the ball test and scanning behaviour). See Supplementary material 2 for details on indicator weights and directions.
The aggregated dataset built by the COIN procedure was used to calculate the Pearson correlation coefficient (Holm-adjusted for multiple comparisons) to determine correlations between the ABT measures, which were aggregated according to four domains consisting of condition (Play and Separation) and period (before and after – subdomains) and aggregated scores from the behavioural test battery (5 subdomains; Figure 2) and the DPQ scores (2 subdomains; Figure 2).
Results
Treatments
We compared the behaviour of the dogs during the two putatively negative and positive treatments created by 5 min of separation from the owner or 5 min of play with the owner, respectively. Dogs showed significantly more play bows (exact binomial test with 8 discordant pairs; P = 0.008; Figure 3[a]), were more active (χ2(₁) = 84.15; P < 0.001; Figure 3[b]) but vocalised less (χ2(₁) = 4.24; P = 0.040; Figure 3[c]) and tended to lie down less (χ2(₁) = 3.66; P = 0.056; Figure 3[d]) during the play period.
Behavioural responses of the dogs in response to the 5 min play (n = 14) and separation treatments (n = 16) prior to the Attention Bias Test. Boxplots present the median and interquartile ranges, with individual dogs shown as points and connected across treatments and the white diamonds showing the group means. Panels show (a) number of play bows, (b) number of zones crossed, (c) number of vocalisations, and (d) duration of lying behaviour. Statistically significant effects are indicated as P-values on the graph.

Figure 3 Long description
Four boxplots compare behavioural responses during five minutes of separation and play with the owner. Individual dogs are represented by points connected between treatments; boxes show medians and interquartile ranges, and white diamonds show group means. The upper-left panel shows that dogs performed more play bows during play than during separation, P = 0.008. The upper-right panel shows that dogs crossed more zones during play, P less than 0.001. The lower-left panel shows more vocalizations during separation, P = 0.040. The lower-right panel shows that lying duration tended to be longer during separation, P = 0.056.
Effects of treatment on attention bias
Attention towards the sound was significantly influenced by a treatment × period interaction (χ2(₁)=5.28; P = 0.022). Attention did not differ between treatments before the sound. However, after the sound, the dogs paid more attention to the sound in the separation condition compared to the play condition (P = 0.014; Figure 4[a]). Dogs were slower to start eating following the sound in the social separation compared to the play condition, but this effect was not statistically supported (χ2(₁) = 2.27; P = 0.131; Figure 4[b]). Even though vigilance was numerically higher during the separation compared to the play condition, this was also not statistically supported. However, vigilance was higher during the before-sound period compared to the after-sound period (χ2(₁) = 5.09; P = 0.024; Figure 4[c]). Attention to the door was lower during the after-sound period than the before-sound period (χ2(₁)=11.95; P = 0.003; Figure 4[d]) and exploring behaviour was higher during the after-sound period compared to the before-sound period (χ2(₁) = 19.33; P < 0.001; Figure 4[e]).
Behavioural responses of the dogs in response to the sound during the attention bias test following play (n = 14) and separation treatments (n = 16). Boxplots present the median and interquartile ranges, with individual dogs shown as points and connected across periods and the white diamonds showing the group means. Panels show (a) attention to the sound, (b) latency to start eating, (c) vigilance behaviour, (d) attention to the door, and (e) exploration behaviour. Statistically significant effects are indicated as P-values on the graph.

Figure 4 Long description
Five panels compare dogs tested after play and separation, before and after playback of a potentially threatening sound. Points show individual dogs, boxes show medians and interquartile ranges, and white diamonds show group means. Panel a shows a treatment-by-period interaction for attention to the sound, P = 0.022. The treatments did not differ before playback, but after playback dogs attended to the sound longer following separation than following play, P = 0.014. Panel b shows a longer latency to eat following separation, although this difference was not statistically supported. Panel c shows that vigilance decreased after the sound, P = 0.024. Panel d shows that attention to the door decreased after the sound, P = 0.003. Panel e shows that exploration increased after the sound, P less than 0.001.
Dogs ate more during the play condition compared to the separation condition, but this pattern could not be supported statistically (Figure 5[a]). Dogs appeared to lie down more in the before the sound period in the separation condition (Figure 5[b]). However, this behaviour occurred too infrequently for proper statistical analysis. Vocalisations were influenced by a treatment × period interaction (χ2(₁) = 4.61; P = 0.032; Figure 5[c]). Dogs vocalised more in the separation treatment in both the before- (P = 0.029) and after-sound (P < 0.001) periods compared to the play treatment. The activity was higher in the after-sound compared to the before-sound period, irrespective of treatment (χ2(₁) = 11.03; P < 0.001; Figure 5[d]).
Behavioural responses of the dogs in response to the sound during the attention bias test following play (n = 14) and separation treatment (n = 16). Boxplots present the median and interquartile ranges, with individual dogs shown as points and connected across periods and the white diamonds showing the group means. Panels show (a) eating behaviour, (b) lying behaviour, (c) number of vocalisations, and (d) number of zones crossed. Statistically significant effects are indicated as P-values on the graph.

Figure 5 Long description
Four panels compare behavioural responses before and after the sound under play and separation conditions. Points show individual dogs, boxes show medians and interquartile ranges, and white diamonds show group means. Panel a shows eating duration, which was generally longer following play, although the treatment difference was not statistically supported. Panel b shows lying duration. Lying occurred infrequently and was not analysed statistically. Panel c shows a treatment-by-period interaction for vocalizations, P = 0.032. Dogs vocalized more following separation than following play both before the sound, P = 0.029, and after the sound, P < 0.001. Panel d shows that the number of zones crossed increased after the sound, irrespective of treatment, P < 0.001.
Exploratory associations between personality variables and responses in the attention bias test
We explored how explanatory variables from the behavioural test battery and DPQ were associated with responses in the ABT. First, we looked at correlations between aggregated ABT measures (aggregated according to condition [Play and Separation] and period [before-sound and after-sound]) and the behavioural test battery (Figure 6). There was a negative correlation between the before period following the play treatment and the greeting test (R = –0.54; P = 0.04). However, after applying the Holm adjustment for multiple comparisons, this was no longer significant (P = 0.76).
Associations between attention bias aggregate scores and behavioural test battery variables in dogs (n = 15). Heatmap showing Pearson correlation coefficients (r) between attention bias aggregate scores before and after separation and play conditions, and behavioural test battery measures. Values within cells indicate Pearson’s r. * Indicates unadjusted P = 0.04.

Figure 6 Long description
Heatmap of Pearson correlations between attention-bias aggregate scores and five behavioural-test measures. Rows represent before-play, before-separation, after-play and after-separation attention-bias scores. Columns represent the greeting, motivation, novel-food, sound and umbrella tests. For before-play attention bias, the correlations are -0.54, -0.11, -0.00, -0.22 and -0.12, respectively. For before-separation attention bias, they are -0.12, -0.03, -0.02, -0.13 and -0.24. For after-play attention bias, they are minus 0.18, 0.25, 0.04, 0.09 and minus 0.03. For after-separation attention bias, they are 0.36, -0.10, -0.11, 0.04 and -0.01. The negative association between before-play attention bias and the greeting test had an unadjusted P value of 0.04 but was not statistically significant after adjustment for multiple comparisons.
Then we explored correlations between aggregated ABT measures and the DPQ (Figure 7). There was a positive correlation between the ABT after-sound period in the play condition and fearfulness from the DPQ (R = 0.53; P = 0.04). However, after adjusting for multiple comparisons, this was no longer significant.
Associations between attention bias aggregate scores and dog personality questionnaire variables in dogs (n = 15). Heatmap showing Pearson correlation coefficients (r) between attention bias aggregate scores before and after separation and play conditions, and DPQ measures. Values within cells indicate Pearson’s r. * Indicates P = 0.04, † indicates an unadjusted P-value between 0.05 and 0.1.

Figure 7 Long description
Heatmap of Pearson correlations between attention-bias aggregate scores and five Dog Personality Questionnaire measures: activity, aggression towards animals, aggression towards people, fearfulness and response to training. For before-separation attention bias, the correlations are 0.29, -0.46, -0.02, -0.07 -0.01, respectively. For after-separation attention bias, they are -0.04, -0.19, -0.11, 0.03 and 0.25. For before-play attention bias, they are 0.26, -0.01, 0.06, 0.18 and 0.10. For after-play attention bias, they are 0.23, 0.12, 0.47, 0.53 and 0.35. The association between after-play attention bias and fearfulness had an unadjusted P value of 0.04. The associations between before-separation attention bias and aggression towards animals, and between after-play attention bias and aggression towards people, had P values between 0.05 and 0.10. None remained statistically significant after adjustment for multiple comparisons.
Discussion
This study is one of the first to investigate attention bias in dogs and how individual personality traits may modulate behavioural responses to a salient sound cue. Following the manipulation, dogs presumed to be in a more negative affective state due to a period of separation from their owner paid more attention towards a sound, suggesting more sustained processing of the sound. Facilitated engagement to a potentially threatening stimulus is recognised as a major component of attention bias in the human literature (Cisler & Koster Reference Cisler and Koster2010), although our design cannot fully distinguish this from related processes, such as increased vigilance and behavioural inhibition. The hypothesis that personality traits influenced attention bias responses could not be supported by our data. Even though we found a number of correlations between greeting behaviour, fearfulness, and attention bias responses, these could not be statistically supported once we adjusted for multiple comparisons.
Dogs are a social species that form strong attachments to their owners (Prato-Previde et al. Reference Prato-Previde, Custance, Spiezio and Sabatini2003; Rehn & Keeling Reference Rehn and Keeling2016). Therefore, separation is perceived as stressful by many dogs, even for those without any separation-related behaviours (Rehn & Keeling Reference Rehn and Keeling2011). Dogs vocalised more during the 5-min separation period and were less active, which suggests that they indeed experienced the separation as stressful. Previous studies have also shown increased vocalisation and reduced lying after social separation in dogs (Mariti et al. Reference Mariti, Carlone, Sighieri, Campera and Gazzano2018; Harvey et al. Reference Harvey, Christley, Giragosian, Mead, Murray, Samet, Upjohn and Casey2022; Silbermann & Gansloßer Reference Silbermann and Gansloßer2023). During the 5 min period of play with the owner, dogs were found to be more active and the ‘play bow’ was frequently observed, which is a typical expression of play in dogs (Horowitz Reference Horowitz2009). Several studies have shown that dogs perceive interactions, such as petting and playing with humans, as positive (Conley et al. Reference Conley, Fisher and Hemsworth2014; Willen et al. Reference Willen, Schiml and Hennessy2019; Hamlaoui et al. Reference Hamlaoui, Keeling, Burman and Verbeek2022). Social enrichment also increased the amount of food eaten in an ABT in shelter dogs, although the duration looking at the sound was not affected by the enrichment (Baqueiro-Espinosa et al. Reference Baqueiro-Espinosa, Lo, Hunter, Donnelly, McEvoy, Crump and Arnott2023). Therefore, it seems that the behaviour of the dogs was consistent with the expected putatively positive and negative states, although more validation work would be needed to confirm this.
Our hypothesis was that dogs would express increased attention towards a sound following a negative compared to positive manipulation of the affective state. Indeed, dogs paid more attention to the sound after a period of separation from their owners compared to play. Our results regarding the increased attention to sound when experiencing a negative affective state are similar to previous findings. Sheep treated with an anxiogenic drug spent more time looking towards a predator sound and were more vigilant (Lee et al. Reference Lee, Verbeek, Doyle and Bateson2016). Starlings without access to a water-bath were more vigilant and less likely to feed after hearing a conspecific alarm call (Brilot & Bateson Reference Brilot and Bateson2012) and dogs treated with corticosteroids were more avoidant and ate less after an unexpected playback of a dog growl (Notari et al. Reference Notari, Burman and Mills2015). The dogs in the negative condition took longer to eat after the sound, although this was not supported statistically, most likely due to the high variation in the data and the small sample size. This pattern of a longer latency to eat following a threat is consistent with a slower disengagement from a potentially threatening stimulus, as has been previously shown in anxious sheep and cattle (Lee et al. Reference Lee, Verbeek, Doyle and Bateson2016, Reference Lee, Café, Robinson, Doyle, Lea, Small and Colditz2018; Monk et al. Reference Monk, Doyle, Colditz, Belson, Cronin and Lee2018) and is also recognised as a measure of attention bias in the human literature (Cisler & Koster Reference Cisler and Koster2010). Dogs also vocalised consistently more in the separation condition in both periods, suggesting that this was a general response to the separation rather than a direct response to the sound. Vigilance and exploration behaviours were not influenced by the treatment condition, suggesting that these were not indicative of an attention bias in the current study, in contrast to previous studies (Lee et al. Reference Lee, Verbeek, Doyle and Bateson2016; Verbeek et al. Reference Verbeek, Colditz, Blache and Lee2019). In previous work, a brief period of separation from the owner in dogs with mild symptoms of separation-related problems did not change the way they responded in a judgement bias task (Muller et al. Reference Muller, Riemer, Rosam, Schößwender, Range and Huber2012). It therefore appears that the attention bias test may be more sensitive to detecting changes in cognitive-emotional responses to owner separation than judgement bias. However, not all previous attention bias studies have found effects in the expected direction, with some studies finding contradictory or null effects (Kappel et al. Reference Kappel, Collins, Mendl and Fureix2025), and specific behavioural indicators of attention bias in animals will need further validation with larger sample sizes and across different contexts to confirm it is a robust measure of affective states.
In terms of the links between ABT and personality, we hypothesised that dogs with lower scores on traits related to sociability and higher scores on traits related to fear and aggression would show higher levels of reactivity in the ABT. We did not find strong support for this hypothesis, mostly because the correlations were no longer statistically significant after correcting for multiple comparisons, likely due to the small sample size. Our results showed that more fearful dogs were more reactive in response to the sound in the play condition, although this effect did not hold after correcting for multiple comparisons. Other studies have found that fearful individuals paid more attention to a predator sound (Kremer et al. Reference Kremer, Bus, Webb, Bokkers, Engel, van der Werf, Schnabel and van Reenen2021). Furthermore, more sociable dogs (i.e. dogs that scored high on the greeting test) showed somewhat reduced reactive behaviours in the before-sound period of the ABT, but only in the play condition (and this effect disappeared after correcting for multiple comparisons). This is in line with other studies in dogs showing that dogs that scored higher on sociability and excitability were more likely to display an optimistic judgement bias, while dogs that scored high on dog-directed fear and aggression or separation-related behaviours were more likely to express a pessimistic judgement bias (Barnard et al. Reference Barnard, Wells, Milligan, Arnott and Hepper2018). None of the dogs in our study were particularly fearful (median score was 3.17 out of 7 in the DPQ, with the highest score a 4.5), and it may be valuable to include individuals that score higher on fearfulness traits (e.g. dogs with separation anxiety or other types of fearfulness) in future studies.
Study limitations
One limitation of our study that will need to be taken into consideration is the relatively small sample size (n = 16 dogs) which reduces the power to detect more subtle differences. Second, although we successfully induced behavioural differences during the treatment periods in relation to social contact with the owner, all dogs were tested alone in the ABT. This standardisation was necessary to control for the owner’s presence and to make sure that both attention bias tests were performed under the same conditions. However, the owner leaving the room after playing with their dogs could have diminished the positive affective states resulting from the play session. Despite this, we still detected differences in the response to sound in the attention bias test between the play and separation treatments. Third, while the correlations between attention bias and personality found in this study provide some exploratory insights, they were not significant after correcting for multiple comparisons and should therefore be interpreted with caution. Even though our within-subject design has greater power than a between-subject design, it would be valuable to perform follow-up studies on a larger and more diverse group of dogs, while balancing for sex and breed. It may also be valuable to assess responses to different types of threatening (and possibly even positive) stimuli to confirm and extend the current findings, which would broaden its practical utility in welfare assessment.
Animal welfare implications
Our findings suggest that the ABT may be a practical tool to assess short-term affective states in dogs as part of a broader welfare assessment. In applied contexts, such as shelter environments or clinical behaviour practice, assessment of attention bias and personality traits could potentially help to identify dogs that are more vulnerable to experiencing negative emotional states. In addition, understanding the relationships between affective states, cognitive processes and personality may help to explain why some dogs are more prone to develop behavioural problems, such as separation-related behaviours and fear-based aggression, while other dogs show greater resilience despite similar challenges. By recognising these patterns early, preventive measures could be applied, and interventions could be tailored more specifically, which would ultimately support better welfare outcomes.
Conclusion
Attention bias may measure short-term affective states arising from interactions with the owner. Unlike previous studies in pigs and sheep, vigilance behaviour in dogs was not related directly to the response to sound, suggesting that species differences may play a role. More research is needed to investigate whether attention bias may be modulated by underlying individual personality traits.
Supplementary material
The supplementary material for this article can be found at http://doi.org/10.1017/awf.2026.10127.
Data availability statement
All data are available here: https://osf.io/2987f/?view_only=4ad4e9c9189b48c68e8b0d88f05542c2
Acknowledgements
This study was funded by The Swedish Research Council (FORMAS), grant number 2018-00880. The funder has had no influence on the study design; in the collection, analysis and interpretation of data; in the writing of the report; and in the decision to submit the article for publication. We used ChatGPT 5.5 to create Figure 2 from an original figure generated using R statistics based on the COINr dataset. However, the text created in R was too small and ChatGPT was used to change the layout in order to increase clarity and readability. We also used ChatGPT for a final spelling and grammar check. All corrections were done manually.
Competing interests
None.



 Open access

