INTRODUCTION
Trypanosoma evansi is the most prevalent pathogenic trypanosome throughout the tropical and subtropical areas of the world, and infects a wide range of domestic and wild animals, causing devastating disease in equines known as ‘Surra’ or ‘Mal das Cadeiras’ (Desquenes et al. Reference Desquenes, Dargantes, Lai, Lun, Holzmuller and Jittapalapong2013). Transmission occurs via bloodsucking flies (Tabanus spp. and Stomoxys spp.), and occasionally by vampire bats (Desmodus rotundus) in Latin America (Herrera et al. Reference Herrera, Dávila, Norek, Abreu and Souza2004). This disease is characterized by rapid weight loss, various degrees of anaemia, intermittent fever, oedema of the hind limbs and progressive weakness, leading, in some cases, to death (Rodrigues et al. Reference Rodrigues, Fighera, Souza, Schild and Soares2005). Previous studies showed that liver is one of the most widely affected organ by T. evansi (Biswas et al. Reference Biswas, Choudhury and Misra2001), causing enzymatic and biochemical alterations, such as energy metabolism impairment, increased biomarkers of hepatic function and decreased Na+, K+-ATPase activity (Baldissera et al. Reference Baldissera, Rech, Gring, Kolling, Da Silva, Gressler, Souza, Vaucher, Schwertz, Mendes, Leipnitz, Wyse, Stefani and Monteiro2015). In this context, imbalanced in the antioxidant/oxidant status has been observed in liver tissue of rats experimentally infected by T. evansi (Baldissera et al. Reference Baldissera, Oliveira, Rech, Rezer, Sagrillo, Alves, da Silva, Leal, Boligon, Athayde, Da Silva, Mendes and Monteiro2014).
Oxidative stress is a disturbance in antioxidant-prooxidant status in favour of an excessive generation or lower removal speed of free radicals (Winterbourn, Reference Winterbourn2015). This process leads to biomolecular damage caused by an attack of free radicals or other reactive oxygen species (ROS), leading to the oxidation of biomolecules with consequent loss of its biological function and/or homeostatic imbalance and tissue injury, usually considered to be deleterious and not readily reversible (Halliwell and Whiteman, Reference Halliwell and Whiteman2004). Accumulation of ROS and oxidative tissue damage have been implicated in a variety of pathological diseases (Sena and Chandel, Reference Sena and Chandel2012), such as those caused by T. evansi. Recently, trypanosomosis caused by T. evansi has been linked to a state of oxidative stress in different species and tissues (Saleh et al. Reference Saleh, Al-Salahy and Sanousi2009). Increased malondialdehyde (MDA) levels and reduced superoxide dismutase (SOD), in addition to changes in catalase (CAT) activities were observed in serum and cardiac tissue of camels naturally infected by T. evansi (Saleh et al. Reference Saleh, Al-Salahy and Sanousi2009; El-Deeb and Elmoslemany, Reference El-Deeb and Elmoslemany2015). Also, Ranjithmar et al. (Reference Ranjithkumar, Kamili, Saxena, Dan, Dey and Raut2011) demonstrated disturbances on oxidant/antioxidant equilibrium in serum and total blood of horses naturally infected by T. evansi. In this context, Baldissera et al. (Reference Baldissera, Oliveira, Rech, Rezer, Sagrillo, Alves, da Silva, Leal, Boligon, Athayde, Da Silva, Mendes and Monteiro2014) demonstrated that T. evansi causes oxidative stress in liver tissue, characterized by lipid damage and disturbance on antioxidant/oxidant status, contributing to the pathophysiology of this disease.
Nerolidol (3,7,11-trimethyl-1,6,10-dodecatrien-3-ol) is an acyclic sesquiterpene found in essential oils from several plants, such as Piper claussenianum (Marques et al. Reference Marques, Barreto, Batista, Curvelo, Velozo, Moreira, Guimarães, Soares and Kaplan2010). Many medicinal benefits of nerolidol have been identified, including anti-bacterial, leishmanicidal and antischistosomal properties (Arruda et al. Reference Arruda, D'Alexandri, Katzin and Uliana2005; Lang and Buchbauer, Reference Lang and Buchbauer2012; Silva et al. Reference Silva, Oliveira, de Carvalho, de Sousa, Freitas, Pinto and de Moraes2014). Moreover, the trypanocidal action of nerolidol-loaded nanospheres (N-NS) was demonstrated by Baldissera et al. (Reference Baldissera, Grando, Souza, Cossetin, Sagrillo, Nascimento, da Silva, Dalla Lana, da Silva, Stefani and Monteiro2016) against T. evansi infection. Recently, the antioxidant effect of nerolidol was observed by Nogueira Neto et al. (Reference Nogueira Neto, de Almeida, Oliveira, dos Santos, de Souza and de Freitas2013), by reducing lipid peroxidation and preventing changes on CAT and SOD activities.
Oxidative stress can contribute to the pathophysiology of T. evansi infection since the antioxidant effect of nerolidol is already known. Therefore, the aim of this study was to investigate the effect of nerolidol free (N-F) and N-NS on the prevention or reduction of antioxidant/oxidant disequilibrium in liver tissue of mice experimentally infected by T. evansi.
MATERIALS AND METHODS
Nerolidol
Nerolidol (molecular weight: 222·37 g m) showed 97% purity and was purchased from Sigma-Aldrich®. N-F was administered at 100%.
Nerolidol-loaded nanospheres
Preparation and characterization
N-NS suspension was prepared according to the interfacial deposition of preformed polymer (Fessi et al. Reference Fessi, Puiseux, Devissaguet, Ammoury and Benita1989), as described by Baldissera et al. (Reference Baldissera, Grando, Souza, Cossetin, Sagrillo, Nascimento, da Silva, Dalla Lana, da Silva, Stefani and Monteiro2016). All suspensions were prepared in triplicate and placed in amber glass bottles. The pH determination was performed directly in the suspensions in potentiometer (Digimed®). The determination of the diameter and polydispersity of nanospheres in suspension were performed by dynamic light scattering using the Zetasizer®, Nano-ZS from Malvern equipment. The suspensions were diluted 500 times (v:v) in Milli-Q water and the results were determined by the average of three replicates. The zeta potential of the N-NS was obtained using the technique of electrophoretic mobility Zetasizer®, Malvern Nano-ZS instrument. The samples were pre-diluted at 500 times (v:v) in 10 mm sodium chloride and filtered through a membrane with 0·45 µm. The results were expressed in millivolts (mV) as an average of three determinations.
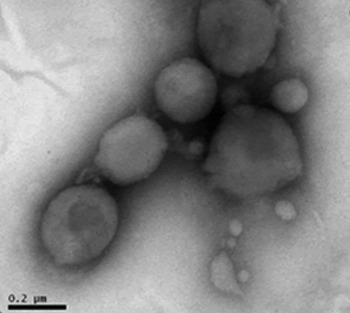
N-NS was evaluated regarding its physical and chemical properties. The particle size was 149·5 nm, polydispersion index of 0·117, with a zeta potential of −12·8 mV and pH 6·84. Transmission electron microscopy (TEM) analysis demonstrated uniform and spherical particles similar size as found by photon correlation spectroscopy technique (approximately 150–200 nm) (Fig. 1).
TEM image of N-NS with uniform, spherical and similar size. Bar 0·2 µm (100 000×). N-NS, nerolidol nanospheres; TEM, transmission electron microscopy.

Trypanosoma evansi isolate
Trypanosoma evansi was originally isolated from a dog naturally infected (Colpo et al. Reference Colpo, Monteiro, Stainki, Colpo and Henriques2005) and kept in liquid nitrogen. Later, this material was used to infect one Wistar rat (R1) intraperitoneally. This procedure was performed to obtain large amounts of viable parasite for this experiment.
Animal model and experimental design
A total of 36 female 60-day-old mice (outbred strain and heterogenic) weighing an average of 30 ± 0·4 g were used in this study. Animals were maintained at 22–24 °C and 70% humidity with free access to water and food, under a 12:12 h light/dark cycle starting at 7:00 AM. Animals were used according to the guidelines of the Committee on Care and Use of Experimental Resources of the Universidade Federal de Santa Maria, Brazil (protocol number 2391230516). All efforts were made to minimize animal suffering and to reduce the number of animals used in this study. All animals were subjected to an adaptation period of 30 days.
The animals were divided into six groups (A–F), with six animals each. Groups A, B and C were composed of uninfected animals, while animals in groups D, E and F were inoculated intraperitoneally with 0·06 mL of blood obtained from one rat (R1) containing 2·0 × 105 trypanosomes. Groups A and D were used as negative and positive controls (saline treatment), respectively. Animals of groups B and E received N-F treatment, while animals of groups C and F received N-NS treatment; both at daily oral doses of 1·0 mL kg−1 for 5 consecutive days before and after infection, according to the protocol described by Mohd-Shukri and Zainal-Abidin (Reference Mohd-Shukri and Zainal-Abidin2011) and Baldissera et al. (Reference Baldissera, Grando, Souza, Cossetin, Sagrillo, Nascimento, da Silva, Dalla Lana, da Silva, Stefani and Monteiro2016). The animals were infected 5 days after the beginning of the treatment, according to Mohd-Shukri and Zainal-Abidin (Reference Mohd-Shukri and Zainal-Abidin2011). The animals were observed daily and parasitemia was evaluated daily through blood smears. Each slide was prepared with fresh blood collected from the tail vein, stained by the panoptic method, and visualized (1000×) according to the methodology described by Da Silva et al. (Reference Da Silva, Doyle and Monteiro2006).
Sampling and tissue preparation
Five days after infection, the animals were anaesthetized with isoflurane in an anaesthetic chamber. Blood collection was performed by cardiac puncture, followed euthanasia by decapitation. Whole blood was collected and stored in tubes without anticoagulant and centrifuged (3000 rpm, 15 min) to obtain serum to measure nerolidol levels and biomarkers of liver function. Liver samples were collected and dissected on a glass dish over ice for the measurement of oxidative stress parameters and histopathological analyses.
Liver were homogenized (1:10 w/v) in a glass flask with Tris-HCl buffer (10 mm, pH 7·4), and centrifuged (3000 × g , 10 min). Aliquots of the supernatants were stored at −80 °C until utilization. The protein content was tested by Bradford's method and standardized using bovine serum albumin (Bradford, Reference Bradford1976).
Oxidative and antioxidant status
ROS production
The 2'7’-dichloroflurescein diacetate (DCF-DA) levels were determined as an index from the peroxide produced in the cellular components via DCFH production on the oxidation assay. This experimental method of analysis is based on the deacetylation of the DCFH-DA probe, that is subsequently oxidated by reactive species into DCF, a highly fluorescent compound (Halliwell and Gutteridge, Reference Halliwell and Gutteridge2005). The ROS levels in liver homogenates were determined by using the DCFH-DA method (Lawler et al. Reference Lawler, Song and Demaree2003). The supernatant of liver homogenate was added to a medium containing Tris-HCl buffer (10 mm; pH 7·4). The absorbance of the samples was measured by a spectrophotometer (wavelength of 522 nm). The results were expressed as fluorescence intensity per mg of protein.
Thiobarbituric acid reactive species (TBARS)
As an index of lipid peroxidation, TBARS was measured during an acid-heating reaction as previously described by Ohkawa et al. (Reference Ohkawa, Ohishi and Yagi1979) with few modifications. Briefly, 200 µL of supernatant (1:10 w/v) from homogenized tissue was mixed with 500 µL of 2·5 M acetic acid pH 3·4, 500 µL of 0·8% thiobarbituric acid, 200 µL of 8·1% sodium dodecyl sulphate (SDS), and 100 µL of Milli-Q-water. This mixture was heated in a water bath for 2 h. A malondialdehyde (MDA) solution was used as reference standard. TBARS levels were determined by the absorbance at 532 nm, and results were expressed as malondialdehyde equivalents (nm MDA mg−1 of protein). All samples were carried out in duplicate.
Non-protein thiols (NPSH)
Tissue non-protein thiols were determined as previously described by Ellman (Reference Ellman1959). Briefly, an aliquot of the supernatant (1:10 w/v) from homogenized tissue was diluted (1:1) with 10% TCA, vortexed and centrifuged at 2000 × g for 10 min. Subsequently, the supernatant was mixed with 250 µ m DNTB in a final volume of 2 mL and the absorbance was read at 412 nm. A cysteine solution was used as reference standard. NPSH were expressed as nm NPSH g−1 of tissue.
Measurement of catalase activity
CAT activity was assayed according to Aebi (Reference Aebi1984) by measuring the absorbance (240 nm) after a decrease of H2O2. The reaction medium contained 20 mm H2O2, O.1% Triton X-100, 10 mm potassium phosphate buffer, pH 7·0 and 10 µL of the supernatants. CAT is responsible for the transformation of H2O2 in H2O. Hydrogen peroxide can react with thiol and methionyl groups of enzymes and other proteins, and form the high reactive hydroxyl radicals. One CAT unit is defined as one nm of hydrogen peroxide consumed per minute and the specific activity is calculated as CAT units per mg of protein. All samples were carried out in duplicate.
Measurement of SOD activity
SOD activity was spectrophotometrically assayed as described by Misra and Fridovich (Reference Misra and Fridovich1972). Briefly, epinephrine rapidly auto-oxidizes at pH 10·2 producing adrenochrome, a pink-coloured product that can be detected at 480 nm. The addition of samples containing SOD inhibition rate was monitored during 120 s at intervals of 15 s. The amount of enzyme required to produce 50% inhibition at 40 °C was defined as one unit of enzyme activity. All samples were carried out in duplicate and the specific activity was expressed as units mg−1.
Glutathione S-transferase (GST) assay
GST activity was measured as described by Habig et al. (Reference Habig, Pabst and Jakoby1974). Fresh prepared cell lysate (25–50 µL) was mixed in a cuvette with 1 mL of GST assay buffer containing either 1 mm -chloro-2,4-dinitrobenzene (CDNB) and 1 mm reduced glutathione [GSH] or 1 mm 4-nitrobenzylchloride, and 5 mm GSH in 0·11 M sodium phosphate, pH 6·5; and incubated at room temperature. The absorbance (CDNB, 340 nm; 4-nitrobenzylchloride, 310 nm) was measured at timed intervals, and the specific GST activity of each lysate was determined based on the increase in absorbance, the time between measurements (min), and the amount of protein (μg). One GST unit is defined as the amount of protein forming 1 µ m GS-DNB per minute under standard incubation condition. Specific activity was expressed as units mg−1.
Biomarkers of hepatic function
Seric levels of alanine aminotransferase (ALT) and aspartate aminotransferase (AST) were evaluated in a semi-automatic analyzer (Vitros 250, Ortho Clinical Diagnostics) using commercial kits (Labtest Diagnóstica S.A., Lagoa Santa, MG, Brazil). All tests were carried out in duplicate.
Nerolidol quantification in serum
Chemical, apparatus and general procedures
All chemical were of analytical grade. Acetonitrile, methanol and formic acid were purchased from Merck (Darmstadt, Germany). High performance liquid chromatography (HPLC-DAD) was performed with a Shimadzu Prominence Auto Sampler (SIL-20A) HPLC system (Shimadzu, Kyoto, Japan), equipped with a CBM 20A integrator, SPD-M20A diode array detector and LC solution 1·22 software.
Quantification of compounds by HPLC-DAD
The samples were injected onto reversed phase Phenomenex C18 column (250 × 4 mm2) packed with 5 µm diameter particles. The mobile phase consisted initially of 60% acetonitrile and 40% water for 15 min, followed by a gradient from 40 to 100% acetonitrile for 15–20 min and 100% acetonitrile for 20–40 min. The flow rate of 0·9 mL min−1 and the injection volume was 20 µL, following the method described by Gruber et al. (Reference Gruber, Kittipongpatana, Bloxton, Der Marderosian, Schaefer and Gibbs2004) with slight modifications. The sample and mobile phase were filtered through 0·45 µm membrane filter (Millipore), and degassed by ultrasonic bath prior to use. Stock solutions of standard reference were prepared in the HPLC mobile phase at a concentration range of 0·050–0·300 mg mL−1. Quantifications were carried out by integration of the peaks using the external standard method, at 210 nm with a variable wavelength UV-visible detector. All chromatography operations were carried out in triplicate and at room temperature.
Limit of detection (LOD) and limit of quantification (LOQ)
The LOD and LOQ were calculated based on the standard deviation of the responses and the slope using three independent analytical curves. LOD and LOQ were calculated as 3·3 and 10 σ/S, respectively, where σ is the standard deviation of the response and S is the slope of the calibration curve (Boligon et al. Reference Boligon, Piana, Kubiça, Mario, Dalmolin, Bonez, Weiblen, Lovato, Alves, Campos and Athayde2015).
Histopathology
Samples of liver were fixed in 10% formaldehyde solution and submitted to histological routine. Histological section (6 µm) were cut and stained with Hematoxylin-Eosin (HE). All slides were examined by two pathologists in a double blinded manner to detect microarchitecture and hepatocyte alterations.
Statistical analysis
Since most of the data was parametric, as showed by the Shapiro–Wilk test, the bilateral two-way analysis of variance (ANOVA) followed by Tukey post-hoc analysis were used for mean comparison. Differences between groups were rated significant at P < 0·05. The Pearson correlation (r 2) test was used to verify the correlation between nerolidol concentration in serum and oxidative stress parameters in liver tissue. All analyses were carried out in an IBM-compatible computer using the Statistical Package for the Social Sciences (SPSS) software 20. The results were showed as means ± standard deviation of the mean.
RESULTS
Parasitemia estimation
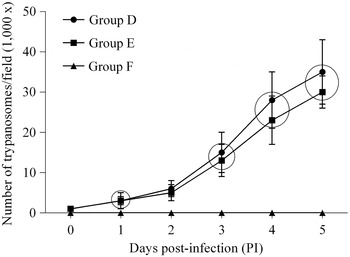
Parasitemia estimation is shown in Fig. 2, as mean and standard deviation by group. Infected animals showed higher parasitemia on day 5 post infection (PI) (mean of 35 trypanosomes/field – 1000×). Infected animals treated with nerolidol showed a mean of 32 trypanosomes/field (1000×) on day 5 PI, while infected animals treated with N-NS showed no parasites on day 5 PI.
Parasitemia of Trypanosoma evansi infected mice on day 5 PI in the group D (infected and untreated), the group E (infected and treated with nerolidol) and the group F (infected and treated with N-NS). The results (mean and standard deviation) within a circle are not statistically different (Tukey test; P > 0·05), at the same day. N-NS, nerolidol in nanospheres; PI, post-infection.

Oxidative stress
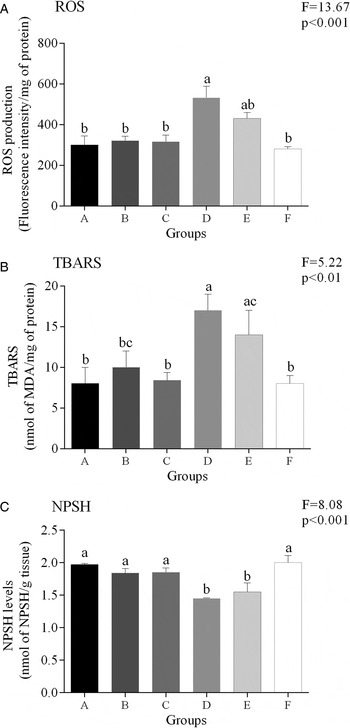
Figure 3 shows the effects of N-F and N-NS administration on the non-enzymatic oxidative variables (ROS, TBARS and NPSH levels) in liver tissue. On day 5 PI, ROS levels showed a significant increase (P < 0·05) in liver of mice infected by T. evansi (the group D) compared with uninfected mice (the group A). There was no difference on hepatic ROS levels between uninfected mice (the group A) and uninfected mice treated with N-F (the group B), and N-NS (the group C) (P > 0·05). Additionally, it was observed similar levels of ROS in the liver of infected animals treated with N-NS (the group F) compared with uninfected animals (the group A), or it was lower compared with infected animals (the group D) (P < 0·05), as well as observed for TBARS levels. NPSH levels showed a significant decrease (P < 0·05) in the liver of mice infected by T. evansi compared with uninfected mice. There was no difference in NPSH levels in the liver of uninfected mice and uninfected mice treated with N-F and N-NS (P > 0·05). Additionally, it was observed similar levels of NPSH in the liver of infected animals treated with N-NS compared with uninfected animals, and higher when compared with infected animals (P < 0·05).
Non-enzymatic oxidative variables (ROS (A), TBARS (B) and NPSH (C) levels) in liver tissue of mice experimentally infected by T. evansi. Groups: A (untreated and uninfected), B (uninfected and treated with N-F), C (uninfected and treated with N-NS), D (untreated and infected), E (infected and treated with N-F) and F (infected and treated with N-NS). The data are expressed as mean and standard deviation of 6 animals for each group. Groups with different letters are statistically different using the Tukey post hoc test. ROS, reactive oxygen species; TBARS, thiobarbituric reactive acid substances; NPSH, non-protein thiols; N-NS nerolidol in nanospheres; N-F, nerolidol free.

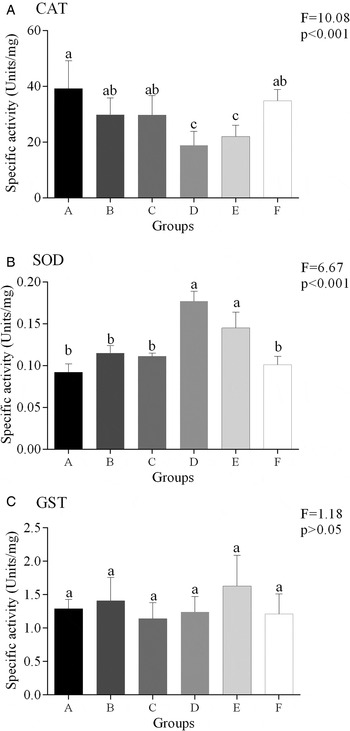
Figure 4 shows the effects of N-F and N-NS administration on enzymatic oxidative variables (CAT, SOD and GST activities) in liver tissue of mice. On day 5 PI, CAT activity showed a significant decrease (P < 0·05) in liver samples from mice infected by T. evansi compared with uninfected animals. There was no difference in hepatic CAT activity between uninfected and uninfected mice treated with N-F and N-NS (P > 0·05). Additionally, it was observed similar CAT activity in liver samples from infected animals treated with N-NS compared with uninfected animals, and it was higher compared with infected animals (P < 0·05). Regarding SOD activity, there was a significant increase (P < 0·05) in liver of mice infected by T. evansi compared with uninfected mice. There was no difference on hepatic SOD activity between uninfected mice and uninfected animals treated with N-F and N-NS (P > 0·05). Infected animals treated with N-NS showed similar hepatic SOD activity compared with uninfected animals, or lower SOD activity compared with infected group (P < 0·05). There was no difference (P > 0·05) among groups regarding GST activity.
Enzymatic oxidative parameters (CAT (A), SOD (B) and GST (C) activities) in liver tissue of mice experimentally infected by T. evansi. Groups: A (untreated and uninfected), B (uninfected and treated with N-F), C (uninfected and treated with N-NS), D (untreated and infected), E (infected and treated with N-F) and F (infected and treated with N-NS). The data are expressed as mean and standard deviation of 6 animals for each group. Groups with different letters are statistically different using the Tukey post hoc test. CAT, catalase; SOD, superoxide dismutase; GST glutathione-S-transferase; N-NS, nerolidol in nanospheres; N-F, nerolidol free.

Biomarkers of hepatic function
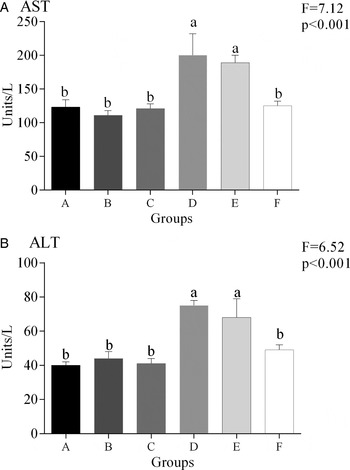
Figure 5 shows the effects of N-F and N-NS administration on seric biomarkers of hepatic function. On day 5 PI, AST and ALT levels showed a significant increase (P < 0·05) in serum of mice infected by T. evansi compared with uninfected mice. There was no difference in seric AST and ALT levels between uninfected mice and uninfected mice treated with N-F and N-NS (P > 0·05). There were no differences (P > 0·05) on seric AST and ALT levels between infected animals treated with N-NS compared with uninfected animals, and lower when compared with infected animals (P < 0·05).
Biomarkers of hepatic function (AST and ALT levels) in serum of mice experimentally infected by Trypanosoma evansi. Groups: A (untreated and uninfected), B (uninfected and treated with N-F), C (uninfected and treated with N-NS), D (untreated and infected), E (infected and treated with N-F) and F (infected and treated with N-NS). The data are expressed as mean and standard deviation of 6 animals for each group. Groups with different letters are statistically different using the Tukey post hoc test. AST, aspartate aminotransferase; ALT, alanine aminotransferase; N-NS, nerolidol in nanospheres; N-F, nerolidol free.

Nerolidol quantification in serum
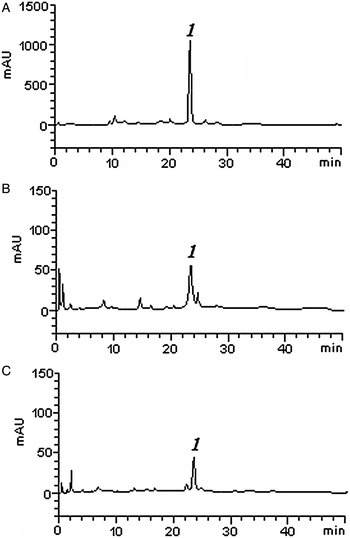
Figure 6 shows HPLC results for reference samples (Fig. 6A), uninfected and treated animals (Fig. 6B), and infected and treated animals (Fig. 6C). Groups B, C, E and F showed an average of 8·95 ± 0·15, 8·43 ± 0·77, 5·72 ± 0·50 and 5·80 ± 0·76 µg mL−1 of nerolidol (data not shown), respectively. Calibration curve was calculated as follows: Y = 13749x + 8513·2 (r = 0·9995). Nerolidol showed a retention time of 23·79 min.
Chromatograms of reference standard of nerolidol (A), as well as for the representative chromatogram of uninfected and treated animals (B) and the representative chromatogram of infected and treated animals (C). Nerolidol showed a retention time of 23·79 min.

Correlation study
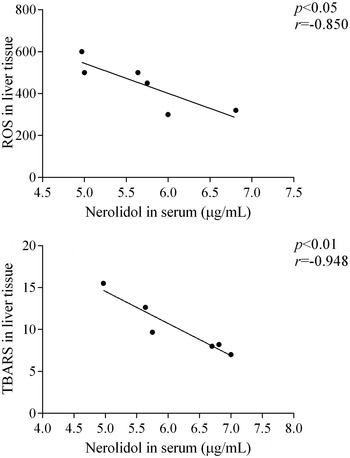
Figure 7 shows the relationship between seric nerolidol concentrations and oxidative stress variables in liver tissue of infected mice treated with N-NS, and a significant negative correlation (P < 0·05) was observed for ROS levels (r = −0·850) and TBARS levels (r = −0·946). No differences were observed between nerolidol concentration in serum and other variables used as marker of oxidative stress.
Pearson correlation between ROS levels in hepatic tissue and nerolidol concentration in serum (A), TBARS levels in liver and nerolidol concentration in serum (B) in mice infected by T. evansi and treated with N-NS. Significant correlation considering P < 0·05. ROS, reactive oxygen species; TBARS, thiobarbituric reactive acid substances.

Histopathology
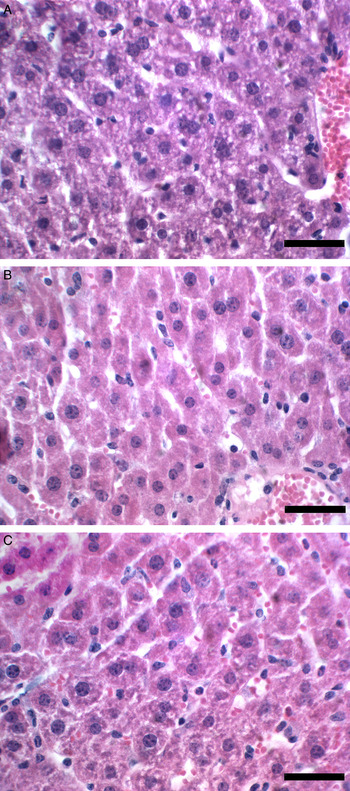
The uninfected animals (groups A, B and C) did not show pathological alteration in liver tissue (data not shown). Infected and untreated animals showed hepatocytes more acidophilic, with reduced size, and unclear cell limits, which indicates functional and structural changes in cytoplasmic organelles (Fig. 8A). Liver of infected animals treated with N-F showed a recovery process on the microarchitecture, as observed for N-NS treatment (Fig. 8B and C, respectively), showing microarchitecture similar to uninfected and untreated animals.
Liver histopathology of mice experimentally infected by Trypanosoma evansi. (A) Mice infected by T. evansi showed smaller hepatocytes with unclear cell limits and more acidophilic, indicating functional and structural changes in cytoplasmic organelles. (B) Mice infected by T. evansi treated with N-F showed normal hepatic architecture, as well as observed for mice infected and treated with N-NS (C). N-NS, nerolidol in nanospheres.

DISCUSSION
In the current study, it was investigated the efficiency of nerolidol to treat mice experimentally infected by T. evansi regarding the oxidative stress status. Our previous findings were confirmed in this study since T. evansi elicited hepatic antioxidant/oxidant impairment (Baldissera et al. Reference Baldissera, Oliveira, Rech, Rezer, Sagrillo, Alves, da Silva, Leal, Boligon, Athayde, Da Silva, Mendes and Monteiro2014). Moreover, it was demonstrated, for the first time, that N-NS provides significant protection against ROS formation, lipid peroxidation, preventing alterations on the antioxidant/oxidant status. In addition, it was observed a negative correlation between hepatic oxidative variables (ROS and TBARS) and seric nerolidol concentrations. These findings might be corroborated by the results on oxidant and antioxidant variables, as described below.
Regarding non-enzymatic oxidative variables, it was observed a significant increase on ROS and TBARS levels, and decreased levels of hepatic NPSH in mice infected by T. evansi, as demonstrated by Baldissera et al. (Reference Baldissera, Oliveira, Rech, Rezer, Sagrillo, Alves, da Silva, Leal, Boligon, Athayde, Da Silva, Mendes and Monteiro2014). ROS and free oxygen radicals cause lipid peroxidation and the end product of lipid peroxidation is malondialdehyde acid (MDA), such as observed in this study. Lipids, especially polyunsatured fatty acids, are sensitive to oxidation by free radicals, forming MDA (Rezaei and Dalir-Naghadeh, Reference Rezaei and Dalir-Naghadeh2006). The accumulation of MDA in tissues is an indicative of intensive free radical formation, oxidative stress and tissue damage (Chaudhuri et al. Reference Chaudhuri, Varshney and Patra2008). The infection caused by T. evansi in rodents can produce oxidative stress in liver tissue through interactions between the parasite and cell membranes, which generates ROS, and consequently, increases lipid peroxidation (Baldissera et al. Reference Baldissera, Oliveira, Rech, Rezer, Sagrillo, Alves, da Silva, Leal, Boligon, Athayde, Da Silva, Mendes and Monteiro2014). In N-NS treated animals, ROS and TBARS levels remained similar to uninfected groups, and lower than infected animals, demonstrating that the treatment was able to protect the liver against oxidation damage. This hepatoprotective function is certainly associated with its antioxidant properties, acting as free radical scavenger, which may effectively provide protection against membrane alterations, such as those observed by Nogueira-Neto et al. (Reference Nogueira Neto, de Almeida, Oliveira, dos Santos, de Souza and de Freitas2013) on hippocampus of mice. The protective effect of nerolidol against oxidative stress on hepatic tissue has not yet been reported in the literature, differently for sesquiterpene with well-known hepatoprotective effect, such as the antioxidant effect of β-caryophyllene in the liver of rats with fibrosis (Calleja et al. Reference Calleja, Vieites, Montero-Meterdez, Torres, Faus, Gil and Suárez2013). Regarding NPSH, infected animals showed lower levels compared with uninfected animals, as previously described by Baldissera et al. (Reference Baldissera, Oliveira, Rech, Rezer, Sagrillo, Alves, da Silva, Leal, Boligon, Athayde, Da Silva, Mendes and Monteiro2014). N-NS treatment was able to prevent NPSH reduction probably due to the presence of sulfhydryl (SH) groups. SH groups are responsible for keeping the defence against free radicals (Meister, Reference Meister1983), which can be observed by the reduction of ROS and TBARS levels in infected mice treated with N-NS.
CAT and SOD enzymatic activities were stimulated by the increase of ROS levels. Excessive production of ROS may have exceeded the body regulatory capacity, decreasing CAT and increasing SOD activities, respectively, such as observed in mice infected by T. evansi. This is the first study demonstrating that SOD activity in hepatic tissue of mice infected by T. evansi may transform reactive superoxide anions into H2O2. Subsequently, CAT can convert H2O2 to H2O and O2 (Shao et al. Reference Shao, Zhu, Dong, Wang, Xie, Zhang, Du and Zhu2012). Based on this evidence, we believe that increased SOD activity generates elevated quantities of H2O2 that inhibited CAT activity. Also, this reduction on CAT activity, already observed in the liver of rats infected by T. evansi (Baldissera et al. Reference Baldissera, Oliveira, Rech, Rezer, Sagrillo, Alves, da Silva, Leal, Boligon, Athayde, Da Silva, Mendes and Monteiro2014) suggests an increase on peroxides, in accordance with increased TBARS levels (De Franceschi et al. Reference De Franceschi, Rieger, Vargas, Rojas, Campos, Rech, Feksa and Wannmacher2013). Trypanosoma evansi did not affect GST activity, as well demonstrated by Anschau et al. (Reference Anschau, Dafré, Perin, Iagher, Tizatoo and Miletti2013) in rats experimentally infected by this protozoan.
In order to better understand the mechanisms of N-NS hepatoprotective activity, the effect on hepatic antioxidant defence system was explored, because antioxidant and detoxificant enzymes, such as CAT, SOD and GST, protect against oxidative stress and scavenge the excess generation of ROS, such as observed in this study. N-NS treatment was able to restore CAT and SOD activities in T. evansi infected mice. Many studies have shown that the hepatoprotective effect of sesquiterpenes compounds, such as nerolidol, is associated with the capacity to ameliorate antioxidant enzymes (Rocha et al. Reference Rocha, de Oliveira, de Araújo, Rios, Carvalho, Vasconcelos, Macêdo, Soares, De Sousa and de Sousa2011), such as those evaluated in this study. One study conducted by Rocha et al. (Reference Rocha, de Oliveira, de Araújo, Rios, Carvalho, Vasconcelos, Macêdo, Soares, De Sousa and de Sousa2011) demonstrated that sesquiterpene alpha-bisabolol was able to ameliorate SOD activity, and concomitantly to reduce lipid peroxidation on gastric tissue. Also, using other important sesquiterpene (caulerpenyne), increased liver antioxidant defence was observed, developing an important role in the response to an increased oxidative situation (Sureda et al. Reference Sureda, Box, Enseñat, Alou, Tauler, Deudero and Pons2006). Thus, it is suggested that antioxidant capacity of N-NS ameliorates the antioxidant defence against T. evansi infection.
Liver cells are damaged during T. evansi infection and hepatic enzymes reach the bloodstream, resulting in increasing concentrations of ALT and AST, for example (Baldissera et al. Reference Baldissera, Rech, Gring, Kolling, Da Silva, Gressler, Souza, Vaucher, Schwertz, Mendes, Leipnitz, Wyse, Stefani and Monteiro2015). ALT is a cytoplasmic enzyme released into the blood in response to damage in the structural integrity of liver cells, and it can also affect cell organelles such as mitochondria, and that is considered the major producer of free radicals (Robbins and Contran, 2008). Thus, increased ALT and AST levels might be contributing to oxidative stress in liver tissue, as observed in the present study. N-NS notably prevented the elevation of serum levels ALT and AST in infected mice. Many studies have shown that the hepatoprotective effects of sesquiterpenes compounds, such as nerolidol, might be associated with its antioxidant capacity to scavenge ROS (Sabir and Rocha, Reference Sabir and Rocha2008), such as observed by the utilization of antrosterol, that was able to prevent increased ALT and AST levels on liver injury (Huang et al. Reference Huang, Deng, Huang, Shao, Chen and Kuo2012). In the present study, N-NS inhibited increase on ROS levels of infected mice, which was corroborated by negative correlation between hepatic ROS levels and seric nerolidol concentration. Thus, we believe that the capacity of N-NS to inhibit increased ROS levels, also prevents the increased seric levels of ALT and AST.
In the current study, our findings showed that infected mice treated with N-NS did not show hepatotoxic damage. It indicated that the nanoencapsulation was able to prevent the oxidative damage caused by T. evansi infection. In fact, nanospheres system enables a controlled and sustained delivery of the drug, thus, preventing its bioaccumulation in vital organs, such as the liver (Fontana et al. Reference Fontana, Coradini, Guterres, Pohlmann and Beck2009; Marchiori et al. Reference Marchiori, Lubini, Dalla Nora, Friedrich, Fontana, Ourique, Bastos, Rigo, Silva, Tedesco and Beck2010). Our findings are in accordance with other studies that were performed with nanoformulation containing different drugs, thus indicating that modifications in drug delivery are able to prevent hepatic damage related to T. evansi infection (Baldissera et al. Reference Baldissera, Oliveira, Rech, Rezer, Sagrillo, Alves, da Silva, Leal, Boligon, Athayde, Da Silva, Mendes and Monteiro2014). Also, the properties of nanospheres observed in other studies, such as improvement in the therapeutic index of drugs, controlled drug release and the capacity of nanosphere to be used along as a delivery system, since they remain in the blood for a long time (Soppimath et al. Reference Soppimath, Aminabhavi, Kulkarni and Rudzinski2001), might be responsible for the enhanced hepatoprotective effect of nerolidol. Also, the absence of parasites in the blood stream of infected animals treated with N-NS may have contributed for the reduction on liver damage found in this group.
In conclusion, N-NS protected the liver from oxidative stress and tissue injuries caused by T. evansi infection, which might be due to its antioxidant properties. This treatment prevented the histological alterations in liver samples, which corroborated to the involvement of N-NS antioxidant properties. Therefore, the treatment should be considered a promising method against oxidative stress in liver tissue during T. evansi infection, and nanotechnology an encouraging approach to ameliorate drug's efficacy.
FINANCIAL SUPPORT
This research received no specific grant from any funding agency, commercial or not-for-profit sectors.