Implications
It is important in livestock production assessing animals in the management of their body reserves, in the face of environmental challenges and adverse sanitary conditions. This study evaluates the correlated response to selection in body reserves management and energy mobilisation of two lines divergently selected for litter size variability. Females selected for litter size homogeneity showed a better adaptation to energy challenges than females selected for litter size heterogeneity by increasing body reserves and mobilised fat reserves at delivery and lactation, leading to females that are more resilient.
Introduction
In commercial rabbit breeding, culling and mortality are important from the production and financial viewpoint (Rosell and de la Fuente, Reference Rosell and de la Fuente2016). Rosell and de la Fuente (Reference Rosell and de la Fuente2009) estimate the mortality or culling females before third delivery by 50%. These females are still growing and they often overlap lactation and gestation. This situation involves high nutritional requirements (Martinez-Paredes et al., Reference Martinez-Paredes, Ródenas, Martínez-Vallespín, Cervera, Blas, Brecchia, Boiti and Pascual2012). An energy deficit for gestation, lactation and maintenance will have a deteriorating effect on body condition of the females, and will increase the susceptibility to disease or death if reproduction continues under such conditions (Friggens, Reference Friggens2003). Animals balance their energy budget among energy-requirement functions such as reproduction, growth or immune function; therefore, a reduction in mobilisation of their body energy reserves may result in a weaker immune response and consequently in a poorer welfare (Pilorz et al., Reference Pilorz, Jäckel, Knudsen and Trillmich2005; Amat et al., Reference Amat, Aguilera and Visser2007).
Mobilisation of adipose tissue can be measured by the blood concentration of non-esterified fatty acids (NEFA) (Fortun et al., Reference Fortun, Prunier, Etienne and Lebas1994); a negative energy balance is associated with an increase of their levels in blood (Fortun-Lamothe, Reference Fortun-Lamothe2006). This mobilisation changes the animal body condition (Garnsworthy, Reference Garnsworthy2006), which can affect its survival (Roche et al., Reference Roche, Friggens, Kay, Fisher, Stafford and Berry2009). Body condition is a common tool for assessing the body energy stores of dams in animal production (review by Chilliard, Reference Chilliard1993). Perirenal fat thickness is used to measure body condition in rabbits, as it is their main fat deposit and is highly correlated with animal energy content (Pascual et al., Reference Pascual, Castella, Cervera, Blas and Fernández-Carmona2000).
In prolific species such as rabbits, variability in litter size during the female’s lifespan has been related to disease incidence (García et al., Reference García, Argente, Muelas, Birlanga and Blasco2012) and immune response (Blasco et al., Reference Blasco, Martínez-Álvaro, Garcia, Capcarova, Zbynovska, Petruska, Ibáñez-Escriche and Argente2018). A divergent selection experiment for litter size variability is currently being carried out in rabbits, with the homogenous line showing 45% lower litter size variability than the heterogeneous line (Blasco et al., Reference Blasco, Martínez-Álvaro, Garcia, Ibáñez-Escriche and Argente2017). The aim of this study was to analyse the correlated response to selection for these lines in body condition and fat reserves mobilisation.
Material and methods
Animals
Animals came from the seventh generation of a divergent selection experiment. The selection criterion was litter size variability at birth. Variability of litter size was estimated as phenotypic variance of litter size at birth within female taking into account all parities, after correcting litter size for the effects of year-season and parity-lactation status (see more details in Blasco et al., Reference Blasco, Martínez-Álvaro, Garcia, Ibáñez-Escriche and Argente2017). A total of 126 and 102 females of the high line (homogeneous) and the low line (heterogeneous), respectively, constituted the seventh generation of selection and they were used to estimate response to selection and correlated response in litter size 1st and 2nd parity and survival rate. Females were classified as survivor or non-survivor when they were culled for sanitary reasons or died before the third kindling. The causes of culling or mortality were determined by observation and were the following: obstetric disorders, ulcerative podermatitis, diarrohea, mastitis and coryza. Obstetric disorders included the cases of death at delivery, mummified foetuses, prolapse and infertility. Elimination for infertility was considered when a doe had four consecutive non-fertile mating or seven consecutive refusals to the male.
A subset of 82 females from the high line and 76 females from the low line were used to measure body condition and energy mobilisation. Females were primiparous at the beginning of the study.
All animals were kept on the farm at the Miguel Hernández University, Elche (Spain). Rabbits were fed a standard commercial diet (16.5% CP, 15.8% fibre, 4% fat, 36% NDF, 18.5% ADF, 12% indigestible fibre and 2.400 kcal digestible energy; Cunilactal, Nutreco). Food and water were provided ad libitum. Females were housed in individual cages (37.5×33 ×90 cm) under a constant photoperiod of 16 h continuous light:8 h continuous darkness and controlled ventilation throughout the experiment. They were first mated at 18 weeks of age and at 10 days after parturition thereafter. Litters were not standardised.
Traits
Litter size was recorded. Litter size variability with all parities, after correcting litter size for the effects of year-season and parity-lactation status, was estimated for all females of seventh generation.
Body weight, body fat reserves and energy mobilisation were recorded at three different physiological stages: second mating, delivery and 10 days after delivery. Perirenal fat thickness was measured by ultrasound imaging to evaluate body fat reserves, as described by Pascual et al. (Reference Pascual, Blanco, Piquer and Quevedo2004), using Justvision 200 SSA-320A ultrasound equipment (Toshiba, Tokyo, Japan). Basal NEFA were measured to evaluate energy mobilisation. Lipolytic potential (∆NEFA) of fat reserves was estimated as the increase of blood NEFA after injection of isoproterenol, an adrenergic agent that increases lipolysis (Theilgaard et al., Reference Theilgaard, Facila, Blas, Baselga and Pascual2005). Blood was sampled before and 7.5 min after injection of 50 µg of isoproterenol per kilogram of BW (Sigma 15627). This time interval and concentration of isoproterenol were established as appropriate by Theilgaard et al. (Reference Theilgaard, Facila, Blas, Baselga and Pascual2005) for assessing the ∆NEFA in rabbits. In total, 4 ml of blood samples were obtained from the central ear artery early in the morning, before feed was distributed, in order to prevent the effect of feeding, as proposed by Theilgaard et al. (Reference Theilgaard, Facila, Blas, Baselga and Pascual2005). The samples were drawn into tubes containing EDTA and centrifuged immediately after sampling (4000 rpm, 4°C, 15 min) and plasma was stored at −20°C until further analysis. Plasma NEFA concentrations were determined using the in vitro enzymatic colorimetric methodology prepared by the NEFA test Wako C (Wako Pure Chemical Industries Ltd, Osaka, Japan). Samples were analysed with a UV spectrophotometer (HP Model 8453, Hewlett Packard, Palo Alto, CA, USA), measured at 550 nm. The sensitivity of the assay was 0.01 mmol/l and the intra- and inter-assay CV were both <5%.
Statistical analysis
Litter size variability was analysed using a model with a single group effect with four levels (survivor females at third delivery of the high line and of the low line, and non-survivor females at third delivery of the high line and of the low line). Litter size at 1st parity was analysed using a model with season effect and the same group effect as the former model. Litter size at 2nd parity was analysed with the same model as first parity, including lactation status effect with two levels (lactating and non-lactating at mating). Body weight, perirenal fat thickness, NEFA and ∆NEFA after isoproterenol injection were analysed at second mating, delivery and 10 days after delivery using the same model as litter size at second parity, and repeating the same analyses including the covariate litter size at 1st parity for traits measured at mating, and litter size at second parity for traits measured at delivery and 10 days after delivery. Correlated responses to selection were estimated at the differences between high and low line.
All analyses were performed using Bayesian methodology (Blasco, Reference Blasco2017). Bounded uniform priors were used for all effects. Residuals were a priori normally distributed with mean 0 and variance Iσ2 e. The prior for the variance was also bounded uniform. Features of the marginal posterior distributions for all unknowns were estimated using Gibbs sampling. The Rabbit programme developed by the Institute for Animal Science and Technology (Valencia, Spain) was used for all procedures. We used a chain of 60 000 samples, with a burn-in period of 10 000. Only one out of every 10 samples was saved for inferences. Convergence was tested using the Z criterion of Geweke (Sorensen and Gianola Reference Sorensen and Gianola2002) and Monte Carlo sampling errors were computed using time-series procedures described in Geyer (Reference Geyer1992).
Results
The main causes of mortality or culling before the third delivery were obstetric disorders (27%), ulcerative pododermatitis (17%), diarrhoea (15%), mastitis (11%) and coryza (7%). In total, 44% of the females died or were culled between the last week of gestation and the 1st week of lactation.
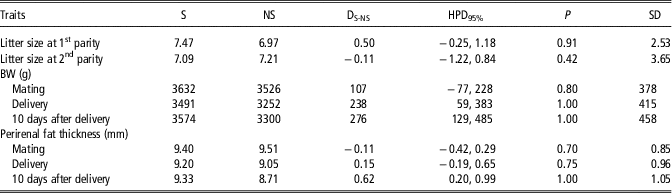
Features of the estimated marginal posterior distribution of the differences between survivor and non-survivor females are presented in Table 1. Table 1 offers the probability of these differences being greater than zero if D>0 or lower than zero if D<0. Notice that in Bayesian statistics these probabilities can be in some cases equal or higher than 0.95 even when the confidence intervals at 95% probability include zero (see Blasco, Reference Blasco2017). In addition, notice that in a Bayesian context there is no ‘significance’, but the actual probabilities of the differences being higher or lower than zero are estimated instead.
Features of the marginal posterior distribution of the differences for litter size at 1st and 2nd parity, BW and perirenal fat thickness between females that survive at third delivery and non-survivor does in rabbits

S=survivor females; NS=non-survivor females; DS-NS=median of the difference between survivor and non-survivor does; HPD95%=highest posterior density region at 95%; P=probability of the difference being >0 when DS-NS >0 and being <0 when DS-NS <0.
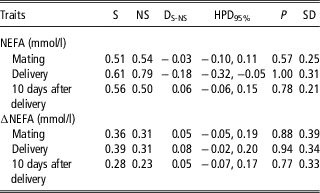
Litter size at 1st parity was higher in survivor females than in non-survivor females (D=0.50; P=0.91). No differences were found for litter size at 2nd parity. Survivor females presented higher BW at delivery and at 10 days after delivery, around 0.6 SD for both traits (P=1.00). We observed similar perirenal fat thickness at mating and delivery in both females, but at 10 days after delivery survivor females showed a large difference (0.6 SD of this trait, P=1.00). At delivery, a substantial difference between survivor and non-survivor females was found for NEFA (0.6 SD of this trait, −0.18 mmol/l, P=1.00, Table 2). However, the difference for ∆NEFA was lower (0.2 SD of this trait, 0.08 mmol/l, P=0.94). Similar results were obtained when the covariate litter size was included in the analyses (data not shown).
Features of the marginal posterior distribution of the differences for basal non-esterified fatty acids (NEFA) and lipolytic potential of fat reserves (∆NEFA) between survivor and non-survivor does at third delivery, measured at second mating, delivery and 10 days after delivery in rabbits

S=survivor females; NS=non-survivor females; DS-NS=median of the difference between the survivor and non-survivor does; HPD95%=highest posterior density region at 95%; P=probability of the difference being >0 when DS-NS >0 and being <0 when DS-NS <0.
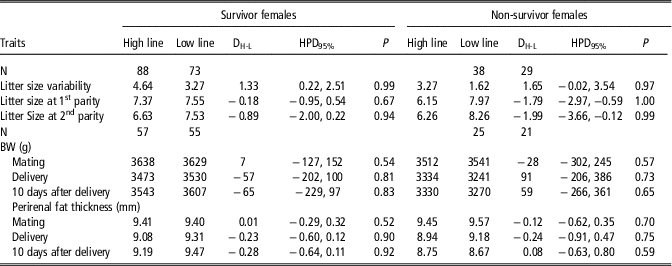
Table 3 summarises the features of marginal posterior distributions of the differences between lines for litter size variability and litter size at 1st and 2nd parity. As the environmental effects are the same for both lines, the differences between lines (D) are genetic differences, so they estimate the response and correlated responses to selection. Response to selection was obtained in the seventh generation. The high line showed higher litter size variability than the low line for both survivor (D=1.33; P=0.99) and non-survivor females (D=1.65; P=0.97). Survival rate did not have a correlated response to selection (38/88 v. 29/73; P(χ 2)=0.77). Survivor females from both lines showed similar litter size at 1st parity, but the high line showed lower litter size at 2nd parity than the low line (D=−0.89, P=0.94). Non-survivor females of the high line showed lower litter size in both parities than the low line.
Features of the marginal posterior distribution of the differences for litter size variability, litter size at 1st and 2nd parity, BW and perirenal fat thickness between the high and the low litter size variability lines in rabbits

DH-L=median of the difference between the high and the low lines; HPD95%=highest posterior density region at 95%; P=probability of the difference being >0 when DH-L >0 and being <0 when DH-L <0.
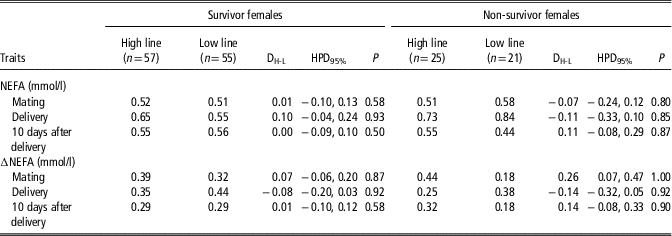
Survivor females from both lines had similar BW at all stages (Table 3). At mating, perirenal fat thickness was also similar in both lines, but the high line showed lower perirenal fat thickness than the low line at delivery (−0.23 mm, P=0.90) and this difference was consolidated 10 days after (−0.28 mm, P=0.92). This difference was moderate (around 0.3 SD of this trait). At delivery, the difference between lines was also moderate for NEFA (0.3 SD of this trait, 0.10 mmol/l, P=0.93; Table 4) and low for ∆NEFA (0.2 SD of this trait, −0.08 mmol/l, P=0.92). No differences in the high and low lines were found at mating and 10 days after delivery for either trait. Non-survivor females of both lines showed similar BW, perirenal fat thickness and NEFA (Tables 3 and 4). Lipolytic potential was higher in the high line at mating and 10 days after delivery (0.26 mmol/l and 0.14 mmol/l, respectively), and lower at delivery (−0.14 mmol/l, P=0.92) than in the low line. These differences were relevant (between 0.4 and 0.7 SD of these traits). Similar results were obtained when the covariate litter size was included (data not shown), except for BW at mating in non-survivor females (D=−145; HPD95%=−370, 65; P=0.90) and ∆NEFA at mating in survivor females (D=0.11; HPD95%=−0.02, 0.25; P=0.95); D is the median of the difference and HPD95% the highest posterior density region at 95%.
Features of the marginal posterior distribution of the differences for basal non-esterified fatty acids (NEFA) and lipolytic potential of fat reserves (∆NEFA) between the high and the low litter size variability lines in rabbits

DH-L=median of the difference between the high and the low lines; HPD95%=highest posterior density region at 95%; P=probability of the difference being >0 when DH-L >0 and being <0 when DH-L <0.
Discussion
Response to selection was obtained in the seventh generation, agreeing with the results of the whole experiment (Blasco et al., Reference Blasco, Martínez-Álvaro, Garcia, Ibáñez-Escriche and Argente2017), and correlated responses are expected. Regardless of the line, around 30% of the females were non-survivor before the third delivery. The highest mortality in the females occurred during the last week of pregnancy and the first 7 days of lactation, which agrees with Rosell and De la Fuente (Reference Rosell and de la Fuente2016). We used BW and perirenal fat thickness as indicators of body condition, NEFA as indicators of actual energy mobilisation and ∆NEFA as indicator of lipolytic potential following Theilgaard et al. (Reference Theilgaard, Sánchez, Pascual, Friggens and Baselga2006). Body condition, NEFA and ∆NEFA showed how the rabbits prioritise their energy reserves. Immediately after delivery, milk production is low and feed intake is sufficient to cover the nutritional needs for both maintenance and lactation (Feugier and Fortun-Lamothe, Reference Feugier and Fortun-Lamothe2006), so the females tend to increase their body reserves between delivery and early lactation (Theilgaard et al., Reference Theilgaard, Baselga, Blas, Friggens, Cercera and Pascual2009). Non-survivor females showed poorer BW, higher energy mobilisation and less ∆NEFA than survivor females when the doe needs to manage its energy reserves, that is at delivery. The reduction in body condition is associated with diseases (Bareille et al., Reference Bareille, Beaudeau, Billon, Robert and Faverdin2003), as the immune system in sick animals has greater nutrient requirements (Johnson, Reference Johnson1998).
Delivery and lactation are stressful stages for female mammals (Gellrich et al., Reference Gellrich, Sigl, Mayer and Wiedemann2015). Several studies have reported that stress negatively affects the immune system, and hence disease susceptibility (see review by Webster-Marketon & Glaser, Reference Webster-Marketon and Glaser2008). Stress also has a negative effect on resource allocation and body condition (Broom, Reference Broom2009). Because of this, body condition has been proposed as an indicator for animal health and welfare (Blache et al., Reference Blache, Terlouw and Maloney2011). Our results show that selection for litter size homogeneity in survivor females led in the low line to higher deposition of fat reserves at delivery and 10 days after delivery than in the high line. After injection of the adrenergic agent, ∆NEFA was higher in the homogeneous line at delivery. Survivor females from the homogeneous line presented greater perirenal fat thickness and ΔNEFA but, interestingly, they presented lower NEFA at second delivery. In addition, the energy challenge was higher in the low line than in the high line, as low line reared one kit more. This situation would suggest that this line has a greater amount of body reserves which can be used if required; however, they did not use these extra-reserves at delivery. Savietto et al. (Reference Savietto, Cervera, Blas, Baselga, Larsen, Friggens and Pascual2013) argued that females following this strategy safeguard body reserves to cope with future reproduction and longevity. In this sense, results from the eighth to the tenth generation show 12% lower involuntary elimination rate in the low line than in the high line (Argente et al., unpublished data).
When body reserves, energy mobilisation and ∆NEFA were measured in non-survivor females, both lines showed similar BW, perirenal fat thickness and NEFA throughout the second reproductive cycle. However, ∆NEFA was different between lines, showing the low line higher ∆NEFA than the high line at delivery. New research should be carried out to determine the different causes of the differences found in ∆NEFA. We conclude that a correlated response in female body condition and fat mobilisation was obtained when selecting for litter size variability. The does selected for litter size homogeneity would be able to better deal with situations of high-energy demand than does with higher litter size variability, which should lead to higher health and welfare levels.
Acknowledgements
This study is supported by the Spanish Ministry of Economy and Competitiveness (MINECO), projects AGL2014-55921-C2, P1 and P2.
Declaration of interest
The authors declare that they have no competing interests.
Ethics statement
All experimental procedures involving animals were approved by the Miguel Hernández University of Elche Research Ethics Committee (reference number DTA-MJA-001-11), in accordance with Council Directives 98/58/EC and 2010/63/EU.
Software and data repository resources
Data and software are available upon request to the corresponding author.