

Introduction
In technology-intensive industries, top managers face rapid technological advancements and discontinuities. The key to the long-term survival of firms in such industries is continual exploratory innovation (Benner & Tushman, Reference Benner and Tushman2003; Enkel, Heil, Hengstler, & Wirth, Reference Enkel, Heil, Hengstler and Wirth2017; Luo, Lui, Liu, & Zhang, Reference Luo, Lui, Liu and Zhang2016). Therefore, understanding the determinants of technological exploration has emerged as one of the central inquiries in organizational studies. As the upper echelons, top management teams (TMTs) directly influence multiple aspects of innovation (Felekoglu & Moultrie, Reference Felekoglu and Moultrie2014; Mokhber, Khairuzzaman, & Vakilbashi, Reference Mokhber, Khairuzzaman and Vakilbashi2017; Xie, Wang, & Qi, Reference Xie, Wang and Qi2015). Therefore, one stream of research specifically investigates how the composition and heterogeneity of a TMT influence innovation processes and outcomes (e.g., Bantel & Jackson, Reference Bantel and Jackson1989; Kor, Reference Kor2006; Qian, Cao, & Takeuchi, Reference Qian, Cao and Takeuchi2013; Talke, Salomo, & Kock, Reference Talke, Salomo and Kock2011).
However, empirical findings from this line of research are mixed and inconclusive due to two potential limitations. First, existing research tests effects of various team diversity indices based on single-demographic attributes (e.g., age, tenure, and functional background) and does not consider the effects of potential subgroups that may form based on the alignment of multiple-demographic attributes. To address the limitation, our study drew from the demographic faultlines concept, which simultaneously considered multiple-demographic attributes (Lau & Murnighan, Reference Lau and Murnighan1998). Demographic faultlines are hypothetical dividing lines that split a team into relatively homogeneous subgroups based on team members' demographic alignment along multiple attributes. Existing research on TMT faultlines found that the effects of faultlines were task dependent and could either inhibit TMT performance in some tasks (Barkema & Shvyrkov, Reference Barkema and Shvyrkov2007; Ndofor, Sirmon, & He, Reference Ndofor, Sirmon and He2015; van Knippenberg, Dawson, West, & Homan, Reference van Knippenberg, Dawson, West and Homan2011) or enhance TMT performance in other tasks (Hutzschenreuter & Horstkotte, Reference Hutzschenreuter and Horstkotte2013; Xie, Wang, & Qi, Reference Xie, Wang and Qi2015). We adopted the demographic faultlines concept to examine the effects of TMT faultlines on the number of exploratory innovation. This focus is a research gap not addressed previously.
Second, while existing research on TMT faultlines has gained fruitful insights, it has not considered status difference within a TMT and the unique role of CEOs in integrating and influencing other TMT members. Upper-echelons research has long recognized the status disparity between CEOs and other senior managers, since CEOs often have disproportionate or even dominant power and authority (Hambrick, Reference Hambrick1994; Smith, Houghton, Hood, & Ryman, Reference Smith, Houghton, Hood and Ryman2006; Tien, Chen, & Chuang, Reference Tien, Chen and Chuang2013). However, existing research on TMT demographic faultlines has not considered the status difference between the CEO and other senior managers but has treated all of them as equal. To extend this line of research, we theorized that a CEO's position in the subgroup influenced team outcomes due to the status difference.
Drawing from the demographic faultlines concept and factoring in the unique roles and status of the CEO, we hypothesized that the degree of TMT faultline would have an inverted U-shape relationship with technological exploration. Furthermore, the membership of the CEO in the potential subgroup division would moderate such relationship. The results found that TMT faultline exhibited an inverted U-shape relationship with technological exploration only when the CEO was in the minority subgroup, and such a relationship disappeared when the CEO was in the majority subgroup.
Our study contributes to the strategic leadership literature along several avenues. First, we extend research on demographic faultlines by showing that the status difference between CEO and other TMT members changes the team dynamics and outcomes significantly, which is an important theoretical advancement to the existing TMT faultline research. While we demonstrate the effects of status difference in the TMT context, we believe that our findings have broader implications for various types of teams in which members do not have equal status.
Second, we show that the influence of TMT diversity is multi-faceted in the context of technological exploration. The diverse backgrounds of top managers may cause demographic faultlines which may influence managers' participation in team discussion, enhance team learning, and promote technological exploration. However, while TMTs can enjoy the benefits of demographic faultlines, they may also suffer from the costs of strong demographic faultlines. Therefore, TMTs need to strike a careful balance between the benefits versus the costs of faultlines.
Theory and Hypotheses
TMT and technological exploration
Technological exploration is defined as innovations that involve a shift to a different trajectory that requires a distant search and departure from a focal firm's store of current knowledge. Technological exploration is critical to the quality and impact of innovations (Ahuja & Lampert, Reference Ahuja and Lampert2001; Luo et al., Reference Luo, Lui, Liu and Zhang2016; Rosenkopf & Nerkar, Reference Rosenkopf and Nerkar2001). Exploration beyond the local boundary of knowledge neighborhood would allow the firm to access novel knowledge elements not explored before or to recombine existing knowledge elements in novel ways. Technological exploration requires more than scientists and R&D personnel (Lee, Wu, & Pao, Reference Lee, Wu and Pao2014). A firm needs to make various decisions regarding exploratory projects (Bonesso, Comacchio, & Pizzi, Reference Bonesso, Comacchio and Pizzi2011). Thus, organizational leadership becomes particularly important in terms of setting the vision for the firm, and translating vision into executable managerial decisions that activate, marshal, and channel resources into innovation projects that fit the vision (Caridi-Zahavi, Carmeli, & Arazy, Reference Caridi-Zahavi, Carmeli and Arazy2016; Chen, Tang, Jin, Xie, & Li, Reference Chen, Tang, Jin, Xie and Li2014; Heavey & Simsek, Reference Heavey and Simsek2013). In technology-intensive industries, anecdotes suggest that CEOs and other top managers are involved directly in shaping technological trajectories (Vuori & Huy, Reference Vuori and Huy2016). Many technology firm CEOs have extensive technology experience, such as Larry Page at Google, Mark Zuckerberg at Facebook, and Satya Nadella at Microsoft. Sometimes these top managers are directly involved in R&D activities – Bill Gates and Mark Zuckerberg are both reputed to be excellent programers themselves. Therefore, understanding the influence of TMTs on technological exploration is critical in technology-intensive industries.
The TMT forms a dominant coalition within the firm (Cyert & March, Reference Cyert and March1963; Hambrick & Mason, Reference Hambrick and Mason1984). As the dominant coalition, top managers are the primary decision-makers who scan the environment for threats and opportunities, make strategic choices that alter the trajectory of firms, allocate resources in the organizations, and monitor strategic formulation and implementation of a firm's operation (Prahalad & Bettis, Reference Prahalad and Bettis1986). Prahalad and Bettis (Reference Prahalad and Bettis1986) referred to how managers conceptualize the business and make critical resource allocation decisions as the managers' dominant logic. Bower (Reference Bower1972) showed that top managers influenced the strategic choices made by unit-level managers by orchestrating the organizational context of formal structure and systems. As innovations are both time-consuming and resource consuming, internal resource allocation among various innovation projects often influences the direction of the firm's innovative activities from early stages onward. The extent to which the firm engages in exploratory innovations depends on whether and how the dominant logic within the TMT is oriented toward exploratory directions.
TMT demographic faultlines
A demographic faultline is defined as a hypothetical dividing line that separates a team into relatively homogeneous subgroups based on the members' demographic alignment along multiple attributes (Bezrukova, Jehn, Zanutto, & Thatcher, Reference Bezrukova, Jehn, Zanutto and Thatcher2009; Lau & Murnighan, Reference Lau and Murnighan1998). Group faultlines represent a potential for the formation of subgroups and the acceleration of inter-subgroup conflict in a team. Faultlines allow us to investigate the effects of multiple characteristics and their interrelationships simultaneously, going beyond previous diversity research that mostly considers individuals' single characteristics.
The concept of demographic faultlines enables research regarding TMT diversity to examine multiple characteristics and their interactions within a team. Prior research on TMT diversity traditionally considered diversity indexes based on single characteristics, and the most widely examined demographic characteristics were age, tenure, education, and functional background (Bantel & Jackson, Reference Bantel and Jackson1989; Cannella, Park, & Lee, Reference Cannella, Park and Lee2008; Hambrick, Cho, & Chen, Reference Hambrick, Cho and Chen1996; Liu, Li, Hesterly, & Cannella, Reference Liu, Li, Hesterly and Cannella2012; Pitcher & Smith, Reference Pitcher and Smith2001; Wiersema & Bantel, Reference Wiersema and Bantel1992). These studies showed that TMT diversity along single-demographic characteristics influenced team processes and outcomes. However, top managers have multiple-demographic attributes on which they may differ, and the interaction of multiple-demographic characteristics can jointly influence team outcomes (Harrison & Klein, Reference Harrison and Klein2007). The demographic faultline concept addresses this limitation and offers a new lens for researchers to theorize and investigate TMT diversity by simultaneously considering multiple characteristics.
The demographic faultlines perspective does not assess the overall diversity along multiple dimensions by adding or averaging diversity indexes of single characteristics. Rather, it assesses how strongly a team breaks into subgroups based on the members' alignment along multiple-demographic characteristics (Lau & Murnighan, Reference Lau and Murnighan1998). For instance, a gender faultline exists when the TMT has both male and female managers. In this case, the TMT separates into male and female subgroups. Further, if all the male managers have technical backgrounds and all the female managers have non-technical backgrounds, the faultline will be stronger and more salient because of higher alignment of differences among subgroup members. We can keep adding new demographic attributes to see whether the alignment of these attributes strengthens the faultlines. For example, if all the male managers of this TMT were over 60 years of age and all the female managers were much younger, the divide between the two subgroups would be even stronger. In sum, the faultline perspective takes multiple-demographic attributes into account and assesses whether a team is clearly separated into distinct subgroups or not by measuring the alignment of demographic attributes among team members. This so-called alignment approach has been shown to explain more variance in team processes than traditional single-diversity indexes approaches (Lau & Murnighan, Reference Lau and Murnighan2005), and it provides a more comprehensive explanation of team processes and performance than traditional single-diversity index approaches (Bezrukova, Thatcher, & Jehn, Reference Bezrukova, Thatcher, Jehn, Behfar and Thompson2007).
Research on TMT has adopted the faultline concept, yet it has yielded conflicting evidence. Barkema and Shvyrkov (Reference Barkema and Shvyrkov2007) found that strong faultline setting in TMTs decreased the novelty of location choice of foreign expansions because the faultline could lead to behavioral disintegration – a diminishment of interaction, exchange, and collective effort among top managers (Li & Hambrick, Reference Li and Hambrick2005), as opposed to behavioral integration – the degree to which the group engages in mutual and collaborative interaction (Hambrick, Reference Hambrick1994). Further, Ndofor, Sirmon, and He (Reference Ndofor, Sirmon and He2015) investigated how TMT faultlines affected the team's utilization of firm resources to formulate competitive actions and to realize performance gains. They found that strong TMT faultlines prohibited the team from leveraging firm resources effectively and implementing competitive actions to achieve superior firm performance (Ndofor, Sirmon, & He, Reference Ndofor, Sirmon and He2015). Hutzschenreuter and Horstkotte (Reference Hutzschenreuter and Horstkotte2013), on the other hand, investigated TMTs effectiveness in product diversification and found that TMT task-related faultlines (subgroup divisions caused by different functional backgrounds of top managers) helped the TMT cope with product expansion and thus positively influenced firm performance when diversifying. Xie, Wang, and Qi (Reference Xie, Wang and Qi2015) found that TMT faultline strength was related positively to a firm's short-term performance when multiple subgroups with similar sizes existed in a team.
While adopting the faultline approach in TMT contexts advances research in the area, existing studies have not considered the unique attribute of TMTs, i.e., the status inequality between the CEO and other top managers. Neglecting the status difference of TMTs may be a possible reason for seemingly contradictory results in TMT faultlines studies. CEOs have a disproportionate or nearly dominating influence on the TMTs processes and outcomes (Hambrick, Reference Hambrick1994), and they are also increasingly influential on organizational outcomes and performance (Quigley & Hambrick, Reference Quigley and Hambrick2015). Thus, TMT faultline research should pay special attention to the CEOs. Further, the effects of TMT faultlines may be contingent upon the specific task context. This context dependence may be another reason for the inconclusive findings in TMT faultlines research. Although faultlines and subgroup divides reduce team cohesiveness and increase team conflicts, some levels of faultlines can allow a team to break away from groupthink, group conformity, and dominance by a few members. Thus, for team tasks that require creativity and information elaboration, some degree of TMT faultline may have positive effects, because it stimulates more active participation in the communication.
To address the limitations of existing TMT faultlines research, this study adds several notable nuances to the current theorization of TMT faultlines. First, we pay special attention to the role of CEO in team processes and outcomes. Following recent research on the CEO–TMT interface (Buyl, Boone, Hendriks, & Matthyssens, Reference Buyl, Boone, Hendriks and Matthyssens2011; Lin & Rababah, Reference Lin and Rababah2014), we consider the CEO as the leader of the TMT who has dominance over team processes. As the dominant leader of the team, the CEO can heavily influence the team's task outcomes depending on the subgroup to which he or she belongs. Second, in the context of technological exploration, we theorize that subgroup divides caused by faultlines may have positive effects and enhance a firm's ability to produce more exploratory innovation. We delineate our hypotheses in the following section.
TMT faultlines and technological exploration
Faultlines or the extent of internal separation of team members are driven by two separate mechanisms – social categorization (Turner, Reference Turner and Lawler1985) and informational processing (Hinsz, Tindale, & Vollrath, Reference Hinsz, Tindale and Vollrath1997). Prior research showed that stronger social categorization could cause more inter-subgroup conflicts, while more informational heterogeneity could facilitate the exchange of novel information and learning (Bezrukova et al., Reference Bezrukova, Jehn, Zanutto and Thatcher2009). When the degree of faultline is very low, the TMT is less likely to form subgroups. Teams with low or no faultlines are comprised of very similar individuals with comparable backgrounds. Top managers in such homogeneous teams are less likely to categorize themselves as very different from each other, and inter-subgroup conflicts are minimal. The information possessed by these homogeneous top managers is likely to be similar. In such teams, a narrower range of issues would be covered in discussions and information exchange would tend to be limited. As a result, internal resources are more likely to be directed to focused areas of R&D, and such dominance of a unified logic may eliminate possibilities for exploratory innovations.
A moderately divided TMTs is more likely to facilitate an environment for technological exploration. When the faultline is moderately strong, team members in both subgroups are more willing to voice their opinions if they think they have a cohort in the team (Erickson & Gratton, Reference Erickson and Gratton2007; Gibson & Vermeulen, Reference Gibson and Vermeulen2003; Stasser, Reference Stasser, Thompson, Levine and Messick1999). At a moderate level of a TMT faultline, we would expect a richer exchange of information and more discussion, whereas internal conflicts may not be too strong to hinder the effective functioning of the TMT. The healthy conflicts and competition within TMTs also mitigate the dominant R&D logic and make the resource allocation less concentrated (Kor, Reference Kor2006). Resources will be more evenly distributed among competing innovation projects, which will allow the firm to discover novel technologies in distant and unfamiliar domains. Top managers in a moderately divided team may start to experience some inter-subgroup conflicts because managers with similar demographic characteristics may categorize themselves as in-group members and others as out-group members. However, the subgroups may not be polarized because top members in different subgroups do not perceive high psychological distance and the boundary between the subgroups may not be clear. Thus, inter-subgroup conflicts do not hinder the positive effects of elaborated communication and learning during moderate level of TMT faultline.
As TMT faultline continues to increase from moderate to high levels; however, the benefits of elaborated information exchange may be outweighed by the rising costs associated with inter-subgroup conflicts. The subgroups are polarized, and members from different subgroups may experience emotional contradiction, mistrust, and dislike (Choi & Sy, Reference Choi and Sy2010). Inter-subgroup conflict may escalate into dysfunctional standoffs between the in-groups and the out-groups. Even when two divided sides have much knowledge to share and exchange, the inter-group conflicts at a high level can diminish the opportunities for such exchanges. Such potential or real division within the TMT can hinder effective decision-making for internal resource allocation. The TMT may not be functional enough to provide effective guidance for the future development of the firm's innovation pipelines. R&D projects may not benefit from any over-arching visions from the TMT, and they may just locally improve previous versions of products. Therefore, while diverse teams have advantages in carefully considering different angles of an issue and exploring more extensively, diversity also carries its costs in terms of inter-subgroup conflicts. Resolving diverse and conflicting viewpoints may require extra time and resources. The TMT may have to go through a prolonged process of internal discussions to find common grounds. In other words, a diverse team may reach better decisions, but less efficiently.Footnote 1
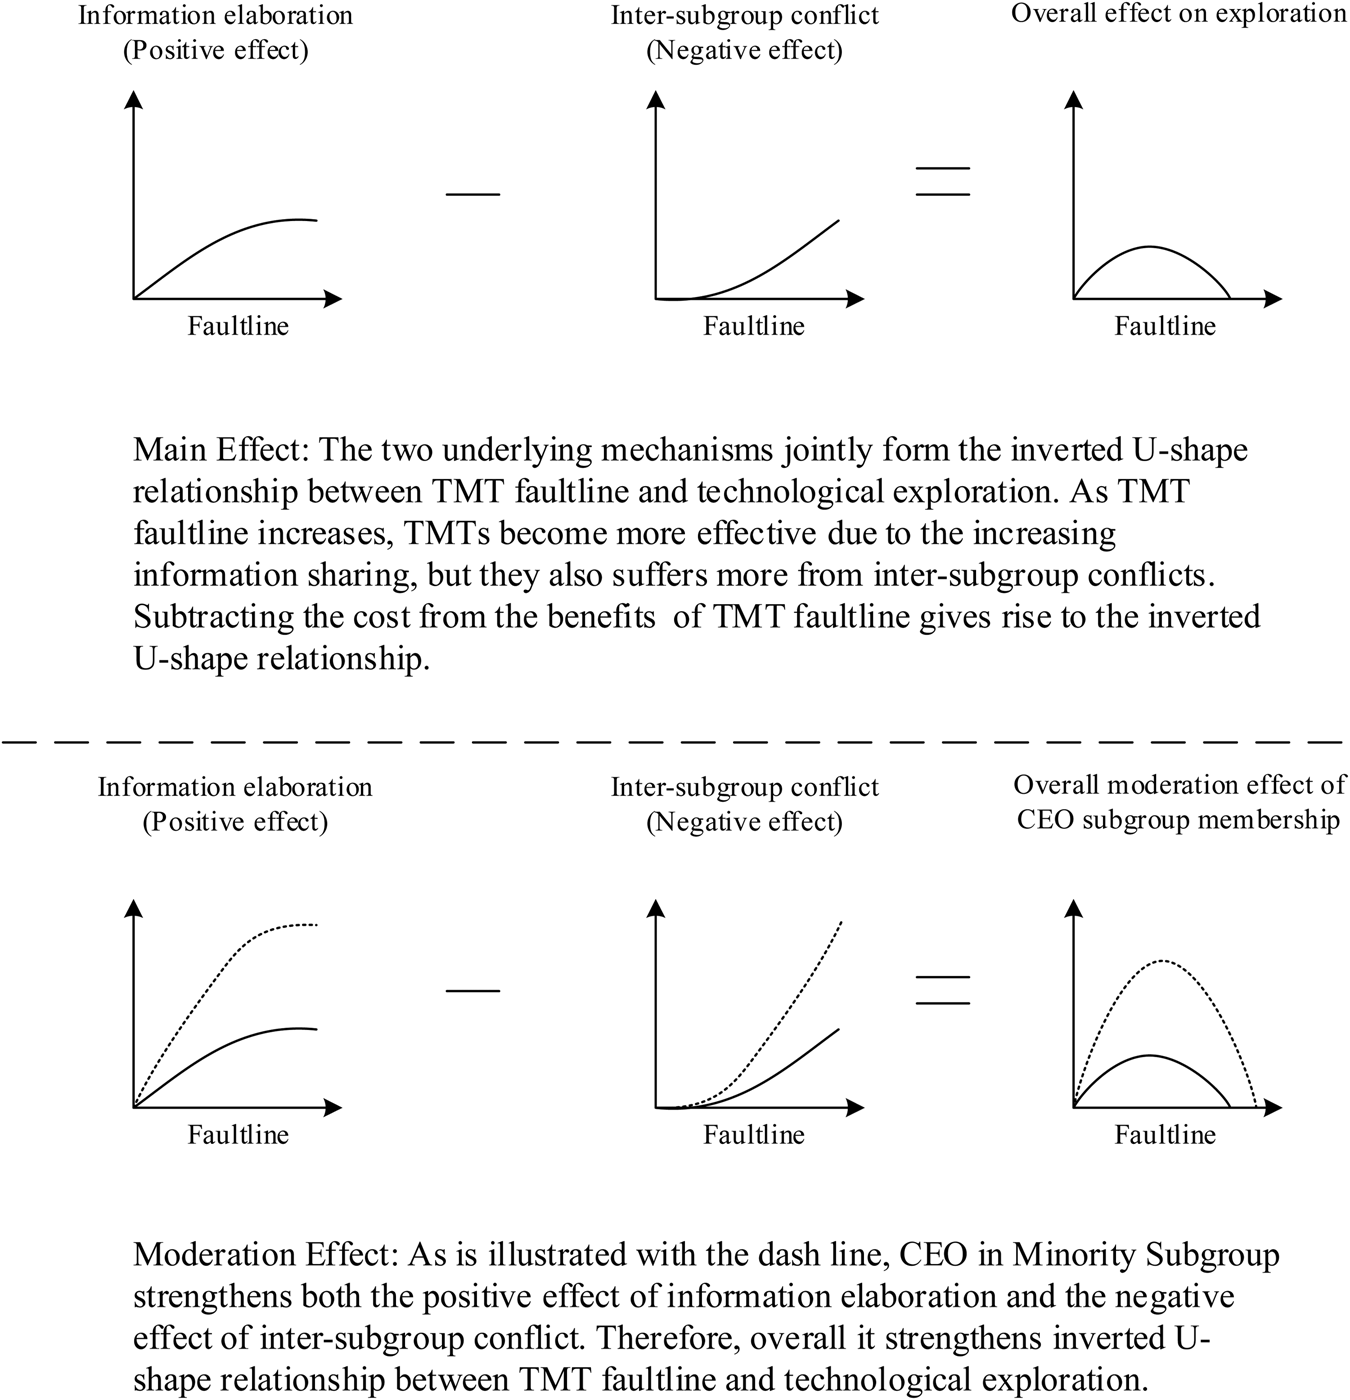
In sum, the above arguments suggest that TMT faultline has an inverted U-shape relationship with a firm's technological exploration. This inverted U-shape is formed jointly by two countervailing effects illustrated in Figure 1. As TMT faultlines increase, the TMT can benefit from the increasing information sharing, learning behaviors, and open communication. Such TMTs can process large amounts of information and effectively manage technological explorations. However, as TMT faultline further increases, the TMT also suffers more from dysfunctional inter-subgroup conflicts, which reduce behavior integration and collaboration among TMT members. These two countervailing forces jointly determine the inverted U-shape relationship between TMT faultline and technological exploration. Accordingly, we hypothesized:
Hypothesis 1: The degree of TMT faultline has an inverted U-shape relationship with the number of technological exploration.
Causal mechanisms of the inverted-U shape relationship between TMT faultline and technological exploration and moderation effects of CEO subgroup membership

Moderating effect of CEO subgroup membership
As a member of the TMT, the CEO often exerts a disproportionally stronger influence on decision-making than other members of the group (Hambrick, Reference Hambrick1994). CEOs can determine the appointment of other senior managers and company directors to the TMT (Jones, Li, & Cannella, Reference Jones, Li and Cannella2015; Papadakis & Barwise, Reference Papadakis and Barwise2002). CEOs also have a greater influence over TMT processes and outcomes (Buyl et al., Reference Buyl, Boone, Hendriks and Matthyssens2011; Lin & Rababah, Reference Lin and Rababah2014; Ling, Simsek, Lubatkin, & Veiga, Reference Ling, Simsek, Lubatkin and Veiga2008; Yucel, McMillan, & Richard, Reference Yucel, McMillan and Richard2014), and different aspects of innovation (Caridi-Zahavi, Carmeli, & Arazy, Reference Caridi-Zahavi, Carmeli and Arazy2016; Chen et al., Reference Chen, Tang, Jin, Xie and Li2014). The CEO often plays a leading role in (re)configuring dynamic managerial capabilities within the TMT (Kor, Reference Kor2006; Kor & Mesko, Reference Kor and Mesko2013). Kor (Reference Kor2006) compares a CEO with an orchestra conductor, where the CEO has the critical job of continuously orchestrating the firm's assets by utilizing his or her ability to facilitate individual and team efforts. Prior research on team faultlines has not considered the case where one individual team member stands out to influence the power dynamics and decision-making. Within a TMT where the potential formation of subgroups may cause conflicts, the CEO's position relative to the faultline becomes a neglected yet important consideration.
A CEO's membership in various subgroups alters the status difference in the TMT and influences the team's decisions. More specifically, when a TMT divides into two subgroups, three possible scenarios can arise. First, the team divides into two subgroups, with one group having more members (majority subgroup) than the other group with fewer members (minority subgroups), and the CEO is in the majority subgroup. Second, the team divides into a majority subgroup and a minority subgroup, and the CEO is in the minority subgroup. Third, it is also possible that the team divides into two groups with equal numbers of members and the CEO is in either group.
In the first scenario where the CEO is in the majority subgroup with more members, this subgroup will be dominant and powerful, and the lack of status equality and power balance will undermine the benefits of subgroup divisions. Members of the minority group will be less willing to voice their opinions or engage in debates with the majority group because the CEO is not on their side. The ideas and proposals from the majority group will be more easily assimilated into the dominant managerial logic, which will dictate internal resource allocation among competing R&D projects. The firm as a whole will commit to those projects in favor from the dominant logic of the TMT and be less interested in projects that explore different possibilities.
In the second scenario where the CEO is in the minority subgroup, the status difference between the two subgroups is reduced. Even though the minority subgroup has fewer members than the majority subgroup, having the CEO in the cohort will increase the minority subgroup's influence and give it more leverage. Senior managers in the minority group will engage in discussion and learn more actively, express opinions freely, and confront the majority group openly. On the other hand, the majority group will also have better learning effectiveness. Since there may not be a dominant logic that dictates where the future R&D resources need to be directed, the internal resource allocation will be more tolerant of projects that may deviate from existing projects and more resource will be allocated to explore technological opportunities in various ways. When the team is divided into two equally sized subgroups, the CEO becomes the deciding person, and it is similar to the case when the CEO is in the majority subgroup.
To summarize, CEO minority subgroup membership strengthens both the positive effect of information elaboration and the negative effect of inter-subgroup conflict due to an increasing degree of TMT faultline, as illustrated in Figure 1 (the dashed line). On the one hand, CEO minority subgroup membership leads to greater information exchange and sharing among TMT members. On the other hand, CEO minority subgroup membership may lead to more inter-subgroup conflicts. Overall, the net effect is that CEO minority subgroup membership strengthens the inverted U-shape relationship between TMT faultline and technological exploration; thus, we hypothesized:
Hypothesis 2: The CEO subgroup membership in subgroups moderates the effect of TMT faultline on technological exploration, such that the effect is more prominent when CEO is in the minority subgroup.
Method
Sample
We drew our sample from the US IT services industry, where technological exploration is the key driving force for competition and firm performance. The single industry design allows us to eliminate unobservable industry-level heterogeneity. The sample was drawn from Compustat and Execucomp, which provided senior managers' data. Only non-diversified firms with at least 70% of revenues from a single segment were retained in the sample. Our sample time frame was from 1995 to 2009, including both the ups and downs of this industry. We used patent data to track innovation in sample firms because firms in the service industry often competed on the basis of innovative services, not products, which made patents useful indicators for innovation. Many of the IT service firms were very active in patenting their innovations. For example, Google, within our time window of observation, owned 2,460 patents, and Microsoft over 23,000 patents. Firms with no granted patents were dropped from the sample. Finally, we dropped firms with missing values in TMT demographics attributes. After we lagged all control and independent variables by 1 year, the final analytical sample had 1,058 firm-year observations.
Measures
Technological exploration
We used the counts of exploratory patents to measure the number of technological exploration. Exploratory patents were derived from backward patent citations (Benner & Tushman, Reference Benner and Tushman2002; Phelps, Reference Phelps2010). There is a time lag (2.8 years on average) between when a patent application is filed and when it is granted (Popp, Juhl, & Johnson, Reference Popp, Juhl and Johnson2004). Therefore, this study used the patent application year rather than the patent grant year, because the application year was more proximal to a firm's innovation activities. We gathered a total of 169,788 granted patents of sample firms and constructed the measure of exploration through the following steps. First, we examined the reference list of a patent and counted new citations that previously had not been cited before by the firm. Second, a patent was classified as exploratory if it had 60% or more new citations. Finally, for each firm-year observation, the total count of exploratory patents was used as the proxy for technological exploration. We also constructed the measure using an 80% new citation cutoff (a patent was classified as exploratory if 80% or more of its backward citations were new) and obtained consistent results.
One issue with using backward citations is that patent examiners add citations to patent applications when they believe that necessary citations are missing. We were able to identify citations added by examiners for 55,202 patent applications, about a third of the total patent applications in our sample. For these 55,202 patents, we removed citations added by examiners and re-constructed our measures of technological exploration. After removing the examiner-added citations, new citations in these patents correlated at .98 with new citations including examiner-added citations. Thus, we believe that examiner-added citations did not bias our measures due to the high correlation. Additionally, including citations added by examiners actually revealed otherwise unobservable technological linkages (Agarwal, Ganco, & Ziedonis, Reference Agarwal, Ganco and Ziedonis2009). Firms may strategically omit citations to patents that are technologically close to avoid being sued for infringement (Lampe, Reference Lampe2010). Therefore, we can classify patents more accurately as exploitative or exploratory by including citations added by examiners.
TMT faultline
Following prior studies, we derived the measure of TMT faultlines along four attributes: age, organizational tenure, gender, and functional background of CEOs and TMT members. We constructed the overall TMT faultlines measure from both faultline strength and faultline distance. In other words, our measure of TMT faultline captured both the alignment within each subgroup and the distance between subgroups. The strength of faultline was measured with the algorithm developed by Thatcher, Jehn, and Zanutto (Reference Thatcher, Jehn and Zanutto2003). Specifically, the faultline strength measure was calculated with the following formula:
 $${\rm Fa}{\rm u}_g = \left({\displaystyle{{\mathop \sum \nolimits_{\,j = 1}^p \mathop \sum \nolimits_{k = 1}^2 n_k^g {( {{\bar{x}}_{.jk}-{\bar{x}}_{.j.}} ) }^2} \over {\mathop \sum \nolimits_{\,j = 1}^p \mathop \sum \nolimits_{k = 1}^2 \mathop \sum \nolimits_{i = 1}^{n_k^g } {( {x_{ijk}-{\bar{x}}_{.j.}} ) }^2}}} \right)\;; \;\quad g = 1, \;\;2, \;\ldots S$$
where  $x_{ijk}$ denote the value of the jth characteristic of the ith member of subgroup k;
 $\bar{x}_{.j.}$ denote the overall group mean of characteristics j;
 $\bar{x}_{.jk}$ denote the mean of characteristic j in subgroup k;
 $n_k^g $ denote the number of members of the kth subgroup (k = 1, 2) under split g. The faultline strength was then calculated as the maximum value of
 ${\rm Fa}{\rm u}_g$ over all possible splits g = 1, 2, … S. Essentially, this algorithm measured the strength of faultlines by calculating the percentage of total variation in overall group characteristics accounted for by the strongest group split.
The faultline distance reflected the extent to which subgroups formed across faultlines diverge, i.e., how far apart they are from each other on demographic attributes (Bezrukova et al., Reference Bezrukova, Jehn, Zanutto and Thatcher2009). The formula for faultline distance is:
 $$D_g = \sqrt {\mathop \sum \limits_{\,j = 1}^P {( {{\bar{x}}_{1j.}-{\bar{x}}_{2j.}} ) }^2} $$
where the centroid (vector of means of each variable) for subgroup  $1 = \bar{x}_{11.}, \;\;\bar{x}_{12.}, \;\;\bar{x}_{13.}, \;\;\ldots , \;\bar{x}_{1P.}$ and the centroid for subgroup
 $2 = \bar{x}_{21.}, \;\;\bar{x}_{22.}, \;\;\bar{x}_{23.}, \;\;\ldots , \;\bar{x}_{2P.}$.
Following prior studies (e.g., Bezrukova et al., Reference Bezrukova, Jehn, Zanutto and Thatcher2009; Hutzschenreuter & Horstkotte, Reference Hutzschenreuter and Horstkotte2013), we only considered faultlines that split the TMT into two subgroups comprised of at least two members in each group, because the TMT size in our sample was small (six members on average) and few teams were likely to split into more than two subgroups. We performed a principal component factor analysis on the two dimensions of the TMT faultline – strength and distance – and we created a composite score of TMT faultline using the varimax rotated factor loadings of the two dimensions (composite score = .59 × z-score of strength + .59 × z-score of distance). This overall TMT faultline score, which combines the two dimensions, was the main predictor variable.
CEO subgroup membership
We used a dichotomous variable which was coded as one if a CEO was in the smaller subgroup (the minority subgroup), and coded as zero if a CEO was in the larger subgroup (the majority subgroup). It was also coded as zero if the two subgroups were equal in size. We found only 85 cases where the two subgroups had the same number of managers, which accounted for less than 7% of the total sample size. In robustness tests, we removed these cases and the main results remained consistent.
Furthermore, it may be possible that CEOs can self-select themselves into the majority subgroup by appointing senior managers who share similar characteristics. To address this, we compared the tenure of CEOs and other senior managers in the same TMT. The data showed that when CEOs were in the majority subgroup, about 56% of CEOs had a shorter tenure than the average tenure of other senior managers; and when CEOs were in the minority subgroup, about 53% of CEOs had a shorter tenure than other senior managers. Moreover, CEOs who also served as chairperson of the board of directors (CEO–Chair duality) could have had greater influence on appointing senior managers. However, our data showed that CEO duality did not predict the likelihood of CEOs being in the majority subgroup. The above evidence alleviated the concern for CEOs self-selecting themselves into the majority subgroup.
Control variables
We controlled for some firm-level and TMT level factors. At the firm level, we included firm size, age, slack, and R&D intensity. The size of a firm was measured by the natural log of total assets. The size of a firm is an important antecedent of technological exploration, even though the direction of the relationship is still under debate (Cohen, Reference Cohen, Hall and Rosenberg2010; Revilla & Fernández, Reference Revilla and Fernández2012). The age of a firm was measured as the number of years from the founding year to the end of the sampling timeframe. Technological exploration is path-dependent so that older firms are more likely to use exploitation than exploration. Firm slack was measured as the annual working capital ratio (Finkelstein & Hambrick, Reference Finkelstein and Hambrick1990). Slack resources act as an important catalyst for research and innovation (Chen & Miller, Reference Chen and Miller2007; Greve, Reference Greve2003); thus, firm slack should have positive effects on innovation productivity. R&D intensity is the ratio of R&D expenditure to sales. This R&D intensity reflects the financial resources a company allocates to research and development and is considered a determinant of innovation performance (Wu, Levitas, & Priem, Reference Wu, Levitas and Priem2005). At the TMT level, we controlled for TMT size, average age, and average tenure. Larger TMTs have wider sets of knowledge and positively influence innovation performance (Liu et al., Reference Liu, Li, Hesterly and Cannella2012). Younger TMTs are more receptive to new information and may have better innovation performance (Wiersema & Bantel, Reference Wiersema and Bantel1992). Longer tenure TMTs have highly firm-specific human capital and may generate a higher number of technological explorations (Simsek, Reference Simsek2007).
Analysis
Because the dependent variable is a count variable, we adopted the negative binomial model, which has been widely used in management research when the outcomes were counts (e.g., Cardinal & Hatfield, Reference Cardinal and Hatfield2000; Nadkarni & Chen, Reference Nadkarni and Chen2014; Penner-Hahn & Shaver, Reference Penner-Hahn and Shaver2005). The Hausman test suggests that the coefficient estimates are systematically different between the fixed-effects and random-effects models; therefore, the fixed-effects model was used. The fixed-effect model has the additional advantage of modeling non-observable heterogeneities across firms. A 1-year lag was used for predictor variables for a stronger test of causality. For the moderation effects of CEO subgroup membership, we created the product term of TMT faultline (both strength and distance) and CEO subgroup membership and included it in the regression. We mean centered predictor variables in all models before creating product terms to minimize multicollinearity (Aiken & West, Reference Aiken and West1991). Further, we tested the moderation effect of CEO subgroup membership by using a split-sample approach, which was recommended for testing interaction effects in non-linear models (e.g., Nadkarni, Chen, & Chen, Reference Nadkarni, Chen and Chen2016; Penner-Hahn & Shaver, Reference Penner-Hahn and Shaver2005).
Results
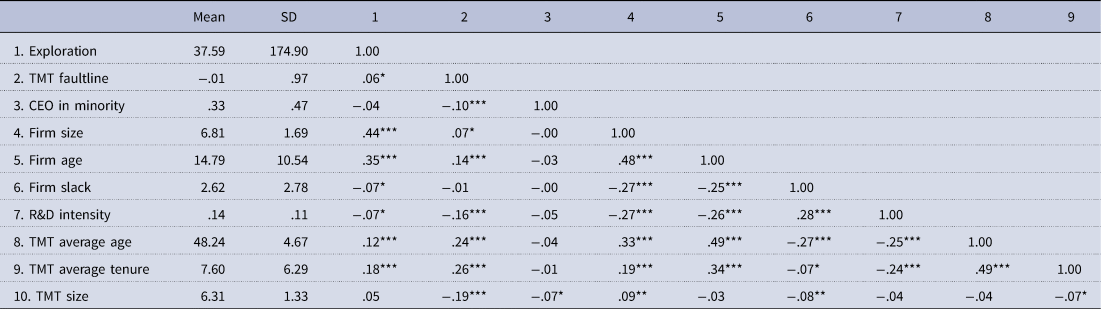
Table 1 displays means, standard deviations, and correlations among all variables. The correlation between the two main predictor variables (TMT faultline and CEO in minority) is small (see Table 1, r = −.10). We also examined variance inflation factors (VIFs) for all variables, and VIF scores ranged from 1.05 to 1.89, indicating there is little concern for multicollinearity between predictor variables and other covariates.
Descriptive statistics and correlation matrix

N = 1,200.
*p < .05; **p < .01; ***p < .001.
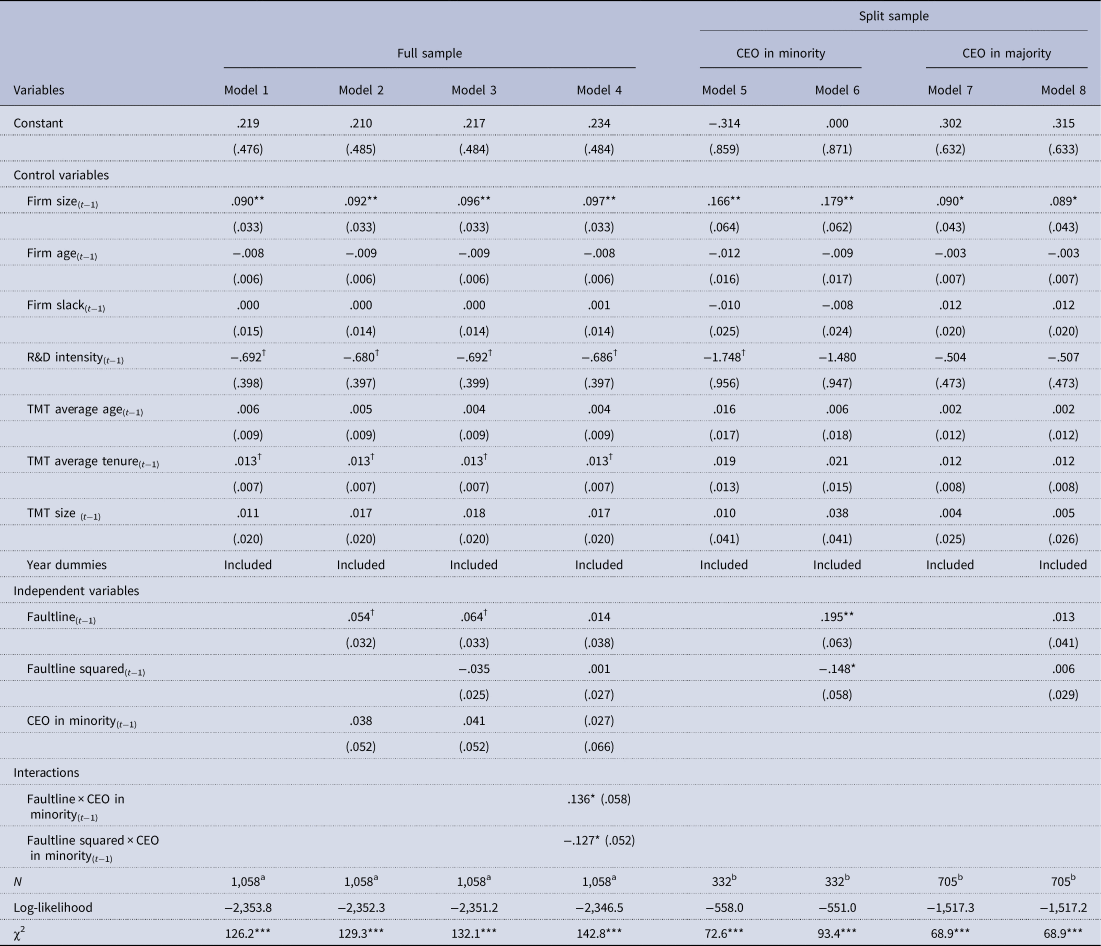
Table 2 shows the results of fixed-effects negative binomial regression testing the effects of the overall TMT faultline. Model 1 includes only control variables. Model 2 includes the linear effect of TMT faultline. Model 3 includes the curvilinear effects of TMT faultline and the results show that TMT faultline has a marginally significant positive effect on technological exploration (b = .064, p < .10) instead of the hypothesized curvilinear effect; therefore, Hypothesis 1 is not supported. Model 3 includes interaction effects between TMT faultline and CEO subgroup membership. The product term of TMT faultline and CEO subgroup membership is positive and significant (b = .136, p < .05), and the product term of TMT faultline squared and CEO subgroup membership is negative and significant (b = −.127, p < .05), indicating a possible inverted U-shape type of curvilinear effect of TMT faultline when CEO is in the minority subgroup.Footnote 2 Further, in the split-sample analyses, the results show that TMT faultline exhibits the inverted U-shape effect on technological exploration only when the CEO is in the minority subgroup, and TMT faultline is not related to technological exploration when CEO is in the majority subgroup; therefore, Hypothesis 2 receives support.
Fixed-effects negative binomial model predicting technological exploration with overall TMT faultline

a The full sample size drops from 1,200 to 1,058 after taking a 1-year lag. The CEO in minority subgroup had 406 observations and the CEO in majority subgroup had 794 observations.
b When running a fixed-effects model, the sample size of the CEO in majority sub-sample drops from 794 to 705 because (1) five firms have only one observation, and (2) one firm does not have exploratory patents.
cWhen running a fixed-effects model, the sample size of the CEO in minority sub-sample drops from 406 to 332 because (1) 15 firms have only one observation, and (2) two firms do not have exploratory patents.
†p < .10; *p < .05; **p < .01; ***p < .001; standard errors in parentheses.
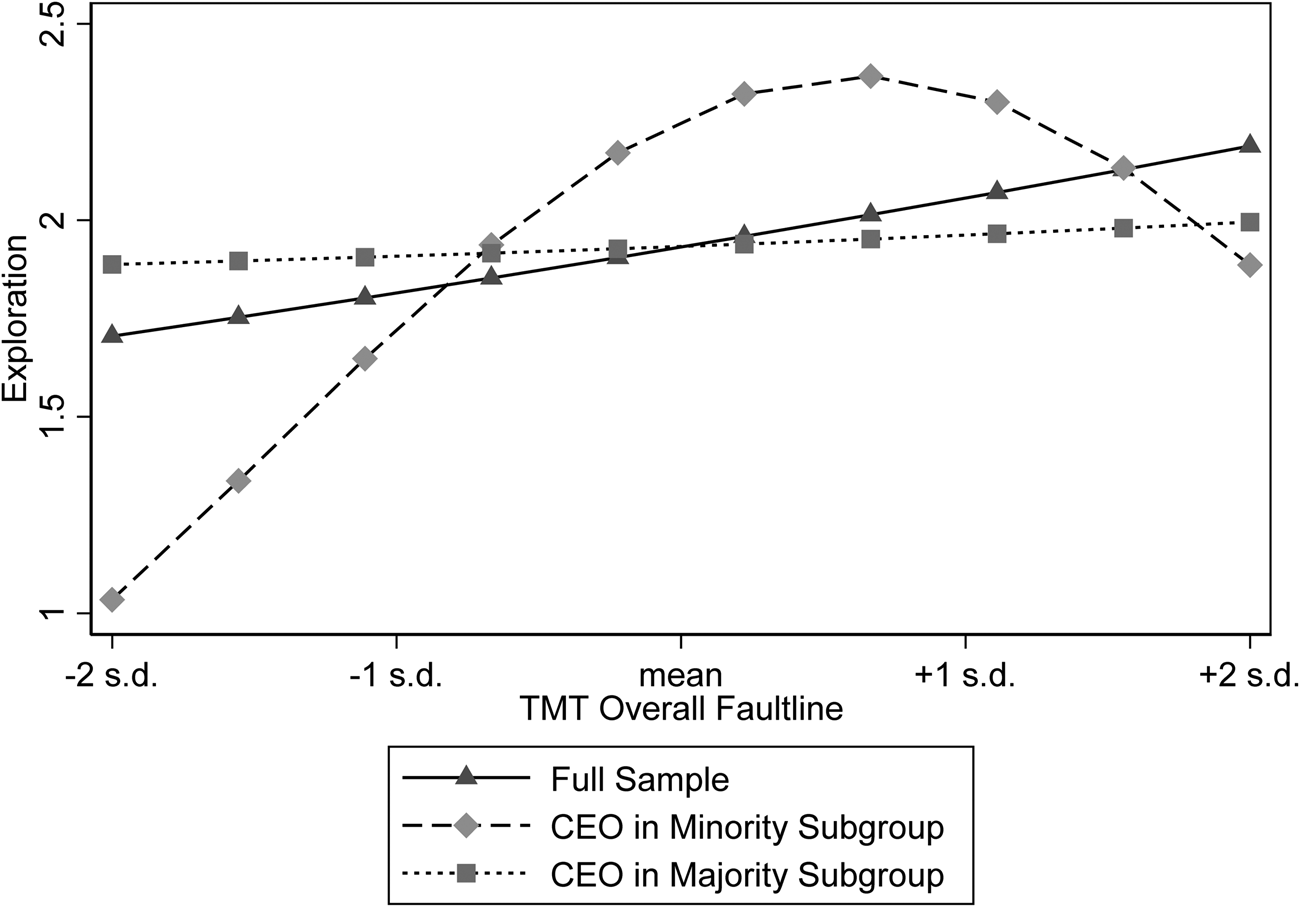
To probe further into the interaction effect, we plotted the effects in Figure 2. The figure shows that TMT faultline has an inverted U-shape relationship with technological exploration when the CEO is in the minority subgroup. Specifically, TMT faultline has a positive relationship with technological exploration when it increases from −2 standard deviations to the inflection point (TMT faultline = .65). The marginal effects analysis suggested that the expected number of technological exploration would increase by 6.1%, given one standard deviation increase in TMT faultline. However, the effect of overall TMT faultline turns negative when it continues to increase, and the marginal effects analysis suggests that the expected number of technological exploration decreases by 1.6% given a one standard deviation increase in TMT faultline (Figure 2).
Interaction between overall TMT faultline and CEO subgroup membership

To summarize, the results show that our hypotheses receives some mixed evidence. While we hypothesized an inverted U-shape main effect of TMT faultline on technological exploration, the results found that TMT faultline actually had a weak positive main effect. A plausible explanation is that the magnitude of the negative effect of inter-subgroup conflicts is not strong enough to counter the positive effect of information elaboration due to TMT faultline. Our moderation hypothesis receives some support. The results show that CEOs' subgroup membership significantly moderates the effects of TMT faultline. When the CEO is in the minority subgroup, TMT faultline exhibits an inverted U-shape relationship with technological exploration. Yet, when the CEO is in the majority subgroup, TMT faultline does not show any effects on technological exploration. To gain greater insights into the effects of TMT faultline, we conducted supplementary analyses to investigate the differential effects of faultline strength and faultline distance. Results from these analyses found that faultline strength had a positive effect on technological exploration whereas faultline distance had a curvilinear effect on technological exploration, and both effects became more pronounced when the CEO was in the minority subgroup. The complete supplementary analyses and results can be requested from the corresponding author.
Discussion
Our study showed that TMT faultline had multi-faceted effects on technological exploration. The degree of TMT faultline has an overall weak positive effect on technological exploration. Further, the study also demonstrated the importance of where a CEO is situated. When a CEO is in the majority subgroup, TMT faultline has no effect on technological exploration. However, when a CEO is in the minority subgroup, low and medium degrees of TMT faultline has a positive effect on technological exploration whereas high degrees of TMT faultlines have a negative effect on technological exploration. We believe these findings offer important theoretical contributions and managerial implications.
Contributions to theory and research
Our findings extend the theory and research in the strategic leadership area. First, our study contributes to the demographic faultlines research by integrating the concept of status inequality of group members. Originating from research on groups and teams, the demographic faultlines approach offers some unique advantages over the traditional diversity approach. In previous studies, researchers applied the demographic faultlines approach to the TMT context; however, they overlooked the fact that CEOs and other top managers did not equally influence team processes and outcomes. Due to CEOs' unique status, they play a central role in determining TMTs dynamics (Buyl et al., Reference Buyl, Boone, Hendriks and Matthyssens2011; Lin & Rababah, Reference Lin and Rababah2014). We believe that future TMT faultlines research would benefit from a careful consideration of the status inequality between the CEO and other top managers. In addition to the status disparity between CEO and other top managers, it may be useful to also consider the position of CFOs because they are commonly regarded as the second most powerful top managers (Shi, Zhang, & Hoskisson, Reference Shi, Zhang and Hoskisson2018), particularly in those contexts such as M&A where CFOs' opinions weigh heavily.
Further, status inequality is not specific for TMTs but is common among various types of teams in which one person wields more power and influence over other team members. Therefore, our findings have much broader theoretical implications for group and team research that builds upon the demographic faultlines theory. Various teams are composed of members who do not share equal status, influence, or power. For example, R&D teams are another context in which status inequality may matter because star scientists, i.e., those inventors with a significant record of accomplishments of past inventions, may dominate other team members. In such R&D teams, when the star scientist is situated with the majority subgroup, the preference of the star scientist may dominate the team's decision making and the potential benefits of team diversity may be inhibited. However, when the star inventor is situated with the minority subgroup, the team's decision-making process would be different and the effects of diversity may be more prominent. Similarly, in a job search committee at a university, members of the committee could be composed of senior faculty with tenure, junior faculty without tenure, faculty with an endowed chair, or the department chair, etc. Obviously, the faculty member with the highest status may influence the discussion process most heavily. Similar contexts could be found in audit teams, AACSB inspection team, or even a Senate Judiciary Committee. Given the prevalence of member status inequality among various groups and teams in organizations, we suggest that future research on demographic faultlines incorporate the concept of status inequality.
In addition to advancing the theory of demographic faultlines, our study also extends scholarly knowledge on the relationship between TMT demographic diversity and exploratory innovation. Prior research findings regarding this relationship are equivocal and inconclusive (Ahuja, Lampert, & Tandon, Reference Ahuja, Lampert and Tandon2008). Demographic diversity in TMTs can enhance a firm's innovation performance via the information elaboration mechanism (Hambrick, Cho, & Chen, Reference Hambrick, Cho and Chen1996) and improve the comprehensiveness and novelty of decision-making (Talke, Salomo, & Rost, Reference Talke, Salomo and Rost2010). Yet, diverse backgrounds of senior managers may also cause more conflicts and hinder innovations (Bantel & Jackson, Reference Bantel and Jackson1989; Camelo-Ordaz, García-Cruz, & Sousa-Ginel, Reference Camelo-Ordaz, García-Cruz and Sousa-Ginel2014). The demographics faultlines approach allows us to enrich this conversation by offering a novel perspective. Rather than investigating individual diversity indices, we examine the effects of subgroups caused by diverse backgrounds. We found that a potential divide of the TMT was multi-faceted. Overall, low and medium degrees of faultlines within a TMT lead to more technological exploration, especially when the CEO was situated in the minority subgroup. However, a high degree of faultline may reduce the number of exploratory innovation.
Implications for business practice
Business practitioners often advocate that TMTs should be more diverse because it is believed this will be more creative and innovative. Yet, this conventional wisdom is challenged by the findings of this study. Diversity could hurt a team's productivity in innovation when the team breaks into unbalanced subgroups. When unbalanced subgroups are present, the majority subgroup with CEO may dominate team processes, and the minority subgroup may be completely sidelined. Therefore, CEOs should be aware of their unique roles in the team, realize that subgroup divide could harm the team performance and decision-making, and take some actions to reduce such harms. For example, when initiating new projects, managers may pay more attention to status inequality in forming the team and make sure that the project leader does not dominate team decisions.
Suggestions for future research
We encourage future research to address the limitations of our study. First, our findings show that TMT faultlines influence innovation only when CEOs are in the minority subgroup, and the effect disappears completely when CEOs are in the majority subgroup. This is a rather surprising, yet interesting finding that warrants future investigation. Although we theorize that having CEOs in the minority subgroup may reduce status inequality, we need greater insights into underlying mechanisms and team processes. Quantitative analyses based on demographic data may not be able to gain such insights. Therefore, we suggest future research use a qualitative approach to probe team processes. For example, studying meeting minutes, interviewing managers, and observing team meeting and discussions. Having such insights would greatly advance our theorization on TMTs, demographic faultlines, and groups and teams research in general.
Second, we encourage future research to investigate the differential effects of diverse types of faultlines. For example, bio-related faultlines (age, gender, and ethnicity) and task-related faultline (tenure and functional background) could have opposite effects in some contexts (Hutzschenreuter & Horstkotte, Reference Hutzschenreuter and Horstkotte2013). Further, depending on the specific task and team goals, faultlines generated from different demographic attributes could exert a different degree of influence on team processes and outcomes. For example, when a team is discussing gender equality issues, gender faultline may have the strongest effect. One particularly important contextual factor is the temporal dimension. Faultlines may function differently depending on how long a team has worked together. Newly constructed teams that are only short-lived may be affected more by salient bio-demographic attributes (age, gender, ethnicity, etc.) as opposed to less-salient cognitive attributes (experience, education, value, etc.). The impact of status differences of individual members may also be higher in newer and short-lived teams than long-lived teams. Therefore, we need greater insight into the effects of different faultlines as well as how faultlines interact with contextual factors.
Third, while our study focused on the particular position and importance of the CEO in the TMT; the importance of different senior executives could vary depending on the specific tasks or problems the firm was facing. For example, in the case of M&A where the financial future of the firm is at stake, the perspective of the CFO may take on particular importance. The specific position the CFO takes relative to faultlines may also influence information exchange and decision-making within the TMT. Similarly, when it comes to technology upgrading or internal network security issues, the knowledge and perspective of the CTO also matter. Future research may build upon our study and examine how the alignment of senior executives' expertise with the specific tasks or issues of the firm may influence the effects of TMT faultlines.
Finally, using patent-based measures for technological exploration may not capture all technological exploration activities of firms in the IT services industry, even though this is a common research practice (e.g., Fosfuri, Giarratana, & Luzzi, Reference Fosfuri, Giarratana and Luzzi2008; Rothaermel & Thursby, Reference Rothaermel and Thursby2005). Innovation is a multidimensional activity, and patents only allow us to capture one aspect of the innovation. The USPTO has been relaxing the restrictive rules toward granting computer software patents (Bessen & Hunt, Reference Bessen and Hunt2007), which do not need to disclose detailed descriptions of the mechanisms (Burk & Lemley, Reference Burk and Lemley2002). As a result, software patents have experienced rapid growth in numbers. Therefore, we believe that using patent-based measures captures technological exploration to some extent. Nevertheless, we encourage researchers to use alternative innovation indicators for robustness checks.
Conclusion
In conclusion, our study extends the notion of demographic faultlines into TMT research. In particular, we showed that the status difference between the CEO and other senior managers altered the inter-subgroup dynamics. When CEOs are in the minority subgroup, TMT faultline exhibits an inverted U-shape relationship with technological exploration. Our study offers significant research implications on strategic leadership, demographics faultlines, and technological innovation; as well as important managerial implications for business practices.