Introduction
Aphids are a group of main agricultural and forest pests causing serious damage by sucking juice from host plants and transmitting plant viruses (Goggin, Reference Goggin2007). In response to attack by natural enemies, aphids release alarm pheromone to warn their conspecifics to ensure population growth (Kislow & Edwards, Reference Kislow and Edwards1972). The sesquiterpene (E)-β-farnesene (EβF) is the major component of alarm pheromone of many aphid species (Bowers et al., Reference Bowers, Nault, Webb and Dutky1972; Edwards et al., Reference Edwards, Siddall, Dunham, Uden and Kislow1973; Wientjens et al., Reference Wientjens, Lakwijk and Marel1973; Pickett & Griffiths, Reference Pickett and Griffiths1980; Xiang et al., Reference Xiang, Zhang, Fang, Kan, Zhang and Zhang2002; Francis et al., Reference Francis, Vandermoten, Verheggen, Lognay and Haubruge2005). In many plants, including Zea mays (Turlings et al., Reference Turlings, Tumlinson, Heath, Proveaux and Doolittle1991), Mentha × piperita (Crock et al., Reference Crock, Wildung and Croteau1997), Citrus junos (Maruyama et al., Reference Maruyama, Ito, Kiuchi and Honda2001), the synthesis of EβF is catalyzed by EβF synthase, which utilizes farnesyl diphosphate (FPP) as the direct substrate (Crock et al., Reference Crock, Wildung and Croteau1997; Maruyama et al., Reference Maruyama, Ito, Kiuchi and Honda2001; Picaud et al., Reference Picaud, Brodelius and Brodelius2005). It was supposed that EβF might be biosynthesized via the isoprenoid pathway in insects (Ruzicka, Reference Ruzicka1953; Vandermoten et al., Reference Vandermoten, Mescher, Francis, Haubruge and Verheggen2012). However, up to date, the sesquiterpene synthases homologous to plant EβF synthase have not been identified in the aphid, although the possibility of host plants and obligate endosymbionts as the sources for EβF biosynthesis in aphids has recently been eliminated (Sun & Li, Reference Sun and Li2017). Thus, it is most likely that the aphid synthesizes the alarm pheromone by itself.
In our laboratory, we cloned two full-length cDNAs (RpFPPS1 and RpFPPS2) coding for FPPS in the bird cherry-oat aphid Rhopalosiphum padi (Sun & Li, Reference Sun and Li2012). Recombinant expression and in vitro enzymatic activity assay showed that both FPPSs could utilize isopentenyl diphosphate (IPP) and dimethylallyl diphosphate (DMAPP) to produce FPP. Furthermore, a linked enzymatic reaction using the aphid FPPS and the EβF synthase from the peppermint Mentha × piperita produced EβF (Lewis et al., Reference Lewis, Prosser, Mohib and Field2008). Thus, it is reasonable to believe that FPPS is involved in the biosynthesis of EβF in the aphid.
Although the alarm pheromone plays important ecological roles, it is not necessarily indispensable for the development and growth of aphids; nevertheless, such a key semiochemical of aphid should impose some effects on the development of aphids in an indirect manner, since the cornicle droplets contain other chemical components than alarm pheromone (Wynn & Boudreaux, Reference Wynn and Boudreaux1972). In the pea aphid Acyrthosiphon pisum, the time and number of offspring production were both altered by droplet releasing in the pre-reproductive (3rd- or 4th-instar) nymphs (Mondor & Roitberg, Reference Mondor and Roitberg2011). On the other hand, the living environment could also modulate the release of alarm pheromone; for example, in A. pisum, the individuals living in proximity to conspecifics were more likely to emit alarm pheromone under simulated predation than the individuals living together with another aphid species (Robertson et al., Reference Robertson, Roitberg, Williamson and Senger1995). Interestingly, the rearing mode significantly affected the amount of EβF in A. pisum: the normally-reared adult aphids contained more EβF than the individually-reared ones (Verheggen et al., Reference Verheggen, Haubruge, Moraes and Mescher2009). Therefore, detecting the changes in the amount of EβF and the expression pattern of candidate genes helps establish the correlation between the biosynthesis of EβF and the responsible genes.
The amount of EβF contained in the cornicle droplets of aphids have been quantitatively analyzed under simulated conditions or under natural predation (Mondor et al., Reference Mondor, Baird, Slessor and Roitberg2000; Byers, Reference Byers2005; Schwartzberg et al., Reference Schwartzberg, Grit, Claudia, Anja, Röse, Gershenzon, Boland and Weisser2008; Joachim & Weisser, Reference Joachim and Weisser2013). However, it is still unknown when and where the aphid alarm pheromone is produced and how the production of EβF is modulated in the aphid. Here we used R. padi, an important agricultural pest insect, as a model to investigate the modulatory mechanisms of aphid alarm pheromone. A series of significant data was obtained in our studies, which sheds lights on the molecular mechanisms of EβF biosynthesis.
Method
Rearing modes of aphids
R. padi aphids, originated from a stock provided by the Wheat Insect Pests Group in Institute of Plant Protection, Chinese Academy of Agricultural Sciences, were reared on wheat plants at 19 ± 1°C under a 16L/8D photoperiod to maintain asexual reproduction in our laboratory in China Agricultural University, Beijing. Newly born aphids were individually transferred from host plants to a wheat leaf on 1.5% agar in a petri dish (Ф3.5 cm) and maintained to adult stage, defined as the individual rearing mode; meanwhile, at least 20 newly born aphids reared on wheat leaves on 1.5% agar in a Petri dish (Ф9.5 cm) (depending on different treatments) were used as the control, defined as the collective rearing mode. The wheat leaves in Petri dishes were replaced with fresh leaves every 4 days. The newly emerged adult in the 1st photophase was defined as 1-day-old adult, and its offspring produced within this period (24 h) was referred to as the 1st-instar nymph derived from 1-day-old adult; the adult reared for two photophases was defined as 2-day-old adult, and its offspring produced within this period (48 h) was referred to as 1st-instar nymph derived from 2-day-old adult. Different instars of aphids were differentiated by exuviates.
Measurement of developmental duration, weight and fecundity under different rearing modes
The developmental duration was measured as the mean period from birth to adult of 20 aphids. The weight of aphid was the mean of at least 20 adults or 100 1st-instar nymphs. Twenty adults were used for measuring fecundity (the number of offspring). Four biological replicates were performed for each experiment under the two different rearing modes: collective vs. individual.
Quantitation of EβF in adult aphids and their 1st-instar offspring under different rearing modes
R. padi adults (before reproduction) (n = 30) and 1st-instar nymphs (n = 100) derived from 1-day-old and 2-day-old adults reared under different modes were collected into 1.5-ml microcentrifuge tubes, respectively. The samples were crushed completely by using a grinding rod, and then distilled hexane (100 µl) containing decane (1 × 10⁻⁵ µl, purity >99.9%, as an internal standard for quantification) was added to the tube for extraction of EβF. After centrifugation (10,000 × g for 5 min), the supernatant was transferred to a chromatography vial for GC/MS analysis on Agilent 7890B/7200 (Agilent, USA). The GC/MS procedure was previously described by Van Emden et al. (Reference van Emden, Dingley, Dewhirst, Pickett, Woodcock and Wadhams2015). Briefly, the GC oven temperature was maintained at 30°C for 1 min after sample injection, and then raised to 150°C at a rate of 5°C min−1, and further to 250°C at 10°C min−1 (held for 21 min). The quantity of EβF was estimated based on the peak area ratio of EβF to decane. Three biological replicates were performed for each treatment.
Quantitative analysis of FPPS gene expression in adult aphids and their 1st-instar offspring under different rearing modes
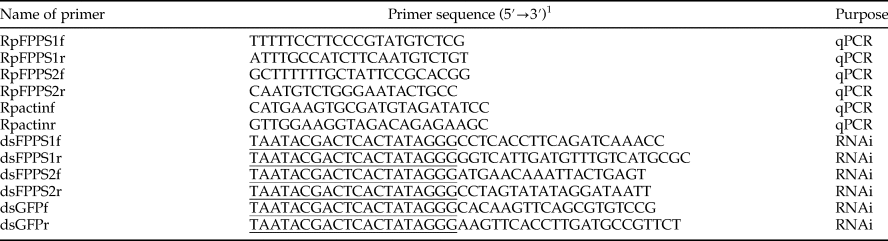
Adult aphids (n = 30) and the 1st-instar nymphs derived from 1-day-old and 2-day-old adult (n = 100) reared under different modes were collected into 1.5-ml microcentrifuge tubes, respectively. Total RNA was extracted by using Trizol reagent (Invitrogen, Carlsbad, CA, USA) following the manufacturer's instructions. The quantity and quality of total RNA were assessed using a NanoDrop ND-1000 (NanoDrop, Wilmington, DE, USA). Total RNA was treated with DNase before first-strand cDNA synthesis by using the HiScript II qRT superMix IIa (Vazyme, Beijing, China). The primers for quantitative polymerase chain reaction (qPCR) were designed according to the sequences of R. padi FPPSs (GenBank acc. nos. HQ850372, HQ850373) (table 1). Rpactin was chosen as the reference gene (KJ612090) based on its stability in different tissues. The SYBR Green Master Mix (Vazyme, China) was used for qPCR reaction (a final volume of 20 µl) on an Applied Biosystems 7500 Fast Real-Time PCR System. The PCR protocol consisted of pre-denaturation at 95°C for 3 min, followed by 40 cycles of 95°C for 15 s and 60°C for 30 s. The relative expression levels of RpFPPS1 and RpFPPS2 were quantified by using the 2−ΔΔCt method (Livak & Schmittgen, Reference Livak and Schmittgen2001). Three biological replicates were performed for each treatment.
Primers used for qPCR and RNAi.

1 The underlined is the T7 promoter sequence.
Quantitative analysis of EβF and FPPS gene expression in embryo and newly born nymph
The mature embryos (n = 300) were dissected from collectively reared adults. The compound eyes and lipid globules of mature embryos were visible, which were used to differentiate the mature from immature embryos. The samples were dissected in 1 × PBS with a filter paper to dehydrate the embryos after dissection; the newly born nymphs (n = 100) derived from collectively reared adults were also collected. The samples were put in 1.5-ml microcentrifuge tubes, crushed and then subjected to GC-MS analysis as described above. In a parallel experiment, the relative expression levels of RpFPPS1 and RpFPPS2 in the embryo and nymph were analyzed by using the methods described above. Three biological replicates were performed for each treatment.
Quantitative analysis of EβF and FPPS gene expression in the embryos derived from 1-day-old and 2-day-old individually reared adults
Mature embryos (n = 300) were dissected in 1 × PBS from 1-day-old and 2-day-old adults under individual rearing mode, respectively. The samples were crushed in tubes and subjected to GC-MS analysis as described above. In a parallel experiment, the relative expression levels of RpFPPS1 and RpFPPS2 in the embryos derived from 1-day-old and 2-day-old adults were analyzed. Three biological replicates were performed for each treatment.
Synthesis of double-stranded (ds) RNA
The dsRNAs were synthesized by using the T7 RiboMAX™ Express RNAi System (Promega, Madison, WI, USA) according to the manufacturer's instructions. The templates for dsRNA synthesis were the recombinant plasmids containing the cDNA sequences of R. padi FPPS genes and green fluorescent protein (GFP) gene (the positive control). The primers for dsRNA synthesis contained the T7 promoter sequence at the 5′-end (table 1). The PCR program for template preparation was as follows: pre-denaturation at 95°C for 5 min, followed by 35 cycles of 95°C for 30 s, 58°C for 30 s and 72°C for 40 s, and a final extension at 72°C for 10 min. PCR products were purified before being used for dsRNA synthesis. DNase was used to remove template DNA after dsRNA synthesis. The synthesized dsRNA was purified following the instructions, and the density and purity of dsRNA were measured by a biophotometer (Eppendorf, Germany).
Effects of knockdown of FPPS genes on production of EβF
dsFPPS1 and dsFPPS2 (200 ng µl−1) were used for RNAi experiments; dsGFP was used as the control. Approximately 200 1st-instar nymphs (2-day-old) were restrained in a petri dish (Ф3.5 cm) covered with two layers of parafilm containing dsRNA in 300 µl 30% sucrose solution for 36 h; the aphids were transferred to wheat plants after the oral delivery of dsRNAs. At least 60 aphids were collected for analysis of the RNAi effect by qPCR at 24 h post-transfer. Once a significant RNAi effect was observed, the rest of the treated aphids were collected at 48 h after RNAi for quantitative analysis of EβF by GC-MS. Three biological replicates were performed for each treatment.
Temporal expression profiling of FPPS genes
Aphids were collected at the embryo, 1st-instar, 2nd-instar, 3rd-instar, 4th-instar and adult stages (n = 60), respectively; the relative expression levels of RpFPPS1 and RpFPPS2 were quantified at different developmental stages by using qPCR, with the expression level of RpFPPS2 in the 1st-instar nymph as the baseline. Three biological replicates were performed for each treatment.
Data analysis
Data are the means ± standard deviation (SD) of at least three biological replicates. The significance of the difference between the means was analyzed by using Wilcoxon signed rank test for paired samples and by using ANOVA and Tukey's test for multiple comparisons on SPSS version 20.0 software (SPSS Inc., Chicago IL, USA), respectively.
Results
Effects of rearing mode on the development, weight, fecundity and production of EβF
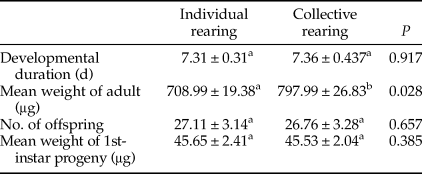
The results showed that the developmental duration, the number of offspring and mean weight of the offspring (1st-instar nymphs) were not significantly different between different rearing modes (collectively vs. individually), though the mean weight of individually reared adults was significantly greater than that of the collectively reared ones (P < 0.01) (table 2). Interestingly, the individually reared adult contained significantly less EβF than the collectively reared adult (P = 0.018) (fig. 1a). More strikingly, the 1st-instar nymph derived from 1-day-old individually reared adult contained significantly less EβF calculated as per the weight of aphid than that from 1-day-old collectively reared adult (P = 0.021), while there was no significant difference in the amount of EβF contained in the 1st-instar nymphs derived from 2-day-old adult reared under different modes (P = 0.561) (fig. 1b).
Effects of the rearing mode on development, weight and fecundity of R. padi.

The data are mean ± SD of four biological replicates with each replicate containing 20 individuals, except for weighting progenies, with each replicate containing 100 1st-instar nymphs. The significance of difference is analyzed by using Wilcoxon signed rank test: the same lowercase letter within the same row indicates no significant difference at 5% level.
Effects of the rearing mode on the quantity of EβF per mg of aphid in R. padi adults and their 1st-instar offspring under individual and collective rearing conditions. (a) Quantity of EβF per mg of adult aphid (n = 30); (b) quantity of EβF per mg of 1st-instars derived from 1-day-old or 2-day-old adults (n = 100). The data are means ± SD of three biological replicates; the significance of difference between the means is analyzed by Wilcoxon signed rank test (*, P < 0.05).

Effects of rearing mode on FPPS gene expression
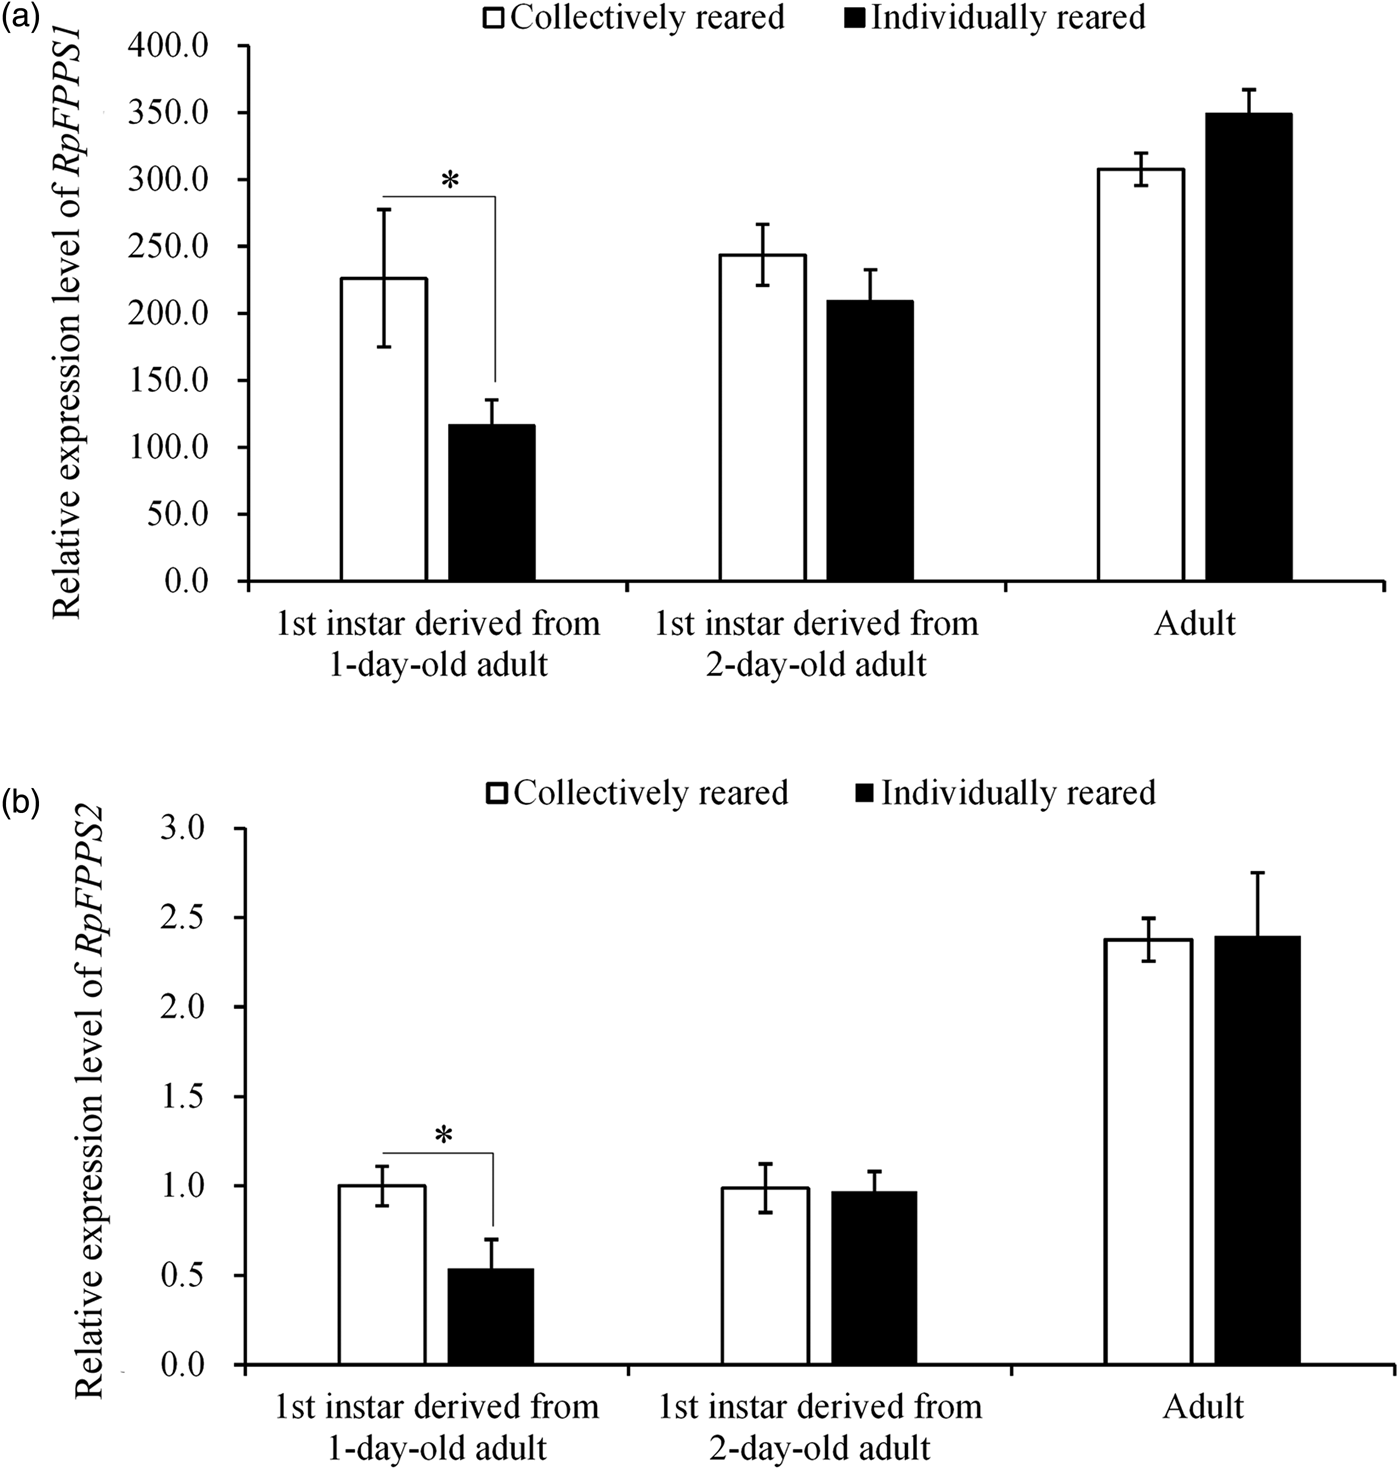
The expression levels of RpFPPS1 and RpFPPS2 were analyzed in the adult and the 1st-instar offspring derived from 1-day-old or 2-day-old adults reared under collective and individual rearing modes. The results showed that the expression level of RpFPPS1 was overall more than 200-fold higher than that of RpFPPS2 during all developmental stages examined. Moreover, the expression of both RpFPPS1 and RpFPPS2 was significantly decreased in the 1st-instar nymphs derived from 1-day-old adult under individual rearing mode (P = 0.032 and 0.044, respectively); however, there were no significant differences in the expressions of both genes in the adult and the 1st-instar nymph derived from 2-day-old adult between the two different rearing modes (P > 0.05) (fig. 2a, b).
Effects of the rearing mode on FPPS gene expression in R. padi adults (n = 30) and their 1st-instar offspring (n = 100) derived from 1-day-old or 2-day-old adults under individual and collective rearing conditions. (a) Relative expression level of RpFPPS1 in R. padi adults or the 1st-instar nymphs; (b) relative expression level of RpFPPS1 in R. padi adults or the 1st-instar nymphs. Rpactin is used as the internal control in all qPCR analyses. The data are means ± SD of three biological replicates; the significance of difference between the means is analyzed by Wilcoxon signed rank test (*, P < 0.05).

Quantity of EβF and expression level of FPPS genes in embryo and newly born nymph
It was known that the newly born aphids could release cornicle droplets in response to predator or simulated attack, indicating that aphids might have begun production of EβF early in the embryo. Our results showed that EβF was produced in mature embryos, though the quantity of EβF calculated as per the weight of embryo was significantly less than that in newly born nymph (P = 0.015) (fig. 3a). Interestingly, the expression level of RpFPPS1 was significantly higher in mature embryos than in newly born nymph (P = 0.021) (fig. 3b), though the expression level of RpFPPS2 exhibited no significant difference between embryo and nymph (P = 0.279) (fig. 3c).
Quantitative analysis of EβF and FPPS gene expression in embryo (n = 300) and newly born nymph (n = 100). (a) Quantity of EβF per mg of mature embryo or newly born nymph; (b) relative expression level of RpFPPS1 in mature embryo or newly born nymph; (c) relative expression level of RpFPPS2 in mature embryo or newly born nymph. Rpactin is used as the internal control for qPCR analysis. The data are means ± SD of three biological replicates; the significance of difference between the means is analyzed by Wilcoxon signed rank test (*, P < 0.05).

Quantity of EβF and expression level of FPPS genes in the embryos derived from1-day-old and 2-day-old individually reared adults
The results showed that the quantity of EβF per mg of embryo derived from 1-day-old adult was significantly lower than that from 2-day-old adult (P = 0.017) (fig. 4a). As expected, the expression level of RpFPPS1 was significantly lower in the embryo derived from 1-day-old adult than that from 2-day-old adult (P = 0.032) (fig. 4b), but there was no significant difference in the expression level of RpFPPS2 between the embryos from different adults (P = 0.053) (fig. 4c).
Quantitative analysis of EβF and FPPS gene expression in the embryos (n = 300) derived from 1-day-old or 2-day-old individually reared adults of R. padi. (a) Quantity of EβF per mg of embryo derived from 1-day-old or 2-day-old adult; (b) relative expression level of RpFPPS1 in the embryo derived from 1-day-old or 2-day-old adult; (c) relative expression level of RpFPPS2 in the embryo derived from 1-day-old or 2-day-old adult. Rpactin is used as the internal control for qPCR analysis. The data are means ± SD of three biological replicates; the significance of difference between the means is analyzed by using Wilcoxon signed rank test (*, P < 0.05).

Effects of FPPS gene knockdown on the quantity of EβF
RNAi experiments showed that dsFPPS1 and dsFPPS2 could significantly inhibit the expression of RpFPPS1 and RpFPPS2, respectively. Specifically, dsFPPS1 significantly reduced the expression of RpFPPS1 by 44% (P = 0.028) (fig. 5a, b), while dsFPPS2 significantly reduced the expression of RpFPPS2 by as high as 82% (P = 0.012) (fig. 5c, d). The results based on GC-MS analysis showed that the quantities of EβF per mg of aphid were significantly decreased by knockdown of RpFPPS1 and RpFPPS2 by 74% and 37% (P < 0.014 and P = 0.039), respectively, indicating that knockdown of RpFPPS1 elicited a remarkably stronger inhibitory effect on EβF production than knockdown of RpFPPS2 (fig. 5e).
Effects of knockdown of RpFPPS1 and RpFPPS2 on the quantity of EβF in R. padi (n = 60). (a) RNAi-mediated inhibition of the expression of RpFPPS1 by dsFPPS1; (b) RNAi-mediated inhibition of the expression of RpFPPS2 by dsFPPS1; (c) RNAi-mediated inhibition of the expression of RpFPPS1 by dsFPPS2; (d) RNAi-mediated inhibition of the expression of RpFPPS2 by dsFPPS2; (e) effects of RNAi-mediated knockdown of RpFPPS1 or RpFPPS2 on the quantity of EβF per mg of aphid. dsGFP is used as the positive control in RNAi analysis; Rpactin is used as the internal control for qPCR analysis. The data are means ± SD of three biological replicates; the significance of differences in the average expression level and the mean quantity of EβF between different treatments is analyzed by Wilcoxon signed rank test (*, P < 0.05).

Temporal expression profiling
The temporal expression dynamics of FPPS genes was examined from embryo to adult stages, showing that the expression level of RpFPPS1 was persistently much higher (in a range of 370–460-fold higher) than that of RpFPPS2 throughout the whole developmental period in the aphid (fig. 6). The expression of RpFPPS1 exhibited a peak in embryo and then maintained a relatively stable level from the 1st-instar to adult stage, whereas RpFPPS2 had a low-level expression during the embryo and 1st-instar stages but fluctuated in its expression from the 2nd-instar to adult stage, with a bump at the 3rd-instar stage.
Temporal expression profiling of RpFPPS1 and RpFPPS2 in R. padi during different developmental stages (n = 60). Rpactin is used as the internal control for qPCR analysis. The data are means ± SD of three biological replicates. Different lowercase letters indicate a significant difference in the average expression levels of RpFPPS1 or RpFPPS2 among different stages at P = 0.05 level by using Kruskal–Wallis followed by Dunn's test.

Discussion
Our results revealed that: (i). The rearing conditions imposed no significant effects on the developmental duration, number of offspring and weight of the 1st-instar progeny, but significantly affected the weight of adult; (ii). EβF synthesis was modulated by rearing mode in a transgenerational manner; (iii). The quantity of EβF in the 1st-instars but not in the adult was modulated by FPPS; (iv). The production of EβF started at the embryo stage, which was extended to early nymphal stage and accumulate over the later developmental stage; (v). RpFPPS1 plays a pivotal role in EβF synthesis in the aphid.
The living conditions dramatically influence insect physiology, including synthesis of pheromones. For example, population density changed the release of aggregation pheromone in the confused flour beetle Tribolium confusum (Verheggen et al., Reference Verheggen, Ryne, Olsson, Arnaud, Lognay, Högberg, Persson, Haubruge and Löfstedt2007). In aphids, the release of alarm pheromone in A. pisum was affected by environmental factors: individually reared aphids secreted significantly less EβF than those reared collectively or reared individually but exposed to conspecific odors (Verheggen et al., Reference Verheggen, Haubruge, Moraes and Mescher2009). In the present study, our results showed that the body weight of individually reared adult aphid was significantly increased compared to that of collectively reared adults (hence, the quantity of EβF was calculated as per the weight of aphid to normalize the data for paired comparison); moreover, the individually reared R. padi adults contained significantly less EβF than those reared collectively. Ecologically, the alarm pheromone is used by aphids to warn their conspecifics to escape attack by the predatory natural enemies, which helps maintain the survival of their population. Under individual rearing conditions, the aphids are expected to suffer a lower risk of predation or have no conspecifics to warn, and hence, from the energy saving perspective, a lower level of alarm pheromone is expected. Our data support this expectation.
One of the interesting findings here is that the quantity of EβF in the 1st-instar offspring derived from 1-day-old individually reared adult was significantly less than that from collectively reared adult, indicating that the modulation of EβF synthesis in individually reared adults could be inherited into their offspring; more strikingly, the quantity of EβF in the nymph derived from 2-day-old adult returned to normal, which in fact supports the suggestion that EβF synthesis can be modulated by rearing mode in a transgenerational manner, as the 2-day-old adult (reared for two photophases) had actually experienced the collective rearing conditions with early nymphal offspring, while the 1-day-old adult had not. The transgenerational effect induced by environmental factors is not rare. For instance, excessive community density induced more winged morph of aphids (Lees, Reference Lees1967; Watt & Dixon, Reference Watt and Dixon1981; Müller et al., Reference Müller, Williams and Hardie2001); in M. persicae, the individuals from a colony reared on transgenic plants that produce EβF exhibited no avoidance response to EβF in their progenies (De et al., Reference De, Cheng, Summers, Raguso and Jander2010).
Even more interesting is that the expression levels of both RpFPPS1 and RpFPPS2 were significantly inhibited in the 1st-instar offspring derived from 1-day-old adult under individual rearing mode, whereas their expression levels were kept normal in the nymph derived from 2-day-old adult or in the adult. These experimental results indicate that EβF was being synthesized in the 1st-instars and the synthesis process was modulated by FPPS genes, but it is most likely that EβF was not actively synthesized in the adult. This assumption prompted us to explore the starting point of EβF production in the aphid.
Thus, we measured the quantity of EβF in embryos and compared the quantities of EβF in embryos and newly born nymphs. We found that EβF could be produced in embryos, though the amount of EβF was significantly less in embryos than in newly born nymphs. Nevertheless, the expression level of RpFPPS1 was significantly higher in embryos, while the expression of RpFPPS2 had no significant difference between embryo and nymph. These data suggest that EβF production started at the embryo stage and was extended to the early nymphal stage, which was mainly modulated by RpFPPS1. We further compared the quantities of EβF in the embryos derived from 1-day-old and 2-day-old adults, showing significantly less EβF in the embryo derived from 1-day-old adult, in concurrence with significantly lower expression level of RpFPPS1. These results confirm the pivotal role played by RpFPPS1 in EβF synthesis and the transgenerational effect imposed by environmental factors on EβF production.
The most convincing evidence was achieved by FPPS gene knockdown, in which the RNAi-mediated inhibition of RpFPPS1 or RpFPPS2 (in particular the former) could remarkably reduce the quantity of EβF, confirming the role played by FPPS in the biosynthesis of aphid alarm pheromone. Last but not the least, the temporal expression profiling of FPPS genes from embryo to adult indicated that RpFPPS1 was a dominant homologue in R. padi since it exhibited an overall higher expression level at a magnitude of 200-fold than RpFPPS1 during all developmental stages; furthermore, the expression dynamics reflected a multifaceted function of FPPS genes (not limited to EβF biosynthesis). In plants, FPPS functions to provide the precursor for EβF synthesis. In Arabidopsis thaliana, engineered FPPS initiated synthesis of EβF, which repelled M. persicae (Bhatia et al., Reference Bhatia, Maisnam, Jain, Sharma and Bhattacharya2015). In aphids, although there has been no direct evidence relating FPPS with EβF biosynthesis, our previous studies suggested that the source of EβF was most likely originated from the aphid itself (Sun & Li, Reference Sun and Li2017). As shown in the sequenced genomes of aphids (Legeai et al., Reference Legeai, Shigenobu, Gauthier, Colbourne, Rispe, Collin, Richards, Wilson, Murphy and Tagu2010; The International Aphid Genomics Consortium, 2010; Mathers et al., Reference Mathers, Chen, Kaithakottil, Legeai, Mugford, Baa-Puyoulet, Bretaudeau, Clavijo, Colella, Collin, Dalmay, Derrien, Feng, Gabaldón, Jordan, Julca, Kettles, Kowitwanich, Lavenier, Lenzi, Lopez-Gomollon, Loska, Mapleson, Maumus, Moxon, Price, Sugio, van Munster, Uzest, Waite, Jander, Tagu, Wilson, van Oosterhout, Swarbreck and Hogenhout2017), FPPS should be required for EβF biosynthesis in the aphid, as it is the only enzyme that can potentially provide the precursor for EβF biosynthesis in the terpenoid pathway of aphid. On the other hand, FPPS was also required for the biosynthesis of juvenile hormone, a sesquiterpenoid hormone regulating embryonic development in most insect species including aphids (Hardie, Reference Hardie1987; Bellés et al., Reference Bellés, Martín and Piulachs2005). Given the significant positive correlation between the quantity of EβF and the expression level of FPPS genes in the embryo (the starting point of EβF production), it is reasonable to believe that FPPS had played a pivotal role in EβF biosynthesis; similarly, an inconspicuous relation between FPPS gene expression and EβF amount during later developmental stage pointed to an unusual biosynthetic mode of alarm pheromone in R. padi. As shown here, the individually reared adult contained significantly less EβF than collectively reared adult, but the expression levels of both RpFPPS1 and RpFPPS2 were not significantly different in the adults between the two different modes (figs 1 and 2). A possible explanation for this phenomenon is that the EβF detected in the adult was mainly synthesized in embryo and early nymphs and only stored in the adult for emergency use. As reported earlier, under predatory attack, adult aphids emitted much less alarm pheromone than nymphs (Mondor et al., Reference Mondor, Baird, Slessor and Roitberg2000; Schwartzberg et al., Reference Schwartzberg, Grit, Claudia, Anja, Röse, Gershenzon, Boland and Weisser2008). This is potentially an optimal strategy for adult aphids to save energy for more important physiological functions such as reproduction.
Conclusions
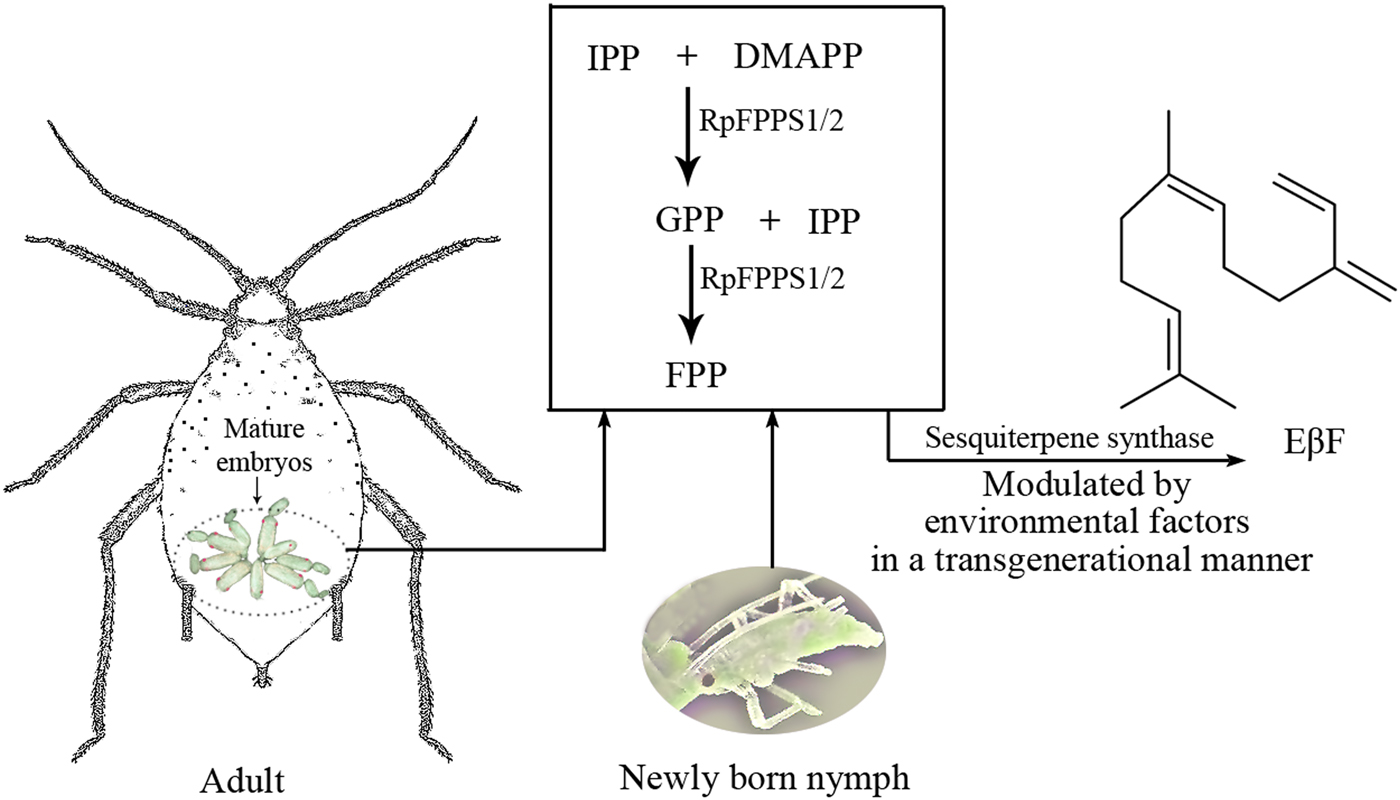
The production of EβF starts at embryo stage in R. padi, which is extended to early nymphal stage and then accumulate over the later developmental stage. EβF synthesis can be modulated by living conditions including rearing modes, and the individual rearing conditions can significantly inhibit the synthesis of EβF in a transgenerational manner in the aphid (fig. 7). Overall, RpFPPS1 plays a pivotal role in EβF synthesis in R. padi. Our data shed lights on the modulatory mechanisms of the biosynthesis of aphid alarm pheromone. The future work may be benefited from the labeling experiment, aphid homogenate analysis and optimization of the biochemical reaction conditions by using recombinant enzymes.
A hypothetical model describing when and where the production of EβF starts and how it is regulated by FPPS in the bird cherry-oat aphid R. padi. RpFPPS1 and RpFPPS2 (mainly the former) catalyze the biosynthesis of FPP (Sun & Li, Reference Sun and Li2012), the precursor for EβF synthesis, starting in mature embryo and extended to early nymphal stage. The EβF produced is stored for emergency use, and the release of EβF by aphids is modulated by environmental factors including rearing conditions.

Acknowledgements
This work is supported by the National Natural Science Foundation of China (Grant nos. 31371940 and 31772169).