1 Introduction
Benefit-cost analysis (BCA) is a valuable methodological tool for empirically analyzing the effects of large regulatory projects. Although benefit-cost analysis is not without debate concerning some of the assumptions and perspectives involved (Kelman, Reference Kelman1981; Bronsteen et al., Reference Bronsteen, Buccafusco and Masur2012), its usefulness as a tool in framing and suggesting potential effects of a project is widely understood. Benefit-cost analyses, for the most part, are done a priori or before a project is actually constructed and implemented. In medias res and ex post cost-benefit analyses, while often discussed as worthwhile, are rarely implemented. This is a shame. Ex post cost-benefit analyses of large federal projects, if done more often, could inform researchers and analysts on the accuracy of assumptions made and the usefulness of methods frequently utilized. Indeed, the Office of Management and Budget (2016) has estimated that federal-level government ex ante BCAs are conducted every year, affecting all agencies of government and spending that reaches into the billions of dollars. A better understanding of their accuracy would be useful.
In addition, dam removal, or at least a reassessment of hydroelectric dam utilization and valuation, is a growing area of study (Loomis, Reference Loomis1996, Reference Loomis2002; Pohl, Reference Pohl2002; Kotchen et al., Reference Kotchen, Moore, Lupi and Rutherford2006; Lewis et al., Reference Lewis, Bohlen and Wilson2008; Provencher et al., Reference Provencher, Sarakinos and Meyer2008; Robbins & Lewis, Reference Robbins and Lewis2008; McKean et al., Reference McKean, Johnson and Taylor2010, Reference McKean, Johnson and Taylor2012; Null et al., Reference Null, Medellin-Azuara , Escriva-Bou , Lent and Lund2014). There are an increasing number of analyses looking into particular aspects of dam valuation and impact; however, few of these papers investigate the benefits and costs of hydropower dams in a comprehensive fashion. One noteworthy, if rather old, exception to this is a study of the Colorado-Big Thompson Project from the 1980s (Howe, Reference Howe1987), which analyzes the project from both regional and national perspectives. This current study of the Elwha River Restoration Project provides a rare, comprehensive ex post benefit-cost analysis of complete dam removal.
For the most part, we find that the initial benefit-cost analysis was carefully and correctly prepared and arrived at a proper recommendation. However, in the ensuing decades from that initial analysis to implementation of the project and preparation of this ex post analysis, the expanding scope of the project has led to increasing costs. Unanticipated problems have delayed or diminished some of the benefits and at least two new valuation paradigms have contributed to changes in how the project’s benefits might be viewed and valued. This highlights the difficulty in doing an ex ante cost-benefit analysis. Still, in this ex post analysis, we find as with the original analysis that the removal of the Elwha project dams led to large net benefits overall.
2 Background on the Elwha River Restoration Project
The Elwha River Project consists of two dams, the Elwha dam and the Glines Canyon dam, on the Elwha River in the state of Washington. The Elwha dam was constructed between 1910 and 1913, without any kind of fish passage facilities. The Glines Canyon dam was constructed between 1925 and 1927, also without any fish passage facilities. The two, historically privately owned dams, had a combined capacity of 18.7 MW and generated an average of 172 GWh of electricity annually, most of which was sold to a nearby pulp and paper mill.
The two dams were not without controversy from the start; before construction even began in 1910, the Washington State Fish Commissioner contacted the original owner of the project about legal requirements to provide passage for migrating fish. Unfortunately, the owner did not respond. Both dams were constructed without fish passage facilities (or a fish hatchery, a proposed compromise at the time), and together they blocked anadromous fish passage to more than 70 miles of the Elwha River and its tributaries. A number of native Elwha River anadromous fish runs, including spring and summer chinook, coho, pink, chum, and sockeye salmon, winter and summer steelhead, cutthroat trout, and native char, were severely diminished and the natural ecosystem was disrupted within a significant part of the Olympic National Park. Native American tribes that relied on these fish runs were especially affected including not just diminished fish passage, but blocked access to traditional fishing sites and cultural properties.
When the dams came up for licensing by the federal government in the 1980s, Footnote 1 the contentiousness of the situation among the dam owner, environmental interest groups, Native American tribes, and other stakeholders threatened to delay any sort of negotiated outcome for a long period of time (Gowan et al., Reference Gowan, Stephenson and Shabman2006). Attempts to move the situation forward led to litigation and protracted expenses for all stakeholders involved. To resolve the situation, in a unique outcome historically for private dam management, Congress stepped in and passed a legislative settlement applicable to the Elwha River Project alone. The Elwha River Ecosystem and Fisheries Restoration Act was signed into law as Public Law 102-495 by President Bush in 1992.Footnote 2 The goal of this act was the “full restoration of The Elwha River Ecosystem and native anadromous fisheries.” The Secretary of the Interior was authorized to acquire the dams and remove them if necessary to meet this stated goal. The Interior was first tasked with developing a benefit-cost analysis on dam removal or other alternatives (such as installation of fish passages, or removal of one dam but not the other) that would fulfill the stated goal. That benefit-cost analysis (Meyer & Lichtkoppler, Reference Meyer and Lichtkoppler1995)Footnote 3 was provided to Congress in 1995 and is the basis for this article’s comparative research study.
3 The original benefit-cost analysis
The original benefit-cost analysis considered several options for the Elwha River Project including removal of only the Elwha River dam, removal of only the Glines Canyon dam, the installation of fish passage facilities, or the removal of both the Elwha River and the Glines Canyon dams. The removal of both dams yielded the greatest net benefits and was the option actually implemented. The original benefit-cost analysis envisioned removal beginning in 1996 or 1997, taking 4 years, and involving investments and ongoing expenditures on water quality and sediment management during and shortly after the project. The time horizon for the original analysis was 100 years.
The original analysis provides an unusually good discussion of discounting and consideration of different rates of time preference. The rates at which future benefits and costs are discounted ranges from 0 to 7% (with a sensitivity analysis) and there is even mention of intergenerational impacts and the dramatic effect of discounting on their present value.Footnote 4
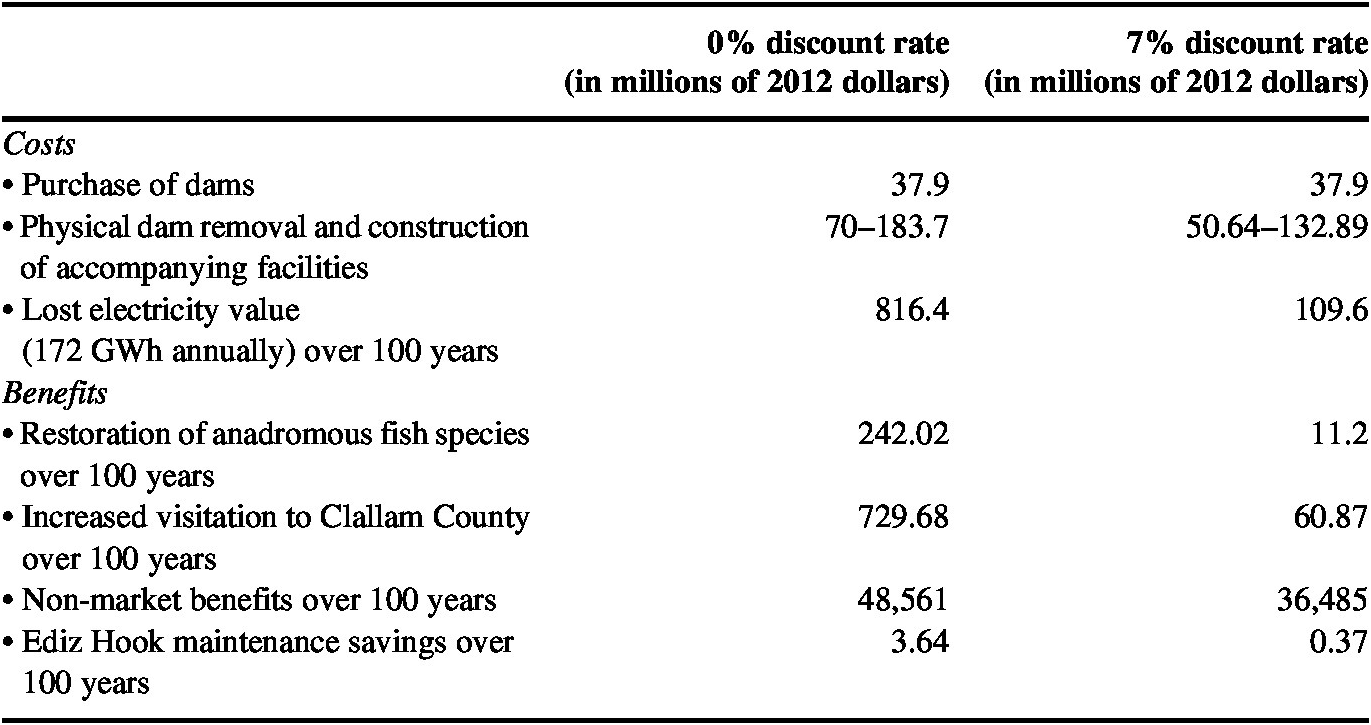
After purchase of the dams for $29.5M, Footnote 5 $37.9M in 2012 dollars, the two primary costs of the dam removal are the cost of their physical removal and the cost of construction of accompanying facilities to support water quality and sediment control, hatcheries to increase the number of spawning fish, new flood control infrastructure, and the cost of the foregone electricity generation.
The 1995 estimates of the cost of physical removal, construction, and related costs varied considerably. Meyer and Lichtkoppler (Reference Meyer and Lichtkoppler1995, p. 36) state, “The present analysis assumes total cost benchmarks of $130 million, $70 million and $50 million, all excluding costs of $29.5 million to acquire the existing dams.” Elsewhere (p. 46) they say, “Total project construction costs are scaled at $155 million, $100 million and $80 million respectively – inclusive of $29.5 million for project acquisition,” although Department of the Interior et al. (1994) put this at $161.08M, including acquisition cost, in the table (table 15, p. 140) to which Meyer and Lichtkoppler refer. The widest possible range seems to be between $50M and $161.08M, excluding acquisition costs.Footnote 6 Adjusting to 2012 dollars, these estimates rise from $70M to $183.7M.Footnote 7 The distribution of these costs over the project timeline is given in Department of the Interior et al. (1994), table 15, p. 40). Distributed over the timeline, the present value of the low and high estimates ranges from $70M, $183.7M when discounted at 0% to $50.64M, $132.89M when discounted at 7%.
The dams produced an average of 172 GWh of electricity annually. The 1995 analysis used a combination of local and regional power costs to assign this electricity an initial value of about $0.0337 kWh−1 and a resulting total value of $5.8M.Footnote 8 However, this includes an assumption that real electricity prices would increase by 2% annually until 2014 and then remain constant thereafter.Footnote 9 The present value of this foregone electricity over 100 years ranges from $109.6M if discounted at 7% to $816.4M if discounted at a rate of 0%.Footnote 10
Restoration of anadromous fish species to the Elwha River was the primary motivation behind removal of the dams and is the first benefit discussed in the original analysis. Projected annual harvests for chinook, coho, pink, chum, and sockeye salmon and for steelhead are presented in the article. Although fish harvests would be suspended during dam removal, harvests were projected to restart anywhere from project year 3 for sockeye salmon to project year 6 for chinook salmon.Footnote 11 Harvests of all species were forecast to increase annually, growing steadily to long run equilibria 20–25 years after the start of project decommissioning. When fully recovered, the net value of the increased fish harvest to commercial fishers (both tribal and non-tribal) and to firms providing services to sport fishers is estimated in the original analysis at $3.66M, of which $3.16M accrues to commercial fishers and $0.50M accrues to sport fishers.Footnote 12 The present value of these commercial and sport fishing benefits over 100 years ranges from $212.61M and $29.41M if discounted at 0% to $10.26M and $0.94M if discounted at 7%. Distribution of this net value varies over time with sport fishing benefits occurring later than commercial fishing benefits. The implication is that the share of the benefits accruing to commercial fishers is smaller when discounting at a lower interest rate.Footnote 13 The recreational value of the opening of this river to sport fishers is not specifically included in this part of the analysis, but it might be seen as part of either the non-market benefits associated with increased visitation or the non-market benefits captured in the contingent valuation analysis to be described below.
In addition to fishing, it was assumed that dam removal would result in increased visitation to Olympic National Park and to Clallam County more generally. The authors acknowledge that realization of these benefits would not be immediate, saying, “(Recreation and tourism) benefits are assumed to be zero for the first six years of project life, and are then assumed to increase in 10 even increments to the benefit levels displayed in Section V.”Footnote 14 The net value of this increased tourism to local service providers was estimated at $8.0M annually.Footnote 15 The present value of this benefit stream is $729.68M when discounted at 0% and $60.87M when discounted at 7%.
Non-market benefits generate nearly all of the benefits described in the original analysis, typically more than 98% of all claimed benefits from dam removal. Although it is certainly interesting to review and critique other parts of the analysis, non-market benefits constitute the greatest influence in this analysis overall. The non-market benefits used in the original analysis are from a paper subsequently published by Loomis (Reference Loomis1996), which estimates mean annual willingness-to-pay (WTP) over 10 years for Elwha River restoration at $59 per household in Clallam County (the county in which the dams were located), $73 per household in the rest of the state of Washington, and $68 per household in the rest of the USA.Footnote 16 All future benefits from the project are assumed to be capitalized in the 10 years of payments described in the study.Footnote 17 The annual WTP on the part of all U.S. households for the Elwha Dams’ removal was $6275.2M, although Loomis also reports a reduced mean value based on the assumption that all non-response values were zero of $3469.4M, or, in 2012 dollars, $8763.6M and $4845.2M, respectively. The present value of the reduced mean over 10 years ranges from $36,485M to $48,561M in 2012 dollars, depending on discounting. For the summary presented below, we will use the (conservative) reduced mean value.
Finally, damming the Elwha River greatly reduced sediment delivery to Ediz Hook, a spit of sand and other sediment that provides the only protection for Port Angeles harbor.Footnote 18 The combination of damming and antierosion efforts on sea cliffs around Port Angeles had led to the U.S. Army Corps of Engineers doing regular maintenance to preserve Ediz Hook. Removing the dams was projected to restore sediment delivery to the spit beginning in year 8 of the project, and reduce annual preservation expenditures by $39,103 in 2012 dollars.
Table 1 summarizes the benefit-cost information from the original analysis.
Original benefit-cost analysis – summary.

Depending on whether high or low cost removal and construction assumptions are used, and the assumed discounting rate, the benefit-cost ratio from the original analysis ranges from 47.72 to 184.50, and the net present value (NPV) from $36,277M to $48,612M, in 2012 dollars.
Increasing the discounting rate reduces the project’s NPV but, counter-intuitively, increases the benefit-cost ratio, a result of the far greater magnitude of the project’s benefits compared with its costs.
Note that the numerical results we have calculated above differ from those in the original report. The original report yielded values for costs ranging from $664.6M to $739.9M at 0% discounting and from $138.2M to $195.6M at 7%, and benefits of $36,634M at 0% and $25,246.0M at 7%, Footnote 19 resulting in the following 2012$ NPV and benefit-cost ratio figures:
Although we were unable to perfectly replicate the results of the original study, our NPV and B/C figures closely approximate those from the original study.
4 Methodological issues with the original benefit-cost analysis
Overall, the original analysis was properly conducted and the authors should be commended for a fine report. The authors considered four approaches to restoration, making this a comprehensive investigation of the problem rather than just a single solution. The descriptions and derivations of the costs and benefits of the dam removal project were thoroughly discussed. Sensitivity of the analysis to different discount rates was well presented. With the benefit of over two decades of development of the theory and practice of benefit-cost analysis, however, several areas of critique arise. Among these are the price of acquiring the dams and whether it is properly considered a cost of the project, the time frames for the analysis and the assumptions inherent in those time frames, whether or not local tourism activity should be counted as a project benefit, and the lack of consideration of externalities associated with the alternatives for electrical generation.
The original benefit-cost analysis included the $29.5M purchase price of the dams as a cost. The correct treatment of this amount in an analysis depends on whether the owner of the dams to whom the payment is made has standing. Payment for the dams was made to the Fort James Corporation in 2001 (Clark, Reference Clark2012). The Fort James Corporation had been acquired by Georgia Pacific in 2000.Footnote 20 If standing is universal, the purchase price is merely a transfer, but because the dam removal was a federal government project, standing might be national. According to the Office of Management and Budget’s Circular A-94, “Analyses should focus on benefits and costs accruing to the citizens of the United States in determining net present value,” raising the question of either the corporation’s or the shareholders’ nationality (Office of Management and Budget, 1992). If the corporation or its shareholders are American, even with national standing, the purchase price should be considered a transfer. A different point of view might be that standing is limited to the U.S. government and its various departments and agencies, in which case the price of the dams would be a cost.
Ultimately, if the owners of Fort James and Georgia Pacific have standing, then the $29.5M payment should be treated as a transfer from taxpayers to owners, and should not be considered a cost of the project.
Alternatively, there were several legal issues with the dam’s existence and continued operation. The Elwha Dam was built without provisions for fish migration, a violation of Washington State laws. Both dams operated within Olympic National Park, and while this was not illegal at the time, new dams would not be permitted within a national park today and, at some point, renewal of these dams’ operating permits would likely have become challenging. If the dam’s construction and operation were in violation of state or federal laws, then the owners may be considered not to have standing and payments to them should be considered costs of the project. Indeed, one reason that James River, who owned the dams prior to Fort James’ ownership, investigated options for transfer to the federal government was a concern that the dams might be taken from him in some way anyway. If the dam owner’s standing is in doubt then payment for the dams should be counted as a cost.
A final argument for including the $29.5M purchase price of the dams as a cost in the analysis is that the land being used for the project has an opportunity cost.Footnote 21 The $29.5M could therefore be considered as a valuation of the land’s opportunity cost. Ultimately, it is not unequivocal whether or not to include the $29.5M governmental payout for the dams as a cost in the ex post benefit-cost analysis, but for conservative estimates, we have decided to include it.
The time horizon for the original study is complex. The decommissioning timeline encompasses a total of 17 years (eq. 1, p. 46) and reflects the presentation in an illustration from the Elwha Report.Footnote 22 Dam removal in this timeline begins in the fourth year of the project after some research and preliminary work on design, habitat and water quality preservation, and fish and habitat restoration has begun. Presumably, there would not be lost generation prior to dam removal. The cost of the foregone electricity generation is calculated over 100 years (eq. 2, p. 46), but this is inconsistent with the discussion in some supporting reports. The Federal Energy Regulatory Commission (1993) Draft Staff Report refers to a 30-year anticipated licensing term.Footnote 23 Department of the Interior et al. discuss the cost of replacement power from 1996 to 2025, suggesting a 30-year time frame, and also includes analysis using a 50-year time frame.Footnote 24 The 100-year time frame suggests that generation would have continued at the facilities until they were nearly 200 years old. Although it may be possible that the generating hardware could continue operating that long, at some point either basic structural failure or, more likely, silt accumulations in the associated reservoirs would likely become a limiting factor. Fishery and increased tourism benefits are also calculated over 100 years (eqs. 3–6, pp. 47–49).
The time horizon used by Loomis (Reference Loomis1996), which serves as the foundation for most of the benefits of the removal, is particularly interesting. In the Loomis contingent valuation (CV) study, respondents are asked about their WTP on an annual basis for the dams’ removal and the river’s restoration, but only for 10 years, approximating the duration of the decommissioning project.Footnote 25 This makes for a credible scenario for the respondents; each household’s payments over the course of the decommissioning project provide for the removal, which in turn results in the existence of a free-flowing river for the foreseeable future. The Elwha project analysis uses values from the Loomis report, saying, “These values apply each year for the first 10 years of the project. Since they ‘capitalize’ value over all future years, no project total non-market values should be counted subsequent to this 10 year period.” Although this seems an appropriate and conservative use of the Loomis results, the published version of the Loomis paper does not discuss capitalization of the annual WTP values in this way. The time frame over which respondents might have been capitalizing values is not clear, and may have been in perpetuity, for 100 years, or for a shorter period of time. If respondents were valuing benefits over a shorter period of time, the Loomis values would be conservative relative to what the non-market values might be if applied over the 100-year time frame used in most of the paper.
Hypothetical bias is a concern with any contingent valuation study. In the years since the Loomis study, advances have been made in estimating and correcting for this bias and better calibrating values estimated from CV studies with those arrived at by other means such as through travel cost studies or experimental observations of actual WTP. Meta-analyses conducted by List and Gallet (Reference List and Gallet2001) and by Little and Berrens (Reference Little and Berrens2004) suggest that mean calibration factors, the ratio between a CV estimation and an estimation from another technique, have an approximate value of three.
One calibration approach is to ask positive respondents a follow-up question to determine their level of certainty about their WTP, with results suggesting that including only those with a high degree of certainty yields CV valuations that best approximate valuations calculated by other techniques (Champ & Bishop, Reference Champ and Bishop2001; Blomquist et al., Reference Blomquist, Blumenschein and Johannesson2009; Rhodes et al., Reference Rhodes , Whitehead, Smith and Denson2018).Footnote 26 Blomquist et al. look at WTP estimates for three medical interventions that respondents were first asked about in a CV context, and were then given the option to purchase.
Elimination of all but the most certain yesses (positive respondents) lowered mean WTP from $38.90 to $17.36 for a diabetes management program, from $33.24 to $9.69 for an asthma management program, and from $27.87 to $21.76 for a lipid management program, values that are roughly one half, a third, and three quarters of the maximum values and none of which demonstrated significant hypothetical bias when compared with actual WTP. Champ and Bishop look at WTP for wind power and find that when the yesses are limited to those with certainty rating of 8 or higher on a 10-point scale, approximately half of the yesses are removed with a corresponding 50% reduction in mean WTP.
Applying these more recent insights into hypothetical bias and contingent valuation, we can offer a sensitivity analysis of the Loomis study, remembering that the best estimate of the non-market benefits was $6.275B, but if all non-respondents were assumed to attach zero value to the project (perhaps analogous to excluding yesses with low levels of certainty) this figure fell to $3.47B.Footnote 27 If this lower value, based only on survey respondents, were subject to a certainty filter similar to those described above, we might arrive at a value that is one-third to one half of the original, perhaps between $1.15B and $1.73B, consistent with the assumption that all non-respondents attach no value to the project (perhaps explaining why they did not respond) and that only a fraction of those who chose to respond would actually be willing to pay, were they given the opportunity. Even under this very conservative correction for hypothetical bias, the benefits of the removal project would still overwhelm the costs. As shown in Table 2, the NPV of the project is approximately $48B discounting at 0% and $36B discounting at 7%. Reduction of the non-market benefits to a third of their value would still leave the project with NPVs in the range of $11.95B–$16.24B and benefit-cost ratios ranging from 16.53 to 61.74.Footnote 28
NPV and benefit-cost ratios as calculated above.

The original study included increased visitation to Clallam County as a benefit of the dam removal and river restoration. Specifically, both increased net revenues for local tourism service providers and total WTP on the part of additional visitors were included as benefits. This presents at least a couple of challenges. Including both visitors’ WTP and providers’ profits double counts those profits, and a better measure of this benefit would be the sum of additional visitors’ consumer surplus and providers’ profits. More importantly, however, it is likely that most of the additional visitation to Clallam County would come at the expense of visitation to other natural areas in the USA. If standing in the study is national, then most of the additional tourism revenue that accrues to Clallam County would represent a transfer from elsewhere in the USA, and be neither a cost nor a benefit.
The original analysis was thorough in its description of the importance of the Elwha River and fishing on the Lower Elwha S’Kallam Tribe, and this was also discussed in Department of the Interior et al. (1994) as, “The removal of both dams represents the only possible opportunity to fully restore the native anadromous fisheries, which are the Elwha S’Kallam Tribe’s most valuable economic and cultural resource.”Footnote 29 The Federal Energy Regulatory Commission (1993) echoes these sentiments, saying, “The Klallam have repeatedly stressed the importance of the river and its resources, particularly the anadromous fish resource, as the most significant single aspect of their cultural identity… To the Klallam, restoration of the anadromous fishery in the Elwha and shellfish populations at its mouth would represent a partial restoration of Klallam culture and a restoration of their fish harvest rights…”Footnote 30 Although the authors of all three of these reports were responsible in their acknowledgement of this aspect of the project, no attempt seems to have been made to explicitly value the potential for cultural restoration. Admittedly, this is, even now, a nascent concept in benefit-cost analysis and, to the authors’ knowledge, has not been explicitly attempted. This would, however, be an important source of additional benefits if measured, or if that is not possible because of cultural sensitivities, unmeasured but acknowledged.
The original analysis failed to acknowledge the issue of the excess burden of taxation associated with the project’s costs. As has been established in the economics literature, taxes distort behavior to different degrees and, as a result, impose net costs on an economy rather than serving simply as transfers from taxpayers to the government.Footnote 31 A range of values for the rate of excess burden has been calculated, depending largely on the type of tax being considered.Footnote 32 Because tax revenues are fungible, it is impossible to determine which sort of tax is used to fund both the acquisition of the dams and the real costs of the project, so some average value could be used in calculating the excess burden.
Finally, while the original analysis was thorough in much of its description and discussion, one overarching criticism is the lack of clarity regarding calculations of the present value of the various benefit and cost streams and the resulting NPV of the project (as noted at the end of the last section, and which gives rise to the disparities between Tables 2 and 3). Repeated attempts were made to replicate the calculations of the original analysis, but while those original results were approximated, differences remained and seemed capricious.
NPV and benefit-cost ratios as calculated in original paper.

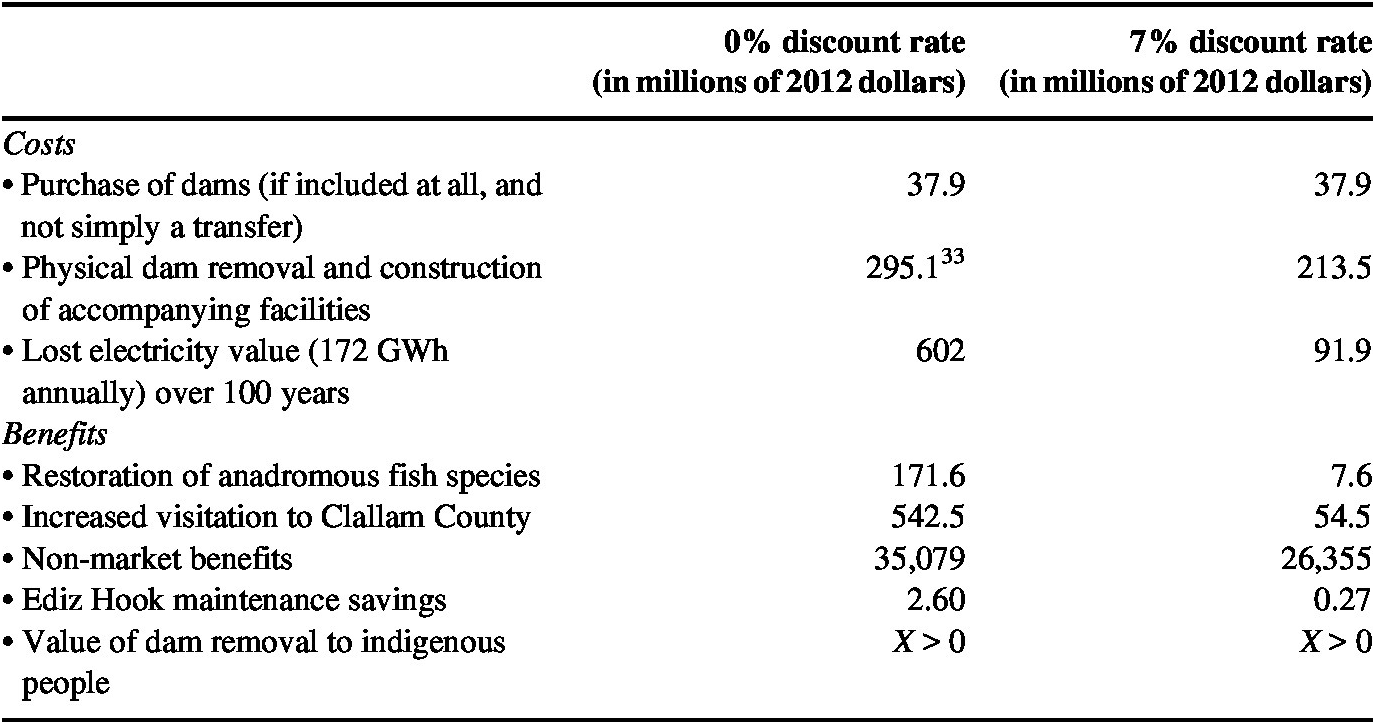
Ex post benefit-cost analysis – summary.

5 An ex post benefit-cost analysis of the Elwha River Restoration Project
Thus far, we have described the original benefit-cost analysis of the project. We now turn to the differences between the original vision of the project and its actual implementation, and the subsequent implications for measurement of project benefits and costs.
The total budget for removal of the dams and planning, construction, and management of related structures was $325M. Of this amount, only $29.9M, or about 9.9% went to dam acquisition. $32.9M, or about 10.4% was spent on removal and decommissioning of the dams and their associated power facilities. The majority of the budget was spent on maintaining water quality in the Elwha River and for people who draw upon the Elwha as a water source. Fully 46.2% of the project budget was dedicated to projects related to water quality, including surface water intake and water treatment facilities to preserve delivered water supplies during periods of increased turbidity as accumulated sediment from the reservoirs found its way downstream. In addition, 7.1% of the budget was dedicated to operation and maintenance of these facilities. Construction of hatcheries and restoration, and monitoring of fisheries accounted for 7.2% of the budget. Loss of the dams meant loss of their flood control services and as a result, approximately 6.0% of the budget was dedicated to flood control projects. Planning, design, and management accounted for 6.6% of the budget with assorted, smaller items constituting the rest. The present value of these expenditures, distributed over the original project time-cost profile, is between $213.5M and $295.1M, depending on discounting.
Ex post valuation of foregone electricity generation differs from ex ante valuations. The original paper suggested an average value of the foregone electricity generation roughly equivalent to the lowest electricity rate offered to power customers near Port Angeles (the city at the mouth of the Elwha River). This was approximately $0.035 kWh−1 in 2017, or $0.0317 kWh−1 in 2012 dollars, Footnote 34 for an annual value of $5.4M in 2012 dollars. However, there was also an inherent assumption in the original analysis that real electricity prices would rise by 2% annually in the initial years of the project and its aftermath, which seems not to have happened. Since the preparation of the original report, the Bonneville Power Authority’s real price for electricity has generally ranged from $0.03 to $0.04 kWh−1 in 2012 dollars, Footnote 35 suggesting an annual value for the foregone generation of between $5.2M and $6.9M with a midpoint of $6.0M. The present value of 100 years of foregone generation, according to the assumptions of the original study, was between $93.3M and $816.4M, discounting at rates of 7 and 0%, respectively. Using an average value of $0.035 kWh−1 (equivalent to $6.02M annually) over a 100-year time period and no annual increase in real electricity prices, the ex ante value of the foregone electricity is between $91.9M and $602.0M, again in 2012 dollars and discounting at rates of 7 and 0%, respectively.
If the purchase of the dams is included as a cost (and not as a transfer among parties both of which have standing in the analysis), the original $37.9M figure is correct.
The original analysis discussed the recreational, commercial, and non-use existence value of restored runs of anadromous fish species in the Elwha River, presenting numbers of fish and pounds of harvest for six different species. This presentation, although well calculated, did not distinguish between native, wild fish, and hatchery fish. There is a belief that fish that begin life in hatcheries might displace wild fish, and because hatchery fish are less successful at survival and reproduction, they will compromise the genetic integrity of a river’s wild population.Footnote 36
These concerns underlie an ongoing debate regarding tradeoffs between conservation and harvest objectives in fisheries.
The original analysis made no distinction between hatchery and wild fish and included in its analysis the cost of a hatchery to help stock the newly freed river, suggesting that harvest objectives were considered over conservation of wild species. It may be, however, that after a century of the river being dammed, the question of what would constitute a native anadromous species specific to the Elwha River might be purely academic. Furthermore, while there was disagreement about hatcheries at the time the original analysis was published, the issue of valuing wild versus hatchery fish was not generally addressed in benefit-cost analyses at that time.
Either way, the lag from project completion to fish harvest seems to be exceeding that of the original analysis, which forecast harvests beginning between 2 and 6 years into the project. Actual dam removal began in September 2011 and concluded in August 2014. If these are taken as project years 1 and 4, the original analysis forecast harvests beginning between 2012 and 2016. In March 2017, an existing moratorium on fishing in the Elwha River was extended to June 2019.Footnote 37 This suggests that harvests will be delayed until at least the ninth project year, delaying the resumption of harvests by 3–7 years, and decreasing their present value. A report from the Washington Fish and Wildlife Commission from September 2017 stated that chinook and steelhead populations were far short of long-term recovery goals (Anderson & Hoffman, Reference Anderson and Hoffman2017).
It is difficult to say how the delayed start to harvesting fish on the Elwha River might affect the valuation of this project. Other things being the same, the delay represents lost harvest that cannot be recovered over the 100 years incorporated in the analysis, and while harvests in these early years would be significantly less than the long run, sustainable maxima, their early appearance in the benefit stream would make their present value relatively high, especially when discounting at 7%. Setting aside discounting issues, removal of 5 years of benefits from a mature fishery would reduce benefits by approximately $18M (see online supplementary material for calculated values). Alternatively, delaying the start of even modest levels of fishing might accelerate the recovery of native runs and speed the approach to long run equilibria at some maximum sustainable harvest.
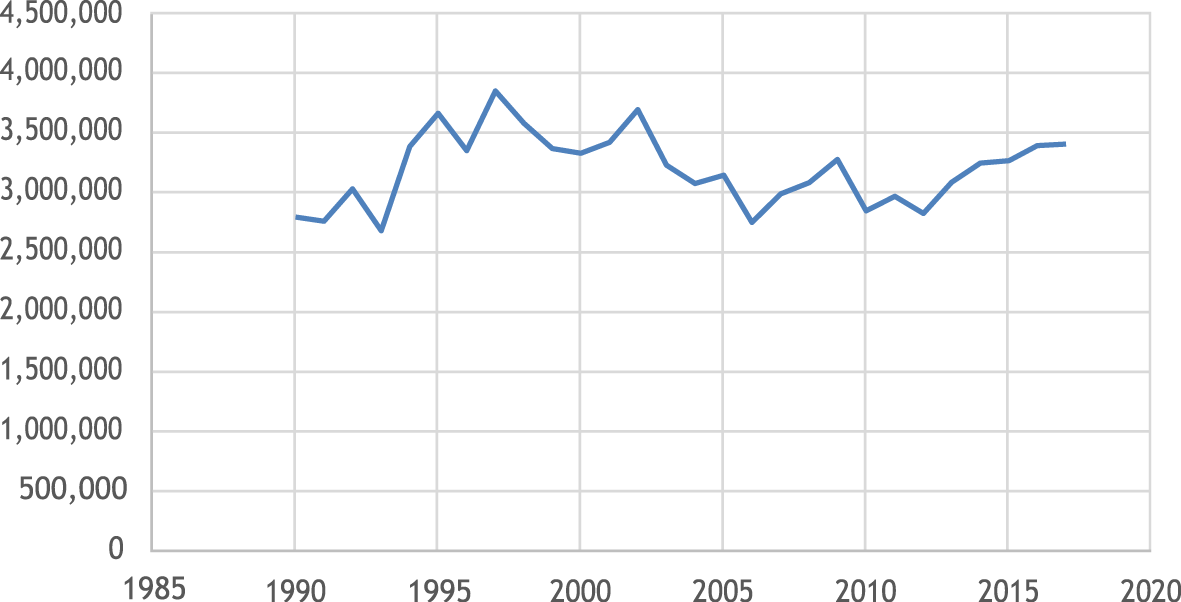
Setting aside the question of whether it is appropriate to include local tourism benefits in a study where standing is assigned nationally, it is difficult, even ex post, to discern the impact of Elwha River dam removal on visitation and tourism on the Olympic Peninsula and at Olympic National Park. Visitation figures for the national park show a steadily increasing trend from 2012 to 2017, but most of this increase was from 2012 to 2014. Furthermore, visitation figures have ebbed and flowed in the past and attributing this increase to any one effect would seem precarious. Furthermore, while the dam removals did free the river, remaining debris has made the river too dangerous for rafting and kayaking and, at least up to 2017, this recreational opportunity has gone unfulfilled on the Elwha. If the impact of the dams’ removal on visitation is negligible, the question of standing in this case may be moot ( Figure 1).
Olympic National Park visitation.

Similar to tourism benefits, impacts on Ediz Hook are difficult to discern ex post because various factors, including major storm events and choices of different maintenance options, can overwhelm the impact of the project (Corps of Engineers, 2016). Research suggests that additional sediment from the Elwha River is depositing offshore (Gelfenbaum et al., Reference Gelfenbaum, Stevens, Miller, Warrick, Ogston and Eidam2015) and may be transported to Ediz Hook, but identifying a specific impact on maintenance expenditures would be complicated at best.
Adding consideration of the excess burden of taxation will add to both the real costs of the project and to the acquisition cost of the dams. The total budget for the project as enacted was $325M, and if an excess burden rate of 30% is applied, the cost of the project would increase by $97.5M.
Regarding non-market, non-use, existence values for the fish populations restored, a broad review of the literature on valuation of river restoration by Bergstrom and Loomis (Reference Bergstrom and Loomis2017) included household WTP figures from 18 analyses of projects, with an average value of $79 (table 2, p. 13). Work by Stratus Consulting (2015) looking specifically at the Elwha River estimated annual household WTP for different degrees of salmon restoration in the neighborhood of $220 to $380 (Stratus, pp. 7-13, 7-14). Their response rates were 21.95% for Internet surveys and 35.04% for mail surveys (Stratus, p. 7-2). Loomis et al. found median household WTP of between $59 and $73 and had response rates of 77% for Clallum County, 68% for the rest of Washington, and 55% for the rest of the USA. Loomis et al. generated a lower bound for their estimates by assuming non-respondents had zero WTP and arrived at a lower bound for U.S. national benefits of $3B (Loomis, pp. 443–444). Applying the same practice to Stratus values yields conservative lower bounds for household WTP of about $67 for Internet respondents and $77 for mail respondents and for national WTP on the order of $8B. The valuation result in the original analysis of the Elwha restoration project was dominated by existence values. Although non-use existence values can never be made completely concrete, the values presented in the original analysis seem consistent with subsequent analyses.
Ex post calculations of the NPV and benefit-cost ratios strongly suggest that this project was beneficial, and this conclusion is robust to changes in assumptions. Using a 100-year time horizon, including both commercial and sport fishing benefits without delay but excluding tourism benefitsFootnote 38 yields the results displayed in Table 5. Adding tourism benefits would increase the present value of the benefits by $542.5M discounting at 0% and by $54.5M discounting at 7%. As shown in the table, adding an excess burden of taxation of 30% has only a small impact on NPV and benefit-cost ratios. As mentioned above, each year of delay in the resumption of commercial and sport fishing in a mature fishery would cost $3.66M in net benefits, a small impact relative to the values shown.
Ex post NPV and benefit-cost ratios.

6 Comparisons of the ex ante and ex post benefit-cost analyses
-
(i). The cost of the removal wound up being, even in real terms, much greater than was originally forecast, not because of the removal of the dams themselves but because of water quality, sediment management, and flood control measures that needed to be constructed to replace the services lost with the removal of the dams.
-
(ii). Electricity prices seem not to have risen as was originally forecast, so the cost of foregone electricity generation has likely been less, especially if valued on a regional basis, than was forecast.
-
(iii). Delays in fish harvests and recreation opportunities including rafting and kayaking, as well as difficulties in discerning increases in visitation, suggest that at least some of the benefits that were claimed have not yet been realized. These delays reduce the present value of the project’s benefits.
-
(iv). The one thing that would seem unaffected by the passage of time is the contingent valuation benefits. As these are the overwhelming majority of benefits, and they dwarf the costs of the project, the overall desirability of removing these dams would seem to remain. Indeed, this reality seems to be echoed in a paper (Gowan et al., Reference Gowan, Stephenson and Shabman2006) that asks, at one point, if these dams were going to be removed anyway, why do a CV study about their removal? It may be that when something is politically popular in spite of the fundamental economics behind it being shaky, contingent valuation reveals sentiments in the relevant population that are consistent with that overwhelming political popularity. That being said, Senator Slade Gorton managed to block the removal of these dams for years until his political career ended, so while it is easy to assert the political popularity of the removals after the fact, the reality at the time may have been quite different. The important criticism of the contingent valuation non-use values of the restored river may be the delay in the return of anadromous fish. Bergstrom and Loomis (Reference Bergstrom and Loomis2017) review 38 studies estimating the benefits from river restoration projects. Of these, approximately 70% had as their primary goal the restoration of fisheries, including the preservation of threatened and endangered fish, restoration of native species, and dam removal for the benefit of migratory fish. Although fishery benefits seem to be preeminent among river restoration projects, it is worth noting that approximately 30% of the studies and projects examined by Bergstrom and Loomis had other goals. This suggests that it is conceivable that a freed river could have value, even if it temporarily, at least, holds fewer fish than expected. By what percentage the value might be diminished by lack of fish is a matter for speculation. The original Loomis (Reference Loomis1996) study did not anticipate separability of the river and the fish. The valuation question put to respondents of this contingent valuation study was, “If a majority of people are not willing to pay the cost of dam removal, the dams would remain. Fish populations would be as shown in the bar chart under the Dams & Fish Ladders alternative. If a majority of people agree to pay the costs, the dams would be removed, the river would be restored to a natural state, and fish populations would increase as shown in the bar labeled Dam Removal.” (Loomis, Reference Loomis1996, p. 443) Separation of the river from the fish was not done, and perhaps not even imagined at the time, so it is impossible to say how the apparent outcome might have been valued at the time.
-
(v). Changing worldviews and the introduction of new schools of thought are very difficult to predict, and at least two of these impact the analysis of this dam removal project. The first is the somewhat new distinction between hatchery and wild fish. Although the construction and operation of hatcheries was certainly seen as necessary to increase nominal numbers of anadromous fish using the Elwha River, these hatchery fish compete with wild runs for resources. Although wild fish might be slower in repopulating the river, there might be greater long run value in their doing so, depending on the relative values people attach to wild versus hatchery fish. The second is the value attached to some degree of restoration of traditional lifestyles for Native Americans. The values that both native and non-native populations might attach to the resumption of traditional harvests and the cultural connotations of these harvests was not a focus of the original Loomis study, but may be valuable in the context of this project. Valuation of indigenous rights is a nascent area of study (Navrud & Ready, Reference Navrud and Ready2002; Rizzo & Mignosa, Reference Rizzo and Mignosa2013), with few empirical measurements and even less agreement on methods, but regardless, it can be assumed that its value would be positive, thereby increasing the already large net benefits attributed to the removal of the Elwha project dams. Both of these novel changes in people’s views of the world probably could not have been predicted and are one of the fates to which an analysis of any long-term project is necessarily exposed.
7 Conclusions
The Elwha River dam removal project is a rare example of a two decade lag between an ex ante benefit-cost analysis and eventual implementation. The eventual resolution of the project differed from expectations in several ways. Unsurprisingly, perhaps, the scope and cost of the project expanded, even in real terms, as many of the services provided by the dams needed to be replaced, and water quality issues arose. More surprisingly, electricity prices did not rise as expected and anadromous fish species have not returned in the hoped-for numbers. Early analysts could not have reasonably been expected to anticipate changes in attitudes toward hatchery-raised fish, or the nascent idea of valuing the preservation or renaissance of native people’s cultural heritage and way of life. Any ex ante benefit-cost analysis can be expected to involve assumptions and considerations that, with the passage of time, change. The Elwha River Project is no different. The good news is that, while some early assumptions have turned out to be incorrect, egregious a priori assumptions that vastly skew the results do not appear to have been made.
How typical is the Elwha River Project analysis to other ex ante benefit-cost analyses? Unfortunately, as documented in the literature review in the Introduction section, there are few comparative ex ante/ex post dam-related benefit-cost analyses readily available for comparison.Footnote 39 Although this example provides hope that early benefit-cost analyses on large projects are not wildly off ex post results, we can in no way state that this is the usual or expected outcome; there simply are not enough comparative analyses out there. A quick literature review of other large-scale ex ante/ex post comparative benefit-cost analyses, on topics outside of hydropower dams, also turns up virtually no useful comparison studies. An extremely pertinent future research agenda, therefore, would be to conduct more ex post benefit-cost analyses like this one, in order to gauge how well, or how poorly, ex ante benefit-cost analyses appear to do over time.
In the meantime, analysts conducting benefit-cost analyses should, as these original authors did, continue to observe standards of practice and strive to completeness and care in measurement, knowing that they should expect various factors, some possibly foreseeable and some not, to arise and drive a wedge between the ex ante expectations and the ex post results. Perhaps the greatest practical suggestion to future practitioners is to keep very clear, thorough, and replicable records of all numerical calculations implemented, so future comparative efforts can be made with a strong degree of numerical accuracy.
Acknowledgements:
D. O’Hara, B. Simon, L.L. Kiesling, participants at the 2018 American Economic Association meetings, and at the 2018 Midwest Economic Association meetings. The authors specifically acknowledge the work of the authors of the original benefit-cost analysis, “Elwha River Restoration Project: Economic Analysis, Final Technical Report,” P.A. Meyer of the Lower Elwha S’Kallam Tribe; R. Lichtkoppler of the National Park Service; R.B. Hamilton, C.L. Borda, D.A. Harpman, and P.M. Engel of the U.S. Bureau of Reclamation; and the work of the author of the original contingent valuation analysis, “Measuring the Economic Benefits of Removing Dams and Restoring the Elwha River: Results of a Contingent Valuation Survey,” by J.B. Loomis.
Supplementary material
To view supplementary material for this article, please visit https://doi.org/10.1017/bca.2019.31
Appendix Timeline of implementation of The Elwha River Ecosystem and Fisheries Restoration ActFootnote 40
In January 1992, the 102nd Congress of the USA passed The Elwha River Ecosystem and Fisheries Restoration Act, or “The Elwha Act.” Public Law 102-495 authorized the Secretary of the Interior to acquire the two hydroelectric dam projects and implement the actions necessary to achieve full restoration of the Elwha River and the native anadromous fisheries therein.Footnote 41 The act limits the acquisition price to $29.5M and requires that the Secretary of the Interior prepare and submit a restoration plan by January 1994.Footnote 42 When released in January 1994, the final version of the "Elwha Report" discussed several possibilities for restoration including removal of either the Glines Canyon dam or Elwha River dam and modification of the dams to facilitate fish passage, but recommended removal of both dams in order to meet the Elwha Act’s goal of full restoration of The Elwha River Ecosystem and native anadromous fisheries.Footnote 43 This decision was affirmed by the Final Programmatic Environmental Impact Statement, which was released in June 1995. In February 1996, a Record of Decision was signed in favor of dam removal and in February 2000, Secretary of the Interior, Bruce Babbit, finalized federal acquisition of the projects.
The Elhwa Act provided for preservation of the quality and availability of water from the Elwha River for industrial and municipal uses, and construction of infrastructure related to this necessarily preceded work on dam removal. In August 2007, the National Park Service (NPS) awarded a $24.5M contract to Watts Constructors LLC and John Korsmo Company (Watts/Korsmo A JV), based in Gig Harbor, Washington, for construction of the Port Angeles Water Treatment Plant (PAWTP). The eventual cost of this plant would be nearly $30M. In December 2007, NPS awarded a $69.6M contract to Watts Constructors LLC and DelHur Industries, Inc. for construction of Elwha Water Facilities, which included a new surface water diversion and intake, industrial water treatment plant, and area flood protection.
Construction on the PAWTP began in December 2007.Footnote 44 (http://www.water-technology.net/projects/portangeleswatertrea/). In October 2008, NPS officials reached an agreement with the City of Port Angeles to transfer ownership of the PAWTP to the city upon its completion. The PAWTP became operational in February 2010.Footnote 45 In April of that same year, construction of Elwha Water Facilities project, consisting of the $48M Elwha Water Treatment Plant and the $29M Elwha Surface Water Intake, was completed.Footnote 46
The Elwha Act also provided for full restoration of native anadromous fisheries, and to this end, a number of projects were constructed. In September 2009, work began in the Washington Department of Fish and Wildlife (WDFW) rearing channel at Morse Creek. Beginning in 2010, chinook salmon were transferred to Morse Creek, an adjacent stream whose water quality would not be impacted by dam removal, to insure protection of each returning year class of fish.Footnote 47 In February 2010, construction began on the Lower Elwha Klallam Tribe fish hatchery, funded by the American Recovery and Reinvestment Act of 2009.Footnote 48 , Footnote 49 Work on the hatchery was completed in May 2011.Footnote 50 Further assurance of the recovery of the fisheries was added in February 2011 when the Washington Fish and Wildlife commission approved a 5-year fishing moratorium on fishing in the Elwha River, to begin in March 2012. This moratorium would later be extended to June 2019.Footnote 51
At last, with the necessary supporting projects in place, work on the actual removal of the dams began in September 2011.Footnote 52 Removal of the Elwha River dam was completed in March 2012 and removal of the larger Glines Canyon dam was completed in August 2014.Footnote 53
With the actual removal of the dams, several unanticipated problems arose. Beginning in October 2012, the Elwha Water Treatment Plant, part of the facilities that constituted the largest part of the project budget, began to experience problems when sediment and woody debris overwhelmed its water intake structures and treatment facilities. This occurred despite sediment levels being well below those that the plant was designed to handle.Footnote 54 A dispute between the City of Port Angeles and the NPS related to design flaws in the water treatment facilities and the cost of addressing these flaws and higher than expected operating costs is ongoing and handover of the plant to the City seems to have been delayed indefinitely.Footnote 55 , Footnote 56 , Footnote 57
In addition to problems with water treatment facilities, there have been issues with other benefits that the dams’ removal was expected to yield. In June 2016, NPS concessionaire Olympic Raft and Kayak stopped taking clients on trips down the Elwha River because of safety concerns regarding the remaining debris from dam removal projects.Footnote 58 In March 2017, commercial and recreational fishing were delayed as well when the pre-existing fishing moratorium on the Elwha was extended to June 2019.Footnote 59