


1. Introduction
River basin governance worldwide is plagued by prominent challenges, including disrupted hydrological circulation, inadequate cross-border collaboration, fragmented governance and excessive resource exploitation. These dilemmas are primarily driven by the imbalance between ecological conservation and economic development (El-Nashar and Elyamany, Reference El-Nashar and Elyamany2023). In this context, the horizontal ecological compensation (HEC) policy has emerged as a critical institutional tool to mitigate transboundary environmental externalities and promote coordinated basin development, garnering widespread attention from the international community (Hossen et al., Reference Hossen, Connor and Ahammed2023).
Consistent with global trends, China's river basins also face inherent challenges, such as ecological fragility, significant regional disparities and the difficulty of balancing environmental conservation with livelihood improvement (Zhao et al., Reference Zhao, Shu, Zhao and Guo2024a). To address these issues, China has steadily advanced the development of basin HEC policies and, in June 2025, the Ministry of Finance of China and four other central ministries and commissions jointly issued an implementation plan. This plan explicitly advocates establishing a comprehensive, fair and inclusive basin ecological compensation system, upholds the core principle of ‘protectors gain and contributors are rewarded’, and promotes the coordinated development of economy and environment within river basins (Liu and Yuan, Reference Liu and Yuan2023).
Focusing on the Yellow River Basin, this study addresses three core research questions: first, can the HEC policy synergistically improve ecological environmental quality and regional economic performance to achieve coordinated environmental and economic effects? Second, through what transmission pathways does the HEC policy exert impacts on ecological conservation and economic growth? Third, do policy effects exhibit significant heterogeneity across regions with different levels of water pollution, topographic features and poverty?
In light of this, this paper empirically investigates the mechanisms by which watershed HEC policies influence environmental protection and economic development, drawing on a constructed theoretical model of their dual environmental and economic impacts. Its potential marginal contributions are threefold: first, by establishing a theoretical framework for HEC policies’ impacts on regional ecology and economy, it identifies three action mechanisms – the industrial structure effect, technological innovation effect and energy-saving effect – providing new empirical evidence and mechanistic explanations to address existing theoretical gaps. Second, macro-level provincial and municipal data may mask substantial heterogeneity in local environmental governance, subnational policy implementation and regional industrial impacts. Using district- and county-level data thus provides a sharper empirical basis for designing context-specific ecological protection and economic development policies. Third, by analysing differences in water pollution levels, topographic conditions and poverty levels across districts and counties, the study identifies variations in the policy's effects on environmental protection and economic development, and further examines the moderating effects of transfer payments and human capital, thereby providing references for the targeted implementation of watershed HEC policies.
2. Literature review
River basins typically exhibit a severe imbalance between economic development and environmental protection: economically developed regions (compensating areas) are usually associated with high ecological resource consumption, while those bearing greater environmental protection responsibilities (compensated areas) are mostly less developed, confronting the dual pressures of constrained development and overlapping ecological risks. This imbalance mainly arises from the uneven allocation of governance responsibilities, leading compensated counties to passively endure ecological protection constraints (Cao and Chen, Reference Cao and Chen2025). As an institutional arrangement formulated to advance basin ecological protection and regional coordinated development, the river basin HEC policy involves upstream-downstream consultation, cooperation and economic incentives to realize shared ecological responsibilities and benefits (Chen et al., Reference Chen, Wang, Lv, Zhong, Ren, Ren, Nan, Wang, Liu and Luo2025b). It requires peer local governments to build a decentralized parallel government collaboration framework based on equal consultation mechanisms and the principle of value equivalence, forming a market-oriented trading system for basin ecological services through intergovernmental contractual collaboration (Schröter et al., Reference Schröter, Castro-arce and Aguilar-gonzález2023; Jiang et al., Reference Jiang, Chen and Qiang2025). The implementation of the basin HEC policy aims to ensure that both types of areas enjoy equal rights and development space in ecological governance. It should both acknowledge the legitimate development demands of compensating areas based on the use of ecological elements and ensure that compensated areas receive due value returns for undertaking ecological protection responsibilities (Sandoval-Solis et al., Reference Sandoval-Solis, Paladino, Garza-diaz, Nava, Friedman, Ortiz-partida, Plassin, Gomez-quiroga, Koch, Fleming, Lane, Wineland, Mirchi, Saiz-rodriguez and Neeson2022).
Research on river basin HEC has undergone a phased evolution, progressing from responsibility definition to compensation standards, and finally to compensation effects. In terms of responsibility definition, existing studies have mainly focused on exploring market-oriented approaches to address the ambiguity of basin rights and responsibilities. Scholars have innovatively transformed the basin ecological responsibility accounting framework into a water rights trading tool (Tickner et al., Reference Tickner, Parker, Moncrieff, Oates, Ludi and Acreman2017), and further proposed that the costs of basin ecological protection should be reasonably shared by beneficiary areas (Schirpke et al., Reference Schirpke, Marino, Marucci and Palmieri2018), which provides a theoretical and practical basis for the implementation of river basin HEC. In terms of compensation standards, scholars have conducted in-depth explorations on the criteria for determining compensation funds. They have proposed setting water quality assessment indicators combined with financial incentive and restraint measures, transforming the environmental governance responsibilities of local governments into quantifiable and traceable performance contracts (Brownson et al., Reference Brownson, Anderson, Ferreira, Wenger, Fowler and German2020; Zeng et al., Reference Zeng, Brouwer, Wang and Chen2021; Benra et al., Reference Benra, Nahuelhual, Felipe-lucia, Jaramillo, Jullian and Bonn2022). Additionally, the direct costs of eco-compensation and the opportunity costs of upstream regions have been accounted for through methods for measuring ecological services (Zhang H-z et al., Reference Zhang H-z, He and Zhang2023a).
Studies on the policy effects of HEC can be divided into two opposing viewpoints. Some scholars argue that HEC policies have coordinated regional economic development and environmental protection, which is conducive to improving the financial situation of compensated regions and promoting the growth of investment in environmental protection (Li and Lu, Reference Li and Lu2022; Yu et al., Reference Yu, Chen and Shao2023). They further note that the implementation of HEC policies can drive the green transformation of industries, reduce pollutant emissions in the basin and simultaneously boost the growth of basin eco-tourism revenue and increase residents’ income (Li et al., Reference Li, Wen, Wan and Hu2024). In contrast, other scholars hold that the compensation effect of HEC policies is not significant and may even deteriorate the situation of compensated districts and counties (Asher and Bhandari, Reference Asher and Bhandari2021). They explain that when local governments overly focus on local environmental performance, non-environmental governance investments may be crowded out, and that local governments’ industrial transformation for environmental protection may lead to the withdrawal of traditional industries, resulting in losses in regional economic development (Sheng et al., Reference Sheng, Cheng and Wu2023).
In summary, although existing studies have made progress in theoretical analysis and effect evaluation, there is still room for further research. First, most studies on river basin HEC policies have focused on the impact analysis from a single economic or environmental dimension, and the analysis on its dual economic and environmental effects remains scarce. Based on this, this study focuses on the analysis of its dual economic and environmental effects. Second, most existing studies have concentrated on the impact of river basin HEC policies at the provincial or municipal levels, ignoring the key role of districts and counties as the basic functional units and implementation carriers of such policies. The analysis of micro-mechanisms at the district and county scale is still weak. Based on this, this study adopts a more micro perspective of county-level regions. Third, few existing studies have systematically deconstructed the internal path of river basin HEC policies in promoting the synergistic effect of environmental protection and economic development through the combination of model deduction and empirical testing, and there are also deficiencies in heterogeneity analysis and moderation tests. Based on this, this study constructs a theoretical analysis model and enriches the analysis in terms of heterogeneity and moderation tests.
3. Theoretical analysis and research hypotheses
3.1. Theoretical model analysis
To explore the mechanism of how HEC affects optimal resource allocation, a theoretical model of inter-regional economic and ecological coordinated development is constructed. Assume the regional utility function is jointly determined by ecological environment quality ( $Q$) and comprehensive economic output (E). Its expression is
 \begin{equation}U = U(Q,E) = {({Q^{\frac{{\alpha - 1}}{\alpha }}} + {E^{\frac{{\alpha - 1}}{\alpha }}})^{\frac{\alpha }{{\alpha - 1}}}}\end{equation}
In Equation (1),  $\alpha $ represents the elasticity of substitution between ecological and economic benefits. Assume the initial total stock of ecological resources in a region is a fixed amount
 $\bar Q$. These resources are allocated between a consumptive sector, which utilizes an amount
 $\bar Q - Q$ and produces output
 ${E_1} = A\left( {\bar Q - Q} \right)$, and a non-consumptive sector, which utilizes an amount
 $Q$ and produces output
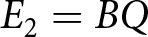 ${E_2} = BQ$. Typically, the consumptive sector (e.g., manufacturing) is characterized by higher technological maturity and a higher technological level
 $A$. Conversely, the non-consumptive sector (e.g., eco-tourism) operates at a lower technological level
 $B$. The term
 $\eta $ denotes the energy-saving coefficient resulting from the implementation of the HEC policy. Recipient regions invest compensation funds into energy-saving R&D. Since these funds depend on the remaining local ecological benefits, the energy-saving technology generates additional economic gains, denoted as
 $\eta Q$.
 \begin{equation}U\left( {Q,E} \right) = \left( {Q,{E_1} + {E_2} + \eta Q} \right)\end{equation}
Total economic output, defined as  $E = A\left( {1 + \eta } \right)\left( {\bar Q - Q} \right) + BQ$, is substituted into Equation (1) to derive the condition for regional utility maximization,
 \begin{equation}{max _Q}U = {\left[ {{Q^{\frac{{\alpha - 1}}{\alpha }}} + {{\left( {A\left( {\bar Q - Q} \right) + BQ + \eta Q} \right)}^{\frac{{\alpha - 1}}{\alpha }}}} \right]^{\frac{\alpha }{{\alpha - 1}}}}\end{equation}
Solving this utility maximization condition yields the optimal amount of ecological resources retained,
 \begin{equation}{Q^*} = \frac{{{{\left( {A - B - \eta } \right)}^{ - \alpha }}A\bar Q}}{{1 + {{\left( {A - B - \eta } \right)}^{1 - \alpha }}}}\end{equation}
Substitute  ${Q^*}$ into the formula for total economic output:
 $E = A\left( {1 + \eta } \right)\left( {\bar Q - Q} \right) + BQ$, Consequently, the economic output is
 \begin{equation}E = A\bar Q - \left( {A - B - \eta } \right){Q^*}.\end{equation}
From  $\partial E/\partial {Q^*} = B + \eta - A$, it follows that if
 ${Q^*}$ increases (e.g., due to
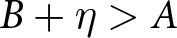 $B + \eta \gt A$),
 $E$ also increases. Conversely, if
 ${Q^*}$ decreases,
 $E$ also decreases. This leads to:
Corollary 1: When the sum of the technological level and energy conservation coefficient of non-consumption sectors exceeds the technological level of consumption sectors, the region tends to retain ecological resources, and at the same time, economic output grows, thus achieving a balance between economic development and environmental protection.
The impacts of the technological levels in the non-consumptive sector  $B$ and the consumptive sector
 $A$ on the optimal ecological retention
 ${Q^*}$ are further analysed, as follows:
 \begin{equation}\frac{{\partial {Q^*}}}{{\partial B}} = \frac{{\alpha A\bar Q{{\left( {A - B - \eta } \right)}^{ - 1 - \alpha }} + A\bar Q{{\left( {A - B - \eta } \right)}^{ - 2\alpha }}}}{{{{\left[ {1 + {{\left( {A - B - \eta } \right)}^{1 - \alpha }}} \right]}^2}}} \gt 0.\end{equation}
Thus, provided 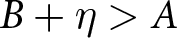 $B + \eta \gt A$ is ensured, an improvement in the non-consumptive sector's technology
 $B$ directly enhances its economic output per unit of ecological resource, incentivizing the region to retain more ecological resources
 ${Q^*}$. The analysis for the energy-saving coefficient
 $\eta $ and
 $B$ is entirely analogous. This yields:
Corollary 2: Technological progress in non-consumption sectors or an increase in the energy conservation coefficient will encourage regions to adopt more non-consumptive ways to utilize ecological and environmental resources, and at the same time, it will also promote regional economic development.
The partial derivative of the optimal ecological retention  ${Q^*}$ with respect to the consumptive sector's technological level
 $A$ is
 \begin{equation}
\frac{{\partial {Q^*}}}{{\partial A}} = \frac{\begin{array}{@{}c@{}}\bar Q\big[ {{\left( {A - B - \eta } \right)}^{ - \alpha }} - \eta A{{\left( {A - B - \eta } \right)}^{ - 1 - \alpha }} \\
\quad +\,{{\left( {A - B - \eta } \right)}^{1 - 2\alpha }} - A{{\left( {A - B - \eta } \right)}^{ - 2\alpha }} \big]\end{array}}{{{{\left[ {1 + {{\left( {A - B - \eta } \right)}^{1 - \alpha }}} \right]}^2}}} \cdot \end{equation}
Based on Equation (7), the effect of an improvement in the consumptive sector's technology  $A$ on ecological resource retention is ambiguous, as it depends on the uncertain elasticity of substitution between ecological and economic utility. This leads to:
Corollary 3: The impact of technological progress in consumption sectors on the environment depends on the substitution elasticity between ecological utility and economic utility for people.
From the above derivation, the core impact mechanisms of HEC policies are as follows: promoting the shift from consumptive to non-consumptive ecological resource use and reducing reliance on ecological stocks through industrial structure optimization and upgrading (the industrial structure effect); strengthening technological coordination and financial support to compensate for the development opportunity costs of ecological conservation areas and stimulate positive spillovers of technological innovation (the technological innovation effect); and improving energy-saving technologies to reduce per-unit-output ecological occupation via clean technologies and intensive production while replacing resource consumption with enhanced technological efficiency (the energy conservation effect).
3.2. Theoretical research framework and hypotheses
From the theoretical perspective of ecological externality internalization, the rollout of basin-scale HEC policies constructs a systematic cross-jurisdictional interest coordination regime, delivering a viable institutional solution to reconcile regional economic advancement and watershed ecological conservation. Typically, ecologically constrained compensation-receiving regions undertake mandatory ecological duties covering water conservation and pollution remediation, while obtaining steady financial and resource subsidies from ecological beneficiary areas. This interregional benefit redistribution effectively eases fiscal burdens in ecologically prioritized zones and facilitates their green-oriented industrial transformation (Lin et al., Reference Lin, Baskaran and Zhang2023). For compensation-receiving areas, funds can be invested in low-environmental-impact industries such as eco-agriculture and clean energy (Wan et al., Reference Wan, Zheng, Wu, Wei and Wang2022), which generate employment while avoiding ecosystem damage from extensive development. Meanwhile, the application of market-based instruments such as pollution permit trading and carbon sink projects (Chen et al., Reference Chen, Dou and Xu2021) encourages local enterprises to adopt green technologies proactively, turning environmental governance into a competitive advantage.
When compensation-receiving areas and environmentally beneficial areas achieve coordinated development through industrial collaboration and technology sharing, both resource use efficiency and pollution reduction at the basin level are improved (Yang et al., Reference Yang, Zhang, Yang and Yang2022). This type of interaction helps stimulate synergies across regions, promoting the transition from a traditional economic model to a green and low-carbon one, while systematically enhancing the ecological foundation through environmental governance (Peng et al., Reference Peng, Pu, Huang, Zheng and Xu2022). This two-way reinforcing mechanism transforms ecological conservation from a constraint into a driver of high-quality growth, ultimately creating a symbiotic relationship between environmental improvement and economic optimization. Accordingly, the following hypothesis is proposed:
H1: The HEC policy can significantly promote the simultaneous improvement of economic development and environmental quality.
By redefining interregional responsibilities and resource allocation mechanisms, the HEC policy allows compensation-receiving counties to gain economic returns matching their ecological value consumption. On the one hand, the policy removes administrative barriers via cross-regional ecological property rights transactions and industrial cooperation (Wang et al., Reference Wang, Li, Xiao and Wang2024a), promoting optimized industrial division across river basins: upstream compensation-receiving areas leverage ecological protection revenues to develop low-environmental-cost industries such as eco-agriculture and clean energy, while downstream beneficiary regions support the upstream through green technology transfer and low-carbon investment, forming a cross-regional synergistic value chain. This spatial restructuring accelerates the intelligent transformation of traditional heavy industries, mitigates the crowding-out effect of environmental regulation on economic growth, and fosters new growth poles via green industrial clusters, thereby enhancing the industrial added value across the basin. On the other hand, the pollution payment mechanism compels regions to reduce carbon emission intensity (Chen et al., Reference Chen, Zhou, Li and Liu2025a), facilitating the diffusion of clean technologies and lowering unit output resource consumption. Ultimately, upstream-downstream coordinated governance achieves dynamic synergy between economic growth and ecological improvement, as reflected in the simultaneous reduction of pollution intensity and the rise of green industry share (Yan et al., Reference Yan, Bai, Zhang and Hu2022), enabling the basin to break away from high-pollution and low-efficiency lock-in and establish a sustainable development path. Accordingly, the following hypothesis is proposed:
H2: The HEC policy can balance economic development and environmental protection in river basins through industrial restructuring effects.
Basins face structural constraints such as fragmented green technology R&D and inefficient cross-regional allocation of innovation resources. Challenges include the externality of ecological governance and the regional monopolization of technological benefits, which lead to insufficient investment in environmental technology R&D and blocked interregional knowledge spillovers, hindering basin-wide technological collaboration (Song et al., Reference Song, Peng, Shang and Zhao2022). The HEC policy addresses these issues by reshaping the incentive mechanism linking ecological responsibility and technological innovation. It activates motivation for technological breakthroughs among multiple stakeholders through flexible designs that link ecological performance with compensation amount, enhancing institutional incentives for green technology innovation. Enterprises that achieve key emission reduction breakthroughs receive carbon quota rewards or patent subsidies, reducing the sunk cost of technology R&D (Song et al., Reference Song, Peng, Shang and Zhao2022).
To tackle blocked knowledge spillovers, the policy promotes cross-administrative ecological data sharing and joint research mechanisms, breaking down geographical barriers in technology R&D. Upstream ecological conservation areas use compensation funds to establish low-carbon technology pilot bases, attracting downstream research institutions to jointly develop adaptive technologies. Downstream industrial clusters provide technological transfer payments to upstream areas, forming a closed-loop innovation chain: upstream conducts basic research with compensation funds, downstream applies technologies and provides feedback for improvement, fostering continuous optimization and mutual development (Wang et al., Reference Wang, Deng, Zhang, Liu, Yue and Liu2022b). Accordingly, the following hypothesis is proposed:
H3: The HEC policy can balance economic development and environmental protection in river basins through technological innovation effects.
There exist numerous energy-intensive and pollution-intensive industries in river basins. Under the implemented HEC policy, the mechanism linking regional compensation standards to pollutant emission intensity compels local governments to optimize regional energy structures, enforce total pollution control and accelerate the iteration and diffusion of energy-saving technologies. On the one hand, motivated by total pollution control targets, local governments continuously expand the installed capacity of clean energy. The development of a hybrid energy system helps reduce energy costs, enhance energy supply reliability (Yang et al., Reference Yang, Jahanger and Hossain2023), cut fossil fuel consumption, effectively abate total industrial pollutant emissions and alleviate pressure on the ecological carrying capacity (Farghali et al., Reference Farghali, Osman, Chen, Abdelhaleem, Ihara, Mohamed, Yap and Rooney2023).
On the other hand, HEC policy restrains the agglomeration of energy-intensive industries, accelerates the iteration and diffusion of energy-saving technologies, and significantly reduces energy consumption per unit output (Zhang et al., Reference Zhang H-z, He and Zhang2023a). Meanwhile, the targeted investment of HEC funds in the energy-saving sector generates economies of scale, which further promotes the large-scale application of technologies such as waste heat recovery and process optimization (Xu et al., Reference Xu, Tan and He2022; Chen et al., Reference Chen, Alharthi, Zhang and Khan2024). This leads to a systematic decline in energy consumption per unit output and forms a virtuous cycle between energy-saving technology diffusion and cost sharing (Gu et al., Reference Gu, Zheng, Tong and Dai2022; Guo et al., Reference Guo, Wang and Dong2022). Accordingly, the following hypothesis is proposed:
H4: The HEC policy can balance economic development and environmental protection in river basins through energy conservation effects.
4. Materials and methods
4.1. Model specification
Based on the preceding theoretical analysis, we employ a two-way fixed effects multi-period difference-in-differences (DID) model as our baseline econometric framework. Grounded in the parallel trends assumption, this approach enables us to identify the net causal impact of the policy by stripping away common time trends and baseline group disparities through double differencing, while two-way fixed effects further account for time-invariant individual heterogeneity and time-varying shocks common to all units. We specify the model to examine the effect of the HEC policy on county-level environmental protection and economic development as follows:
 \begin{equation}{Y_{it}} = {\beta _0} + {\beta _1}DI{D_{it}} + \gamma {X_{it}} + {\alpha _i} + {\theta _t} + {\varepsilon _{it}}\end{equation}
In Equation (8),  ${\beta _0}$ represents the constant term.
 ${Y_{it}}$ denotes the status of economic development and ecological environment quality for county i in year t. Economic development is proxied by nighttime light data, while ecological environment quality is measured by
 ${\text{PM}}2.5$ concentration. is the core explanatory variable, a binary indicator taking the value of 1 if county
 $i$ had implemented the HEC policy by year
 $t$ and 0 otherwise.
 ${X_{it}}$ is a vector of control variables.
 ${\alpha _i}$ represents county-level fixed effects.
 ${\theta _t}$ denotes time fixed effects. is the error term. The coefficient
 ${\beta _1}$ on the core explanatory variable is of primary interest; if β 1 > 0, it indicates that the eco-compensation policy promotes both economic development and ecological quality improvement at the county level. The coefficients
 $\gamma $ represent the estimated effects of the control variables.
To investigate the mechanisms through which the HEC policy affects watershed economic development and ecological quality, a mechanism test is conducted. Building upon Equation (8), the following model is constructed:
 \begin{equation}{M_{it}} = {\beta _0} + {\beta _1}DI{D_{it}} + \gamma {X_{it}} + {\alpha _i} + {\theta _t} + {\varepsilon _{it}}.\end{equation}
In Equation (9),  ${M_{it}}$ represents the mechanism variable, which encompasses three specific channels: industrial structure effect, technological innovation effect and energy conservation effect. All other variables are defined consistently with those in Equation (8).
4.2. Variables
4.2.1. Explanatory variable
HEC policy  $\left( {policy{\text{ }}dummy} \right):$ A dummy variable is constructed based on a defined classification framework. It is assigned a value of 1 if any of the following three conditions are met: (1) if the county formally enacted and implemented a HEC policy; (2) if the county did not enact but forwarded a higher-level government's policy document and used it as the institutional basis for implementing the mechanism; or (3) if the county itself did not issue a policy, but the prefecture or province in which it is located enacted and implemented a policy applicable to the entire prefecture or province. In all other cases, the variable takes the value of 0.
4.2.2. Explained variables
This study employs the mean value of China's nighttime light data to capture the economic effect (Chen et al., Reference Chen, Yu, You, Yang, Wang, Lin, Wu and Yu2023). As a satellite-derived measure,  $Light(\log )$ reflects the intensity and spatial distribution of human activities through the brightness of surface lighting at night. Relative to conventional county-level GDP statistics, nighttime light data are more objective and spatially consistent, effectively mitigating issues including statistical bias, underreporting of the informal economy and inconsistent accounting standards across regions, thereby serving as a more robust proxy for regional economic development and vitality. Meanwhile, this study utilizes the annual average PM2.5 concentration derived from nationwide 1-km resolution raster data to represent the environmental effect (Xie et al., Reference Xie, Zhou, Hunt and Mauzerall2024). As a core indicator of air pollution,
 $PM2.5(\log )$ is closely associated with anthropogenic activities such as industrial emissions and energy consumption, and can directly reflect environmental quality and ecological pressure induced by economic activities. To alleviate heteroscedasticity and improve estimation precision, both nighttime light intensity and the environmental indicator are transformed into logarithmic form.
4.2.3. Control variables
Referencing the studies of Luan et al. (Reference Luan, Yang, Chen and Regis2022) and Bejagam and Sharma (Reference Bejagam and Sharma2022), control variables are selected from the following five aspects. Population size (Population Size(log)): Affects regional economic and environmental conditions through resource consumption, labour supply and pollution levels, measured by the number of permanent residents. Climatic characteristics ( $Precipitation(\log )$): Indirectly shapes ecological quality through vegetation growth, pollutant diffusion and agricultural non-point source pollution, measured by the logarithm of annual average precipitation. Grassland resources (
 $Grassland{\text{ }}Area(\log )$): Reflects the ecosystem's carbon sequestration and soil and water conservation capacity; larger areas support ecological restoration, measured by the logarithm of grassland area. Fiscal condition (
 $Fiscal{\text{ }}Status(\log )$): Reflects local governments’ capacity for environmental investment, measured by the logarithm of local fiscal general budget expenditure. Agricultural modernization level (
 $Agri{\text{ }}Modernization(\log )$): Reduces unit resource consumption via intensive management and promotes economic development, measured by the logarithm of total agricultural machinery power.
4.3. Data
This study employs a sample of 529 counties (districts) in the Yellow River Basin during 2010–2022 to investigate the economic and environmental impacts of the HEC policy. Socioeconomic data include industrial structure, total electricity consumption and the number of approved patents as mechanism variables, and are sourced from the China County Statistical Yearbook, with GDP and per capita GDP deflated to 2010 constant prices. Land use data are obtained from the 30-meter annual land cover dataset for China (1990–2022) released by Wuhan University, whereas PM2.5 data are derived from the 1-km-resolution national annual raster dataset (2000–2022) provided by the National Tibetan Plateau Data Center. Descriptive statistics for all variables are presented in Table 1.
Descriptive statistics

Table 1 Long description
Descriptive statistics summarize an explanatory policy indicator, one main outcome (logged night-time light intensity), and several control and mediating variables, reporting mean, minimum, maximum, and sample size. The policy dummy has a mean of 0.116 with values spanning 0 to 1, based on 6,877 observations. Logged night-time light intensity averages 11.990 and ranges from 0.020 to 63.000, also with 6,877 observations. One additional outcome row is reported in micrograms per cubic meter, with mean 3.815, minimum 2.681, maximum 4.677, and sample size 6,877. Among controls, logged population size averages 2.355 (range 2.083 to 2.840; 6,877), logged precipitation averages 6.285 (range 4.373 to 7.038; 6,851), and logged fiscal status averages 12.310 (range 9.836 to 15.251; 6,803). Logged agricultural modernization averages 3.387 (range 3.037 to 5.817; 6,812). Mediators include a secondary to tertiary ratio averaging 0.862 (range 0.452 to 1.000; 6,803), logged patents showing the widest spread with mean 3.523 and maximum 219.606 (minimum 0.000; 6,803), and logged energy consumption averaging 11.684 (range 7.709 to 15.755; 6,803). Sample sizes vary slightly across variables, so comparisons should note differing numbers of observations, and one control row lists a unit in square kilometers per hectare with values shown but no variable name provided.
Table 1 presents descriptive statistics for key variables. The core explanatory variable policy is a binary indicator with a mean of 0.116, indicating that 11.6 per cent of the 6,877 observations are in the treated group. The two explained variables,  $Light(\log )$ and
 $PM2.5(\log )$, are log-transformed with means of 11.99 and 0.815, respectively. All control variables are log-transformed to reduce skewness. Among the mediating variables,
 $SecondaryTertiary{\text{ }}Ratio\left( \% \right)$averages 0.862, while
 $Patents{\text{ }}\left( {{\text{log}}} \right)$ and
 $Energy{\text{ }}Consumption(\log )$ are log-transformed with means of 3.523 and 11.68, respectively.
5. Results and analysis
5.1. Baseline regression
Based on the econometric model specified in Equation (8), this study examines the impacts of the HEC policy on county-level economic development and environmental protection, with the estimation results presented in Table 2. Models (1) and (4) report the baseline estimation results without year fixed effects, county fixed effects or other control variables. Models (2) and (5) include year and county fixed effects, while Models (3) and (6) further incorporate a set of control variables.
Economic and environmental effects of PES policy

Table 2 Long description
Regression results compare the association of a PES policy indicator with two outcomes: logged night-time lights (models 1 to 3) and logged PM2.5 (models 4 to 6). The policy coefficient is positive for night lights in all three models, dropping from 5.406 in model 1 to 1.932 with county and year fixed effects in model 2, and to 1.601 after adding controls in model 3. For PM2.5, the policy coefficient is negative in all three models, moving from minus 0.260 in model 4 to minus 0.098 with fixed effects in model 5 and remaining minus 0.098 with controls in model 6. Added controls appear only in models 3 and 6: population size is strongly negative for night lights (minus 10.730) but near zero for PM2.5 (0.037), while precipitation is positive for night lights (0.294) and negative for PM2.5 (minus 0.059). Grassland area is negative for night lights (minus 1.187) and slightly positive for PM2.5 (0.012); fiscal status is positive for night lights (1.551) and negative for PM2.5 (minus 0.020); agricultural modernization is negative for both outcomes (minus 0.495 for night lights and minus 0.018 for PM2.5). Sample sizes are 6,877 in models without the extra controls and 6,709 when controls are included. Model fit is very high once fixed effects are included (R-squared about 0.975 to 0.976 for night lights and about 0.951 for PM2.5), so coefficients should be interpreted as within-county, over-time associations rather than simple cross-sectional differences.
The results across Models (1)–(6) show that the HEC policy has a significantly positive impact on economic development and a significantly negative impact on environmental pollution. Using Models (3) and (6) as benchmarks, a one-unit increase in the policy variable is associated with a 1.601-unit increase in economic growth and a 0.098-unit improvement in environmental quality, compared with non-policy regions. Therefore, the implementation of the HEC policy achieves a balance between environmental protection and economic development, providing empirical support for Hypothesis H1.
5.2. Robustness tests
5.2.1. Parallel trends test
The staggered DID approach relies on the parallel trends assumption (Jacobson et al., Reference Jacobson, LaLonde and Sullivan1993). Our results confirm the robustness of H1. Detailed procedures and Figure A1 are presented in the Supplementary Appendix.
5.2.2. Placebo test
To rule out non-policy confounding factors and verify the robustness of the baseline results, we perform a placebo test by randomly assigning treatment status and the timing of policy shocks. The results confirm the robustness of H1, with detailed procedures and Figure A2 documented in the Supplementary Appendix.
5.2.3. Excluding interference from other policies
To mitigate the confounding effects arising from overlapping policies in watershed ecological governance, we incorporate two policy dummy variables into the baseline model. The empirical results confirm the robustness of H1, with detailed procedures and Supplementary Appendix Table A1 presented in the Supplementary Appendix.
5.2.4. Excluding the influence of outliers
To mitigate outlier impacts, we winsorized the top and bottom 1 per cent of core outcome variables. Supplementary Appendix Table A2 shows the coefficients remain consistent with the baseline, confirming robust findings.
5.2.5. Excluding the influence of the pandemic period
To mitigate external uncertainty arising from the pandemic during 2020–2021, we re-estimate the model by excluding observations in this period (Zeng et al., Reference Zeng, Liu, Yan and Ma2025; Wang et al., Reference Wang, Xu, Li and Ma2026). Supplementary Appendix Table A3 shows that the sign and significance of coefficients remain consistent with the baseline, confirming the robustness of our findings.
5.3. Endogeneity tests
5.3.1. Instrumental variable test
To address endogeneity of the HEC policy, we adopt an instrumental variable (IV) approach, using county-level per capita daily domestic water consumption as the IV (Wang et al., Reference Wang, Zhang and Li2022a). Per capita daily water consumption is employed as an IV to address endogeneity concerns. It satisfies the relevance and exclusion restrictions, as it affects the key explanatory variable but does not directly influence the dependent variable, thus mitigating biases caused by reverse causality and omitted variables. It satisfies relevance (higher water consumption links to greater policy adoption likelihood) and exogeneity (determined by exogenous geographical factors). Supplementary Appendix Table A4 shows the IV is valid: the first stage confirms its positive correlation with the policy, while the second stage verifies the core explanatory variable's significant effects. Details are in the Supplementary Appendix.
5.3.2. Propensity score matching
To mitigate sample selection endogeneity in this quasi-natural experiment, we use propensity score matching (Yin et al., Reference Yin, Zhang, Chu, Tan and Qin2025), which is used to alleviate selection bias by balancing observable characteristics between the treated and control groups. By matching on covariates including economic development, industrial structure and resource endowment, this approach improves the reliability and robustness of the empirical results. Via annual 1:1 nearest-neighbour matching (covariates: population, industrial structure, natural conditions, fiscal status, agricultural development), each treated county is paired with a similar control one. Supplementary Appendix Table A5 shows matched-sample results align with baseline, supporting the robustness of H1.
5.4. Mechanism tests
This section further examines the mechanisms through which the basin-wide HEC policy balances environmental protection and economic development via three pathways: industrial restructuring, technological innovation and energy conservation. This study adopts a mediation analysis approach. We empirically test whether the HEC policy significantly affects each mediating variable, while the causal links between each mediating variable and the outcome variables are supported by theoretical analysis and existing literature to avoid endogeneity bias (Li et al., Reference Li, Huang and Liu2025; Ma et al., Reference Ma, Wang, He, Chai and Yu2025). The following proxy variables are used: the ratio of the value-added of secondary and tertiary industries to regional GDP measures industrial structure; total electricity consumption captures energy usage; and the number of patents approved indicates technological innovation. Regions with missing data were excluded.
5.4.1. Industrial restructuring effect
As shown in Column (1) of Table 3, the HEC policy has a significant positive effect on industrial structure, indicating that it promotes industrial upgrading by transforming environmental governance costs into endogenous incentives for structural adjustment, thereby enhancing the synergy between environmental protection and economic development. The policy encourages compensation-receiving counties to raise environmental thresholds and enforce stricter emission standards, driving the upgrading or exit of energy-intensive industries (Jingrong et al., Reference Jingrong, Haitao, Wenqing, Jiahui, Yi and Yaqin2024). Meanwhile, it redirects local development towards long-term ecological capital accumulation, aligning industrial upgrading with ecological carrying capacity and fostering sustainable development (Luo et al., Reference Luo, Cai, Qian and Xia2025). This process supports the balance between economic development and environmental protection in recipient counties, confirming Hypothesis H2.
Mediation tests

Table 3 Long description
Regression results assess how a policy dummy relates to the secondary to tertiary ratio outcome across three model specifications. The policy dummy coefficient is 0.006 in model 1, 0.701 in model 2, and minus 0.027 in model 3. Reported test statistics are 1.91 for model 1, 2.36 for model 2, and minus 2.55 for model 3, indicating the largest positive association appears in the patents model and a negative association appears in the energy consumption model. All models include county fixed effects, year fixed effects, and control variables. Sample sizes are 6,718 for model 1 and 6,709 for models 2 and 3. Model fit is high in models 1 and 3 with R squared values of 0.935 and 0.932, and lower in model 2 at 0.732. Coefficients reflect associations within the specified controls and fixed effects and should not be interpreted as definitive causal effects without additional identification details.
5.4.2. Technological innovation effect
Column (2) of Table 3 shows that the HEC policy significantly promotes technological innovation. It strengthens innovation incentives, supports corporate R&D investment and drives advances in clean energy, energy-saving, pollution control and resource recycling technologies (Ren et al., Reference Ren, Hu and Yu2024). By alleviating technological path dependence in traditional production, the policy reduces ecological damage and strengthens regional technological advantages, thereby improving the quality of economic growth in line with ecological capacity. These findings confirm Hypothesis H3.
5.4.3. Energy conservation effect
Column (3) of Table 3 indicates that the HEC policy significantly reduces energy consumption. The policy promotes more centralized and efficient energy use patterns, accelerates capacity integration and phases out decentralized and inefficient production capacity, thereby improving energy allocation efficiency through economies of scale. Such energy intensification brings systematic emission reduction benefits, lowers carbon intensity and enhances pollution treatment efficiency via centralized facilities (Gu et al., Reference Gu, Zheng, Tong and Dai2022; Guo et al., Reference Guo, Wang and Dong2022). Furthermore, higher energy efficiency enhances green total factor productivity, reduces carbon and pollutant emissions and transforms ecological advantages into economic benefits (Liu et al., Reference Liu, Hou and Jiang2023). This provides a practical pathway for counties to overcome ecological constraints and achieve a balance between economic growth and environmental protection, confirming Hypothesis H4.
6. Extended analysis
6.1. Heterogeneity analysis
The above analysis suggests that the basin-wide HEC policy can promote an overall balance between environmental protection and economic development. However, this average effect may mask regional variations due to substantial differences in industrial structure, ecological conditions and technological choices related to resource protection or exploitation across counties. First, water pollution intensity reflects regional pollution conditions, and regions with higher water pollution generally require greater investment (Wang et al., Reference Wang, Bodirsky, Rijneveld, Beier, Bak, Batool, Droppers, Popp, van Vliet and Strokal2024c). Second, spatial barriers caused by watershed topography lead to heterogeneous policy effects, as regions with lower terrain tend to incur lower costs for development and protection (Du et al., Reference Du, Zhao, Zhang, Li and Yu2023). Third, poverty contributes to unbalanced economic development and inconsistent standards for ecological investment and performance evaluation (Zhou et al., Reference Zhou, Liu, Wang and Cheng2023), further resulting in heterogeneous policy effects. Therefore, heterogeneity is analysed from the above three aspects.
6.1.1. Heterogeneity in water pollution levels
We use county-level wastewater discharge data – available from 2015 onward – to examine how the policy affects regions with different water pollution levels. Counties are divided into two groups: those with low water pollution (below the mean) and those with high water pollution (above the mean). To address heteroskedasticity and distributional differences between groups, a Fisher permutation test based on Bootstrap with 1,000 replications is used to assess coefficient differences. As shown in Table 4, following the implementation of the HEC policy, regions with severe water pollution show significant environmental improvements and better economic performance.
Heterogeneity analysis by water pollution level

Table 4 Long description
Regression results split by low versus high water pollution, with outcomes PM2.5 (logged) in models 1 and 2 and night-time lights (logged) in models 3 and 4. For PM2.5, the policy dummy is negative in both groups, with a small, not statistically strong estimate in low pollution areas (minus 0.020; t minus 1.13) and a much larger, statistically strong reduction in high pollution areas (minus 0.115; t minus 8.17). For night-time lights, the policy dummy is positive in both groups, with a modest, marginally significant increase in low pollution areas (0.275; t 1.68) and a large, statistically strong increase in high pollution areas (1.386; t 6.64). Between-group tests indicate the low versus high water pollution differences are statistically significant for both outcomes (p values 0.000 for PM2.5 and 0.001 for lights). All models include year and region fixed effects and control variables. Sample sizes are 1,216 for low water pollution and 2,899 for high water pollution, with R-squared values ranging from 0.674 to 0.805. Coefficients reflect associations conditional on included controls and fixed effects and do not by themselves prove causality.
This heterogeneity arises because heavily polluted areas achieve higher pollution reduction per unit of governance input. Coupled with stronger environmental regulation, these dual drivers push firms to increase green technology investment, creating a synergistic effect between emission reduction incentives and governance capacity, thus improving environmental quality (Zhang et al., Reference Zhang, Zhang and Z-z2023b). In less polluted regions, however, the policy effect is limited due to higher transition costs, diminishing marginal returns and weaker environmental policy incentives.
6.1.2. Heterogeneity in topographic conditions
We classify counties implementing the HEC policy into steep terrain (above-average slope) and gentle terrain (below-average slope). As shown in Table 5, counties with gentle terrain exhibit significant environmental improvements and better economic development.
Heterogeneity by terrain conditions

Table 5 Long description
Regression results split by terrain type estimate how a policy indicator relates to logged PM2.5 and logged night-time lights. For logged PM2.5, the policy effect is negative in both terrains, with a small decrease in steep areas (coefficient minus 0.017; t statistic minus 1.46) and a much larger decrease in flat areas (coefficient minus 0.238; t statistic minus 10.42). For logged night lights, the policy effect is positive in both terrains, increasing more in flat areas (2.632; t statistic 6.89) than in steep areas (0.696; t statistic 4.19). Between-terrain coefficient tests are reported as 0.000 for both outcomes, indicating the steep versus flat differences are statistically detectable. All models include year and region fixed effects and control variables. Sample sizes are 3,384 for steep terrain and 3,325 for flat terrain, with R squared values of 0.885 and 0.847 for PM2.5 models and 0.570 and 0.676 for light models. Coefficients describe associations conditional on included controls and fixed effects and should not be read as causal without additional identification details.
This difference may stem from the fact that steep-terrain counties have a good ecological background but weak marginal gains in environmental improvement, coupled with high transformation costs and poor market accessibility, which hinder ecological industrialization and economic growth (Shen et al., Reference Shen, Li, Qin and Cheng2023). In contrast, gentle-terrain counties benefit from industrial agglomeration and low transition costs, reduce pollution via green technology diffusion and develop green industries such as eco-tourism, achieving coordinated improvements in environmental governance and economic density.
6.1.3. Heterogeneity in poverty levels
According to the 2020 classification standard for national-level poor counties, the sample is divided into poor counties and non-poor counties. As shown in Table 6, the HEC policy has a significant positive effect on both environmental protection and economic development in non-poor counties.
Heterogeneity analysis by poverty status of counties

Table 6 Long description
Regression results compare policy effects in non-poor versus poor counties for two outcomes: logged PM2.5 and logged nighttime lights. For PM2.5, the policy coefficient is negative in non-poor counties (minus 0.100) and near zero in poor counties (0.012), indicating reductions only in non-poor areas. For nighttime lights, the policy coefficient is positive in non-poor counties (1.737) but negative in poor counties (minus 0.819), suggesting opposite associations by poverty status. Between-group tests report p-values of 0.000 for both outcomes, indicating statistically significant differences between poor and non-poor counties. All models include county and year fixed effects and control variables. Sample sizes are 5,093 for non-poor counties and 1,616 for poor counties, with high model fit (R-squared about 0.955 to 0.979). Coefficients reflect associations within the specified fixed-effects framework and should not be interpreted as definitive causal effects without additional identification details.
This heterogeneity may arise because poor counties are constrained by weak governance capacity and inadequate policy implementation, with a development priority on the economy. Most compensation funds are used for end-of-pipe treatment and basic public services, resulting in limited environmental improvement. Meanwhile, the lack of alternative livelihoods and imperfect environmental monitoring lead to significantly negative economic performance, creating a vicious circle of weak environmental governance and slow economic growth (Jayachandran, Reference Jayachandran2022). In contrast, non-poor counties use fiscal and technological advantages to allocate compensation funds to green industry upgrading and source pollution control. By promoting green innovation through market mechanisms, they form a virtuous circle of emission reduction and income growth, achieving simultaneous improvements in environmental quality and economic development.
6.2. Testing for moderating effects
To examine the moderating effects of fiscal transfers and human capital, interaction terms between the core explanatory variable and the moderating variables are introduced into the baseline model, constructing the following extended model:
 \begin{equation}{Y_{it}} = {\beta _0} + {\beta _1}DI{D_{it}} + \gamma {X_{it}} + \delta {R_{it}} + {\beta _2}DI{D_{it}} \times {R_{it}} + {\alpha _i} + {\theta _t} + {\varepsilon _{it}}.\end{equation}
In Equation (10),  ${R_{it}}$ represents the moderating variable, corresponding to fiscal transfers and human capital;
 ${\beta _2}$ denotes the coefficient of the interaction term, which is used to test the moderating effects of fiscal transfers and human capital; and
 $\delta $ is the coefficient of the moderating variable. Definitions of the remaining variables are consistent with the baseline model.
Building on analytical frameworks and indicator measurement methods established in prior studies (Wang et al., Reference Wang, Yin, He and Wang2024b), this study examines the moderating effects of fiscal transfers and human capital on the HEC policy. Fiscal transfers, quantified by county-level fiscal transfer payment amounts, alleviate local fiscal constraints and steer environmental governance practices. The results show that transfer payments amplify the positive effects of HEC on economic development and environmental protection (Supplementary Appendix Table A6, columns (1) and (2)). Transfer payments provide financial compensation and institutional incentives that directly support ecological restoration and pollution abatement. By linking environmental quality to fiscal allocation and performance evaluation, local governments are incentivized to shift from growth-oriented priorities to environmental performance competition, thereby phasing out polluting industries, raising green industry standards and optimizing industrial structure. Dedicated ecological funds also promote eco-agriculture and eco-tourism, forming an environment-friendly growth model.
Human capital is measured as the proportion of students enrolled in regular institutions of higher education in the total population. It enhances the effectiveness of policy implementation through knowledge spillovers (Zhao et al., Reference Zhao, Liu, Liu and Zheng2024b). The results indicate that human capital amplifies the positive effects of HEC on economic development and environmental protection (Table A6, columns (3) and (4)). Through knowledge spillovers, human capital improves policy effectiveness, reduces the cost of clean technology R&D, enables ecological compensation funds to be more efficiently converted into innovation inputs, and transforms ecological value into economic value, thus overcoming the traditional trade-off between environmental protection and economic growth. Detailed analyses are provided in the Supplementary Appendix (Afzal et al., Reference Afzal, Khan, Baig and Ashraf2023).
6.3. Limitations and future research
This study uses PM2.5 concentrations and nighttime light intensity as proxies for the eco-economic effects of watershed HEC, with several limitations in indicator selection. PM2.5 merely captures air quality improvements and cannot account for other key ecological objectives of the policy, such as water conservation and water quality restoration. As a crude aggregate measure of economic activity, nighttime light intensity cannot distinguish between the expansion of green industries and polluting industries, making it insufficient to identify high-quality economic structural transformation. Apart from measurement limitations, the IV constructed from household water consumption is not fully convincing, and the analysis of external validity outside the Yellow River Basin is relatively limited. Even so, these shortcomings do not compromise the core empirical results of this paper.
To address these shortcomings, future research should refine the selection of proxy variables by incorporating basin water quality and ecological product value to redress the ecological imbalance. Combined with metrics like green total factor productivity, the accuracy of measuring economic transformation can be enhanced. Furthermore, expanding the scope to other major river basins (e.g., Yangtze, Pearl River) would strengthen the external validity of the findings, while extending the observation window would facilitate long-term policy effect assessments. Collectively, these efforts would refine the evaluation framework to better align with the core goal of eco-economic synergy, providing robust support for the long-term implementation of river basin ecological compensation policies.
7. Conclusions and policy implications
Based on panel data from 529 counties (districts) in the Yellow River Basin, this study draws conclusions through a quasi-natural experiment as follows. First, the HEC policy significantly promotes the coordinated improvement of environmental protection and economic development, and the results remain robust after various endogeneity tests. Second, the policy exerts its effects through three key mediating channels, namely industrial structure adjustment, technological innovation and energy conservation and consumption reduction. Third, there is significant heterogeneity in the policy effects among counties with different water pollution levels, topographic conditions and poverty statuses, with more favourable performance in regions with severe water pollution, gentle terrain and non-poor areas. Fourth, both fiscal transfer payments and human capital play a positive moderating role in the policy effects, effectively amplifying its synergistic effects on environmental governance and economic growth.
Derived from these conclusions, the policy implications are as follows:
Clarify compensation standards. Define compensation standards at all levels explicitly and adjust them dynamically based on verifiable improvements in water quality and ecological restoration. Expand diversified financing channels (e.g., special funds, social capital, water rights and carbon sink markets), innovate market-oriented tools such as water rights trading, and establish a governance framework featuring ‘government leadership, market supplementation, and public participation’. Develop a long-term incentive mechanism based on the principle of ‘beneficiaries pay and protectors benefit’ to enhance fund efficiency and stimulate the participation of enterprises and social organizations.
Leverage policy instruments. Promote industrial transformation by constructing basin green industry bases and ecological product supply-demand chains between upstream and downstream regions. Phase out high-pollution capacity with phased compensation for affected enterprises. Establish a basin green technology R&D fund, support key technologies such as wastewater treatment, and build an ecological big data platform for cross-regional monitoring. Allocate 5 per cent of the compensation funds as a special energy-saving fund to support new energy projects and circular economy parks, so as to foster energy conservation synergy across the entire basin.
Adopt differentiated regional strategies. For mountainous counties, raise the compensation standards by 20–30 per cent to cover transformation costs and support the development of characteristic industries such as under-forest economy. For poor counties, increase subsidies by 10–15 per cent, convert part of the compensation funds into wages for eco-friendly public welfare posts, and boost industries including ecological agricultural product processing, so as to achieve a win-win outcome between ecological protection and poverty alleviation. Strengthen fund supervision, prioritize the investment of compensation funds in green projects, and establish a third-party performance evaluation mechanism. Cooperate with universities to carry out targeted training, build a cross-regional talent network and promote the diffusion of technologies and knowledge.
Supplementary material
The supplementary material for this article can be found at https://doi.org/10.1017/S1355770X26100709.
Competing interests
The authors declare none.



