INTRODUCTION
A range of methods, such as statistical, estimation of production components, agroclimatic models or remote sensing, have been used to develop yield forecasting models for a large number of crops (Cunha et al. Reference Cunha, Abreu, Pinto and Castro2003; Beed et al. Reference Beed, Paveley and Sylvester-Bradley2007; Jaggard et al. Reference Jaggard, Qi and Semenov2007; Ji et al. Reference Ji, Sun, Yang and Wan2007; Sepulcre-Cantó et al. Reference Sepulcre-Cantó, Zarco-Tejada, Jiménez-Muñoz, Sobrino, Soriano, Fereres, Vega and Pastor2007; Soler et al. Reference Soler, Maman, Zhang, Mason and Hoogenboom2008; Ko et al. Reference Ko, Piccinni, Guo and Steglich2009) at a range of scales (plot, region or country).
In olives, potential crop yield is dependent upon several factors such as number of trees per area, number of flowers per tree, fruit set rates and fruit weight. However, many environmental factors are primarily responsible for the reduction from potential yield throughout the annual growing cycle.
The aeropalynological approach has been used for regional forecasting of olives in a large number of countries (Galán et al. Reference Galán, Vásquez, García-Mozo and Domínguez2004, Reference Galán, García-Mozo, Vázquez, Ruiz, Díaz De La Guardia and Domínguez-Vilches2008; Fornaciari et al. Reference Fornaciari, Orlandi and Romano2005; Orlandi et al. Reference Orlandi, Romano and Fornaciari2005; Ribeiro et al. Reference Ribeiro, Cunha and Abreu2007b). This method recognizes that (i) the number of flowers per unit of ground area is superior in the most productive years and (ii) greater numbers of trees per area release more pollen into the atmosphere. Together, these result in higher pollen production and therefore higher airborne pollen concentrations. It also enables the integration of all pre-flowering conditions, carried over from the past year(s), which affect fruit production. Thus, by obtaining a quantitative index of this airborne concentration (the regional pollen index, RPI), it should be possible to determine the relationship with regional annual olive production (Cunha et al. Reference Cunha, Abreu, Pinto and Castro2003). However, aeropalynological models do not consider post-flowering conditions, such as water deficit or phytopathological problems, which may negatively affect fruit retention and weight, reducing the actual yield from the production potential acquired at flowering. Thus, the inclusion of post-flowering variables to the models should increase the accuracy of the forecast.
Some key components of yield forecasting models include water balance and the favourable conditions for the occurrence of phytopathological attacks.
The biomass and fruit production of several species are related to crop evapotranspiration (Lavee et al. Reference Lavee, Nashef, Wodner and Harshemesh1990; Orgaz et al. Reference Orgaz, Mateos and Fereres1992; Moriana et al. Reference Moriana, Orgaz, Pastor and Fereres2003; Grattan et al. Reference Grattan, Berenguer, Connell, Polito and Vossen2006) and water deficit situations have a great impact on olive development, leading to reductions in the number, size, density and oil content of fruits (Lavee & Wodner Reference Lavee and Wodner1991; Chartzoulakis et al. Reference Chartzoulakis, Michelakis and Tzompanakis1992; Giorio et al. Reference Giorio, Sorrentino and D'Andria1999; Patumi et al. Reference Patumi, D'Andria, Marsilio, Fontanazza, Morelli and Lanza2002; Moriana et al. Reference Moriana, Orgaz, Pastor and Fereres2003; Bacelar et al. Reference Bacelar, Santos, Moutinho-Pereira, Gonçalves, Ferreira and Correia2006; Lavee et al. Reference Lavee, Hanoch, Wodner and Abramowitch2007).
The occurrence of phytopathological attacks is especially dependent on weather constraints namely warm temperatures, rain and high levels of humidity, which are important in controlling disease or pest outbreaks and severity. For example, in Portugal, attacks on olive fruits by the fungus Gloeosporium olivarum or the olive fruit fly Bactrocera oleae are associated with the first autumn rains and temperatures of c. 15–25°C (Cardoso et al. Reference Cardoso, Bento and Torres2006; Talhinhas et al. Reference Talhinhas, Martins, Ramos, Sreenivasaprasad, Neves-Martins and Oliveira2006).
The aim of the present study was to develop a hierarchical bioclimatic forecasting model, based on airborne pollen, water stress during fruit growth and conditions favourable for the occurrence of phytopathological attacks during fruit maturing that allow an accurate and early season indication of olive crop yields. The model was developed to permit the forecasting update throughout the growing season.
MATERIALS AND METHODS
Study area and olive production
The present study was conducted in the south-eastern area of the Alentejo olive-growing region (comprising the sub-regions of Alto (high) Alentejo, Alentejo Central and Baixo (low) Alentejo regions), located in the south of Portugal. The landscape of the region is mostly one of soft rolling hills and plains; the climate is mesomediterranean and the olive post-flowering period is characterized by intense and extended water and thermal stress. Long-term weather records from reference climatological normals (1961/90) provided by the Portugal Meteorological Institute (Moita & Mendes Reference Moita and Mendes2007), showed the average minimum temperature in winter varied from 2 to 6°C and the average maximum temperature in summer varied from 30 to 34°C. The average annual number of hot days (maximum temperature higher than 35°C) ranged from 10 to 30 days. The mean annual accumulated precipitation varied from 500 to 800 mm, ranging from 150 to 300 mm in winter, 100 to 200 mm in spring and autumn and <50 mm in summer (Miranda et al. Reference Miranda, Coelho, Tomé, Valente, Santos, Forbes and Moita2001).
Information on the annual olive fruit production expressed in tonnes (t) of olive harvested in these sub-regions was obtained from the Statistical National Institute of Portugal (Statistics Portugal 2007). The meteorological information was provided by one meteorological station of the Centro de Geofísica de Évora, located in Reguengos de Monsaraz, c. 5 km from the sampling point.
Model variables
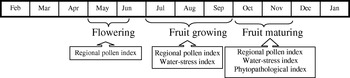
The bioclimatic forecasting model was adjusted to the olive fruit production using the following as independent variables: (i) an RPI, (ii) a plant water requirement index (PWRI) and (iii) a phytopathological index (PPI). Each variable was added to the model as the reproductive cycle progressed from flowering to maturing (Fig. 1).
Bioclimatic forecasting model algorithm.

Olive pollen was sampled during the flowering period, from 1999 to 2007, using a Cour trap (Cour Reference Cour1974) installed in Reguengos de Monsaraz (38°0′N, 7°51′W; 15 m asl). Pollen grains were trapped on vertical gauze filters (each exposed for 3 or 4 days), fixed vertically on a wind-vane, which continually orientated the filters according to the wind direction. After exposure, the pollen was removed from the filter, quantification was carried out on three regular traverse rows of the optic microscope (magnification ×630) and the average daily pollen was expressed as number of pollen grains transported/m2 of filter/day (Cour Reference Cour1974). The RPI was determined using a pollen emission model (Cunha et al. Reference Cunha, Abreu, Pinto and Castro2003; Ribeiro et al. Reference Ribeiro, Cunha and Abreu2007a), which fits a non-linear logistic function to the values of the accumulated sum of daily airborne pollen concentration sampled during the main pollination season.
The PWRI was determined as the sum of the daily differences between the crop evapotranspiration (ETc) and precipitation during August, representing the fruit-growing phase. Irrigation was not considered because 0·87 of the Alentejo olive area is rainfed, while the rest is managed under deficit irrigation. It is therefore difficult to estimate the irrigation level at the regional scale.
The reference evapotranspiration was calculated following the recommendations of the FAO document No. 56 (Allen et al. Reference Allen, Pereira, Smith and Raes1998) using the Hargreaves equation:

where ET0 is the reference evapotranspiration (mm/d); T mean, T maximum and T minimum are the monthly mean, maximum and minimum temperatures (°C); R a is the average daily extraterrestrial radiation (mm/d; R a depends on the number of the day in the year and latitude, and can be computed using the coefficient of 0·408 for converting MJ/m2/day into mm/day as described by Allen et al. (Reference Allen, Pereira, Smith and Raes1998) ); nd is the day of the month.
The crop evapotranspiration (ETc: mm/d) was calculated using the crop coefficient value for August (K c=0·45) reported by Orgaz & Fereres (Reference Orgaz, Fereres, Barranco, Fernandez-Escobar and Rallo1999) :

The PPI was calculated as the number of days with occurrence of rainfall and that registered a mean temperature between 15 and 25°C from September to October.
Estimation and validation of the bioclimatic forecasting model
Three bioclimatic models were fitted, using a stepwise multiple regression analysis, at three different stages of olive reproductive development: (i) at flowering, (ii) at fruit growth and (iii) at fruit maturing.
The regression analysis was evaluated and internally validated using the coefficient of determination (R 2), the adjusted R 2 and the proportional deviation between the real production data and the data adjusted to the bioclimatic model. The adjusted R 2 is a better indicator of the adjusted quality, as the addition of a new variable to the model only leads to the increase of this value if the error variance decreases in relation to the total variance:

where n is the sample size and p is the total number of regressors in the linear model (but not counting the constant term).
The standardized model parameters estimates (β_std) were calculated in order to compare the relative contribution of each variable to the regression model.
The global significance of the model and its parameters estimated were evaluated by an analysis of variance (ANOVA) and by multiple t-tests performed on each parameter estimate. Also, a scatterplot of the standardized residuals against the predictors and a Durbin–Watson test and a Kolmogorov–Smirnov test were performed on the residuals to assess model assumptions such as linearity and to verify residuals had constant variance, null covariance and a normal distribution. The degree of collinearity between the independent variables and the potential presence of outliers were evaluated using respectively the variance inflation factors and the leverage statistics. In addition, the correlation matrix for yield, RPI, PWRI and PPI was calculated to ascertain the degree of association between these four random variables.
Since the database available for the present study only comprises 9 years, the external validation of the forecasting models developed was performed using leave-one-out (LOO) cross-validation, which evaluates the model prediction performance for a year not considered in the estimation step and provides independent estimates of the predictive power of the selected models. This process was sequentially performed until all the years of the database have been omitted once (Gommes et al. Reference Gommes, Das, Mariani, Challinor, Tychon, Balaghi and Dawod1981). All calculations were performed using the software SPSS 16.0 (SPSS for Windows 2007).
RESULTS
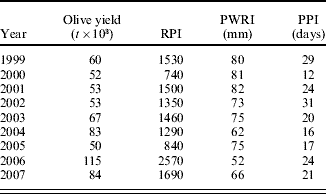
During the period studied, Alentejo olive fruit production was characterized by a yearly variability (coefficient of variability (CV) 0·31). The highest fruit production of the last 20 years was in 2006, and the annual average production during the study period was c. 68 000 t (Table 1).
Values of the variables considered in the olive fruit production bioclimatic forecasting model for south-eastern Alentejo region during the studied period (1999–2007)

RPI, regional pollen index.
PWRI, water requirements during August.
PPI, number of days with the occurrence of precipitation and mean temperature between 15 and 25°C from September to October.
Pollen capture revealed the main olive pollen season occurred between May and July and lasted on average 2 weeks (minimum 11 days, maximum 24). The highest RPI was registered in 2006, the lowest in 2000 (Table 1).
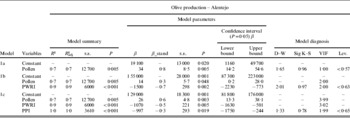
The multiple regression analysis results and statistical validation of the bioclimatic models estimated for the regional olive production of Alentejo, at the three different stages of the olive growing season (flowering, fruit growth and fruit maturing), are presented in Table 2.
Regression results, significance of variables, model diagnostics, measures of model adequacy and estimates of the regression coefficients for the bioclimatic model estimated for the regional olive production of south-eastern Alentejo at three different stages of the olive growing season

1a, forecasting at flowering; 1b, forecasting at the end of fruit growth; 1c, forecasting at fruit maturing; PWRI, water requirements during August; PPI, number of days with the occurrence of precipitation and mean temperature between 15 and 25°C from September to October; R 2, determination coefficient; R adj2, adjusted determination coefficient; s.e., standard error; sig, significance; K–S, Kolmogorov–Smirnov, D–W, Durbin–Watson; VIF, variance inflation factor; Lev, leverage.
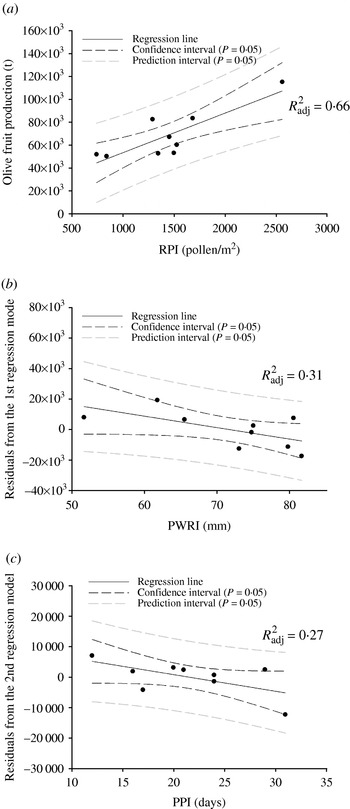
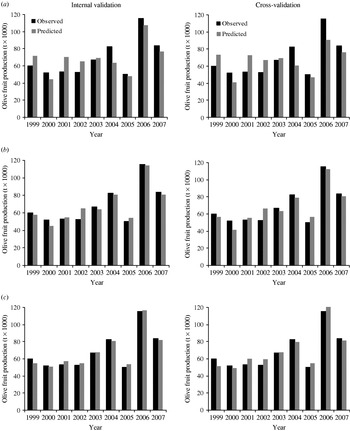
At flowering, the RPI explained 0·66 of the regional fruit production interannual variability (Table 2, model 1a) and the average deviation between observed and predicted production was 0·15 (maximum of 0·33 in 2001) (Fig. 3 a). The external validation of this forecasting model, using the LOO cross-validation method, showed an average deviation between observed and predicted production of 0·19 (maximum of 0·37 in 2001).
The bioclimatic forecasting model fitted at the fruit growing stage showed that 0·92 of the regional olive production could be explained by the RPI and PWRI (Table 2, model 1b). Analysing the standardized model parameter estimates (β_std), it was observed that the RPI influence on production was positive while that of the PWRI was negative. It is also possible to see in Fig. 2 b how much of the lack of fit from the pollen variable is explained by PWRI, as well as the region of uncertainties in which future observations will fall over a range of values for the PWRI. In fact, the regression line has a negative slope, confirming the negative influence of PWRI on yield prediction.
Scatter plots with fitted regression line, confidence interval (P=0·05) and prediction interval (P=0·05) of (a) actual yields plotted v. RPI; (b) residuals from the first regression model v. PWRI and (c) residuals from the second regression model v. PPI.

The average deviation between observed and predicted production was 0·07 (maximum 0·23 in 2002) for the internal validation and of 0·09 for the cross-validation with the maximum 0·26 in 2002; Fig. 3 b).
Differences in percentage between observed and predicted fruit production obtained in the models internal validation and cross-validation (a) forecasting at flowering (b) forecasting at the end of fruit growth and (c) forecasting at fruit maturing.

In the fruit-maturing phase, the addition of the PPI as the third independent variable of the bioclimatic model enabled an increase in accuracy of the interannual regional olive fruit production forecast to 0·97 (Table 2, model 1c). According to the β_std of this final bioclimatic model, the RPI is the variable with higher influence on the prediction of fruit production. The influence on production of the PPI was negative and had a smaller influence than did the PWRI. Figure 2 c shows how much of the lack of fit from the RPI+PWRI model is explained by PPI, as well as the region of uncertainties in which future observations will fall over a range of values for this independent variable. Similarly to PWRI, the regression line has a negative slope, confirming the negative influence of PPI on yield prediction.
The average deviation between observed and predicted production decreased to 0·04 (maximum 0·09 in 1999) for the internal validation, while for the external validation the average deviation decreased to 0·07 (maximum 0·14 in 1999; Fig. 3 c).
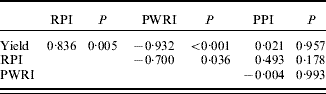
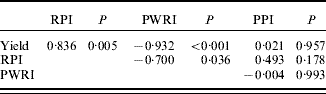
The three model diagnostic results showed firstly that the global values of the regression model and its parameters were statistically significant (P<0·05). Secondly, the residuals were randomly distributed around the value zero of the standardized prediction indicating constant variance, the Durbin–Watson statistics were within the non-rejection of the H 0 hypotheses for residuals covariance and the significance values associated with the Kolmogorov–Smirnov test performed on the residuals were higher than 0·05, the value below which the hypothesis of the normality of the residuals is rejected. Thirdly, the variance inflation factors (VIFs) values indicated the non-existence of multicollinearity between the independent variables; also, the correlation matrix (Table 3) between the model variables showed only significant correlations between the variable yield and the other three random variables. Fourthly, the leverage values were lower than the limit 1·00, indicating the non-existence of outlier observations.
Correlation matrix for all four random variables (yield, RPI, PWRI and PPI) considered in the development of the bioclimatic forecasting model
DISCUSSION
In Portugal, cultivation of olives plays an important economic, social and cultural role, especially in the Alentejo region, which is the country's largest olive production area, accounting for 0·30 of the olive production of the country. Over the period studied, olive fruit production in Portugal was characterized by a strong interannual variation. Olive production in Portugal for the last 22 years has an interannual variation of 0·32 compared with the country's olive area, which only varied 0·05. Production in the 2006 season was the highest in the last 20 years (approximately twice that of 2005), but in 2007, production decreased to 2004 levels. This strong interannual variation emphasizes the importance of a reliable, operational and early season quantitative forecasting model for harvest, supporting the decision-making process of all the involved in the olive sector.
The present results showed that the RPI explained more than 0·66 of the olive production interannual variability, showing the importance of this index to forecast. This has also been demonstrated by other authors, for Andalusia in Spain (R 2=0·75, Galán et al. Reference Galán, Vásquez, García-Mozo and Domínguez2004), for Seville in Spain (R 2=0·62, González-Minero et al. Reference González-Minero, Candau, Morales and Tomas1998), for Florence (R 2=0·84) and Prato in Italy (R 2=0·69, Moriondo et al. Reference Moriondo, Orlandini, De Nuntiis and Mandrioli2001), for Perugia in Italy (R 2=0·54, Orlandi et al. Reference Orlandi, Romano and Fornaciari2005) and for France (R 2=0·74, Abid Reference Abid1984).
The relationship between the RPI and production has also been reported for other crops such as Vitis vinifera (Cristofolini & Gottardini Reference Cristofolini and Gottardini2000; Cunha et al. Reference Cunha, Abreu, Pinto and Castro2003) or Poaceae (Muñoz et al. Reference Muñoz, Silva and Tormo2000). The RPI has the advantage of giving information at a regional scale. It allows easy updating of the regional olive surface development, since it is based on the assumption that a higher number of trees per area, or more productive clones, produce more inflorescences, which, in turn, produce more flowers, thereby generating a higher RPI at the flowering period. Therefore, technology change related to new plantations, more productive clones or exploration systems can be reflected by the RPI.
Despite the good fit between the RPI and the regional fruit production observed in the present study, in some years the maximum deviation between observed and predicted production was high. For instance, in 1999, 2001 and 2002 low yields were obtained (compared with the other years studied), although the calculated RPI values were high. This lack of realization of potential yield is related to post-flowering conditions that influence the fruit growth and maturation periods, (González-Minero et al. Reference González-Minero, Candau, Morales and Tomas1998; Moriondo et al. Reference Moriondo, Orlandini, De Nuntiis and Mandrioli2001; Galán et al. Reference Galán, Vásquez, García-Mozo and Domínguez2004). The years 1999, 2001 and 2002 had high water requirements and high phytopathological indices, both of which have a negative effect on yield.
The addition of post-flowering variables to the forecasting model permits updating of the forecast during the growing season, reducing the final error. However, the aeropalynological model highlights the importance of the pre-flowering and flowering period in the interannual fruit production fluctuations and permits a forecast 6–7 months before the harvest, establishing a first estimate of the potential crop production acquired at this stage.
Several authors have used post-flowering variables, such as meteorological parameters, to represent the influence of favourable or unfavourable conditions on the final fruit production (Moriondo et al. Reference Moriondo, Orlandini, De Nuntiis and Mandrioli2001; Cunha et al. Reference Cunha, Abreu, Pinto and Castro2003; Galán et al. Reference Galán, Vásquez, García-Mozo and Domínguez2004; Fornaciari et al. Reference Fornaciari, Orlandi and Romano2005). In the present bioclimatic models, the RPI summarizes the historical pre-flowering conditions throughout the reproduction cycle of the plant, while the weather conditions can explain the unpredictable aspects (Fornaciari et al. Reference Fornaciari, Orlandi and Romano2005) that are associated with the decrease in potential yield acquired during the flowering season.
According to Selles van Sch et al. (Reference Selles Van Sch, Ferreyra, Selles and Lemus2006), the most sensitive olive development stages to water deficit are those involving cell division and enlargement, which occur in the fruit during summer. Water deficit conditions may influence the fruit volume, weight, pulp/pit ratio and oil content (Patumi et al. Reference Patumi, D'Andria, Marsilio, Fontanazza, Morelli and Lanza2002; Grattan et al. Reference Grattan, Berenguer, Connell, Polito and Vossen2006). The updating of the bioclimatic forecasting model at the end of the fruit growth period, with the addition of a PWRI, aimed at identifying a quantitative indicator for the water deficit influence in olive fruit production. Several authors have reported the existence of a positive relationship between olive fruit production and the amount of water applied during the summer months (Proietti & Antognozzi Reference Proietti and Antognozzi1996; Moriana et al. Reference Moriana, Orgaz, Pastor and Fereres2003; Grattan et al. Reference Grattan, Berenguer, Connell, Polito and Vossen2006; Lavee et al. Reference Lavee, Hanoch, Wodner and Abramowitch2007). This was confirmed in the present study, with PWRI having a negative influence on the fruit production. This independent variable improved the accuracy of the interannual regional olive fruit production forecast by 0·27 compared with the forecasting model estimated at flowering. Water deficits also have an influence on the production in the following year, since summer also coincides with the period of initiation of reproductive buds (Proietti & Antognozzi Reference Proietti and Antognozzi1996; Goldhamer Reference Goldhamer1999; Grattan et al. Reference Grattan, Berenguer, Connell, Polito and Vossen2006; Selles van Sch et al. Reference Selles Van Sch, Ferreyra, Selles and Lemus2006), affecting the number of flower clusters. This emphasizes the importance of the RPI as a variable in fruit production because in years with lower numbers of flowers, the amount of pollen produced will also be lower.
The bioclimatic forecasting model estimated at the fruit growing stage achieved higher adjusted determination coefficients (R 2=0·93) than those obtained by other forecasting models developed for Cordoba in Spain (R 2=0·83, Galán et al. Reference Galán, Vásquez, García-Mozo and Domínguez2004) and for Prato in Italy (R 2=0·77, Moriondo et al. Reference Moriondo, Orlandini, De Nuntiis and Mandrioli2001), also using airborne pollen and post-flowering variables. Furthermore, the ability of the bioclimatic forecasting model developed to explain why the olive production was also higher when compared with the results obtained for the forecasting of olive production using the amount of applied water (Grattan et al. Reference Grattan, Berenguer, Connell, Polito and Vossen2006) or even the value of crop evapotranspiration (Moriana et al. Reference Moriana, Orgaz, Pastor and Fereres2003). Nevertheless, the years 2000 and 2002 still presented a deviation between observed and predicted production greater than 10%. In 2002 the realization of yield was lower than predicted, while in 2000 the reverse was observed. Both years presented a similar final yield and high PWRI; however, in 2002 the PPI was the highest of all years studied. This situation indicates that the low degree of realization of potential yield, acquired at the end of fruit growing phase, can be explained by the existence of adverse conditions, i.e. those leading to the development of phytopathological problems and potential vulnerability of fruit to damage during maturation.
In the last phase of the bioclimatic forecasting model estimation (fruit maturing period), a PPI was added, which was determined based on the relationship between a plant's pest and disease bioecology and the meteorological parameters.
In Portugal, the most important attacks of olive pests and diseases occur during flowering and fruit maturing, which correspond to periods when temperatures and relative humidity conditions are favourable for their development (Cardoso et al. Reference Cardoso, Bento and Torres2006; Talhinhas et al. Reference Talhinhas, Martins, Ramos, Sreenivasaprasad, Neves-Martins and Oliveira2006). When the attacks occur before or during flowering, their effects are incorporated into the amount of pollen produced. Therefore, this early damage can be indirectly measured by the forecasting model through the RPI. However, when the fruits are attacked, obtaining a quantitative index for the losses is not easy to achieve although losses can be observed in the field. In the present study, the PPI allowed an update in the forecasting accuracy of 0·06 and a considerable reduction in the average deviation between observed and predicted production in both the internal and cross validations.
The diagnosis and parameters of the forecasting models estimated along the olive growing season were statistically significant, showing the ability of the bioclimatic model to explain and predict the annual variability of olive fruit production in the Alentejo region.
The main conclusions of the present work were that the bioclimatic model developed in the study was able to explain 0·97 of the interannual variability in Alentejo olive fruit production, with an average deviation from the observed production of 0·04 and of 0·07 for the cross-validation; the RPI was the variable with the highest influence on olive yield (0·66), followed by the PWRI. The hierarchical nature of the bioclimatic model, estimated at three different development stages, enabled an update during the growing season from flowering and fruit maturing. The ability of the forecasting bioclimatic model to explain olive production was increased by the addition of the post-flowering variables PWRI and PPI. These two variables were good quantitative indicators of water stress and potential climatic situations that could lead to phytopathological attacks with an influence on olive fruit yield.
The reliability and early indication ability of the crop forecast model developed can justify its use by farmers, institutions and governments in decision-making or adoption of technical improvements. Governments can use forecast information to implement regulator mechanisms (e.g. price policy, assign economic aid, stock management or to establish channels of communication among producing countries to prevent market shortages and uncontrollable price rises), moderating the effects of year to year crop variability. For growers, forecasts can provide a basis to establish crop-growing practices aimed at optimal product quality, to develop marketing strategies and to determine labour and equipment requirements for harvest.
The authors would like to acknowledge the Centro de Geofísica de Évora for the meteorological data. The first author would like to thank the Fundação para a Ciência e Tecnologia SFRH/BD/13148/2003 for support.