Implications
A model is proposed to simulate the interactions between management, individual pig characteristics and farm infrastructure and their effects on technical, economic and environmental performance of a pig fattening unit. After external validation, this model will be used to compare management strategies and will be included in a decision support tool for on-farm application.
Introduction
European pig production continues to encounter economic and environmental challenges. The increase and variability in feed ingredient prices combined with fluctuations in pig prices reduces the stability of pig farms’ economic margins. The cost of feed accounts for 60% to 75% of the total pig production cost, in which fattening feed is a major portion (Mullan et al., Reference Mullan, Moore, Payne, Trezona-Murray, Pluske and Kim2011). Pig production systems have a significant impact on water eutrophication, acidification, and greenhouse gas emissions (McAuliffe et al., Reference Koch and Salou2016). Two main mechanisms that have been explored to reduce environmental impacts of pig production include improving management of pig nutrition and manure storage and treatment. Reducing impacts of the fattening unit is a major concern because fattening pigs produce ~70% of the phosphorus (P) and nitrogen (N) emissions of farrow-to-finish farms (Dourmad et al., Reference Dourmad, Sève, Latimier, Boisen, Fernandez, van der Peet-Schwering and Jongbloed1999).
To address these challenges, farmers must understand trade-offs between technical, economic and environmental performances of the pig fattening unit. Livestock farming systems are complex because they are structured by interactions between biological and human-controlled processes, and their behaviour is not always predictable. Consequently, farmers need decision support systems that rely on dynamic models of the multiple performances of the pig fattening unit. Variability in amino acid and net energy (NE) requirements among pigs greatly influences the heterogeneity in growth performance, nutrient excretion and slaughter weight. A modelling approach is suitable for simulating behaviour of the fattening unit system because it represents interactions among its components. Most published pig fattening models predict effects of nutrition on growth performance of an average pig (Pomar et al., Reference Pomar, Kyriazakis, Emmans and Knap2003; van Milgen et al., Reference van Milgen, Valancogne, Dubois, Dourmad, Seve and Noblet2008; Niemi et al., Reference Niemi, Sevon-Aimonen, Pietola and Stalder2010) without simulating effects of animal performance on associated economic margin or environmental impacts. A few models associate economic efficiency (Lurette et al., Reference McAuliffe, Chapman and Sage2008; Niemi et al., Reference Niemi, Sevon-Aimonen, Pietola and Stalder2010) or nutrient excretion (Chardon et al., Reference Chardon, Rigolot, Baratte, Espagnol, Raison, Martin-Clouaire, Rellier, Le Gall, Dourmad, Piquemal, Leterme, Paillat, Delaby, Garcia, Peyraud, Poupa, Morvan and Faverdin2012) with farmers’ strategies or consider variability in performance among individuals. Different studies have shown that simulated response of performance of a group of pigs to feeding practices is closer to observed performance when using an individual-based model instead of an average animal model, as individual-based models account for the variability of nutritional requirements among pigs (Pomar et al., Reference Pomar, Kyriazakis, Emmans and Knap2003; Brossard et al., Reference Brossard, Vautier, van Milgen, Salaun and Quiniou2014). The optimisation model of Ferguson (Reference Ferguson2015) considers variability in performance among pigs and its interaction with feed and shipping practices to calculate technical and economic performances of a batch of pigs. To our knowledge, no dynamic pig fattening unit model considers individual variability in performance among pigs, farmers’ feeding practices and animal management and also estimates environmental impacts (calculated using Life Cycle Assessment (LCA)) and economic results of the fattening unit.
Our objective was to develop a pig fattening unit model able to (i) simulate individual pig performance (including its variability) in interaction with farmers’ practices and management and (ii) assess effects of all three on technical, economic and environmental performances. This paper describes principles and assumptions of the model and illustrates its potential via application.
Model description
Overview of model structure
The fattening unit model is a discrete event, mechanistic, individual-based model which is stochastic for biological traits (pig intake, growth potential and mortality) and has a 1-day time step. The model, based on object-oriented programming, includes several classes: the ‘pig herd’ with fattening ‘pigs’, the ‘farmer’ with farm management, and the farm infrastructure with fattening ‘rooms’ and their associated ‘pens’ (Supplementary Material Figure S1). In the following description, the names of classes (e.g. ‘farmer’, ‘pig’) refer to objects described in the model. The pig herd is divided into successive batches composed of groups of pigs which are the same age and are bred together from fattening to shipping to the slaughterhouse. Farm management is represented by practices and a calendar of events containing tasks to perform. Each day the farmer receives information from the herd and the calendar of events. Based on this information, the calendar is updated by adding or removing tasks. At each time step in the simulation, the events corresponding to the current day are read in the calendar and processed. The practices include batch management, allocation of pigs to pens, feeding practices and slaughter shipping practices. The model simulator was implemented using Python 3 language.
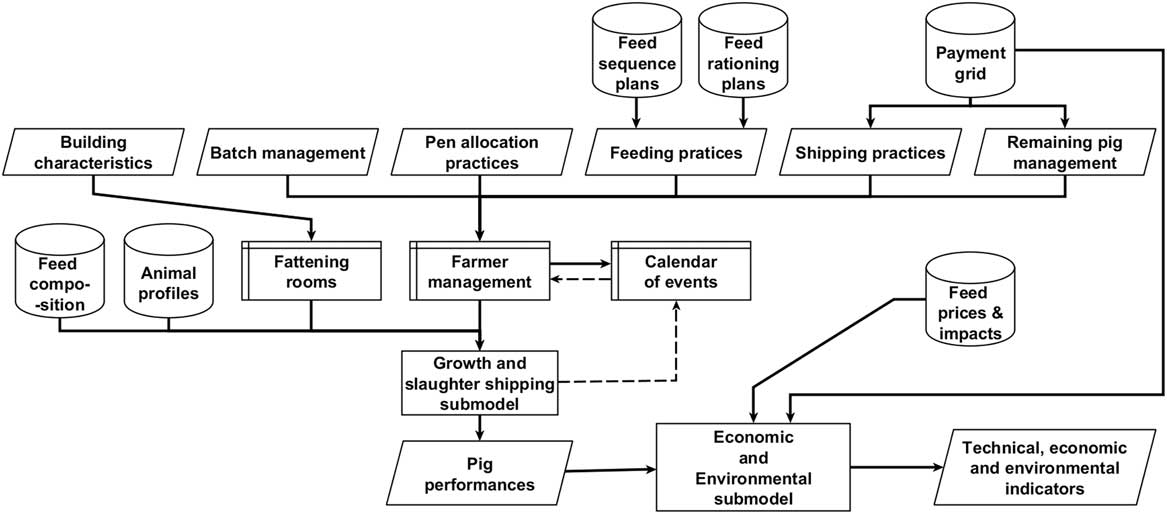
The farmer uses practices, the main inputs of the model (Supplementary Material Table S1), to determine farm management: the interval between the arrival of two successive batches, how pigs are grouped in pens (e.g. at random, according to sex and/or BW), the feeding plan, and how to plan shipping and select the pigs which are shipped to the slaughterhouse (Figure 1). Other inputs include animal profiles (which describe variability among pigs), building characteristics and feed composition. Information about farm management, fattening rooms and animal profiles are sent to the growth and slaughter shipping submodel, which simulates batch arrival and allocation to rooms and pens, daily growth of pigs and shipping to the slaughterhouse. It sends the pigs’ performances to the economic and environmental submodel, which calculates technical, economic and environmental indicators.
Diagram of the fattening unit model.

Buildings and animal housing
The building is represented by the number of fattening rooms, which is provided as input to the model. Each room contains an identical number of pens. The area allocated per pig in each pen is used to initialise the size of the pen at the beginning of the simulation. After shipping the last pigs in the batch to the slaughterhouse or to a buffer room, the room is considered empty after a cleaning and disinfection period. A buffer room can be used at the end of the fattening period to finish fattening the lightest pigs which have not reached the minimum slaughter weight (SW) without penalties.
Batch management
Upon arrival at the fattening unit, the pigs in each batch are allocated to a single room and distributed among its pens to have the same number of pigs per pen. The interval between the arrival of two successive batches, the size of each batch, and how pigs are allocated to the pens are scheduled in farm management by the farmer. As mentioned, pigs can be allocated to pens at random, by weight, by sex or by sex and weight. The allocation by weight means that pigs of similar weight are put in the same pen, inducing difference of mean weight between pens. When allocating by weight, if the number of pigs per pen is unequal, the pens with the lightest pigs contain more pigs than the pens with the heaviest pigs. When allocating by sex, each pen contains pigs of the same sex, except for one pen in which sexes can be combined to distribute pigs equally among all pens. When allocating by sex and weight, each pen contains pigs of the same sex and similar weight, except for one pen, which by default contains the lightest pigs and may contain both sexes.
Shipping to the slaughterhouse
The process for planning when to ship a group of pigs is based on the range of optimal SWs which have the highest premium in the payment grid. The French payment grid, used by default, is composed of ranges of weights associated with various prices per kg of carcass. In the model, MinWr is the minimum SW without cost penalties, and TarWr is the target SW, which lies in the middle of the range of SW with the highest premium. The model assumes that there is no limit to the number of pigs that can be shipped and that no unforeseen events occur on shipping day.
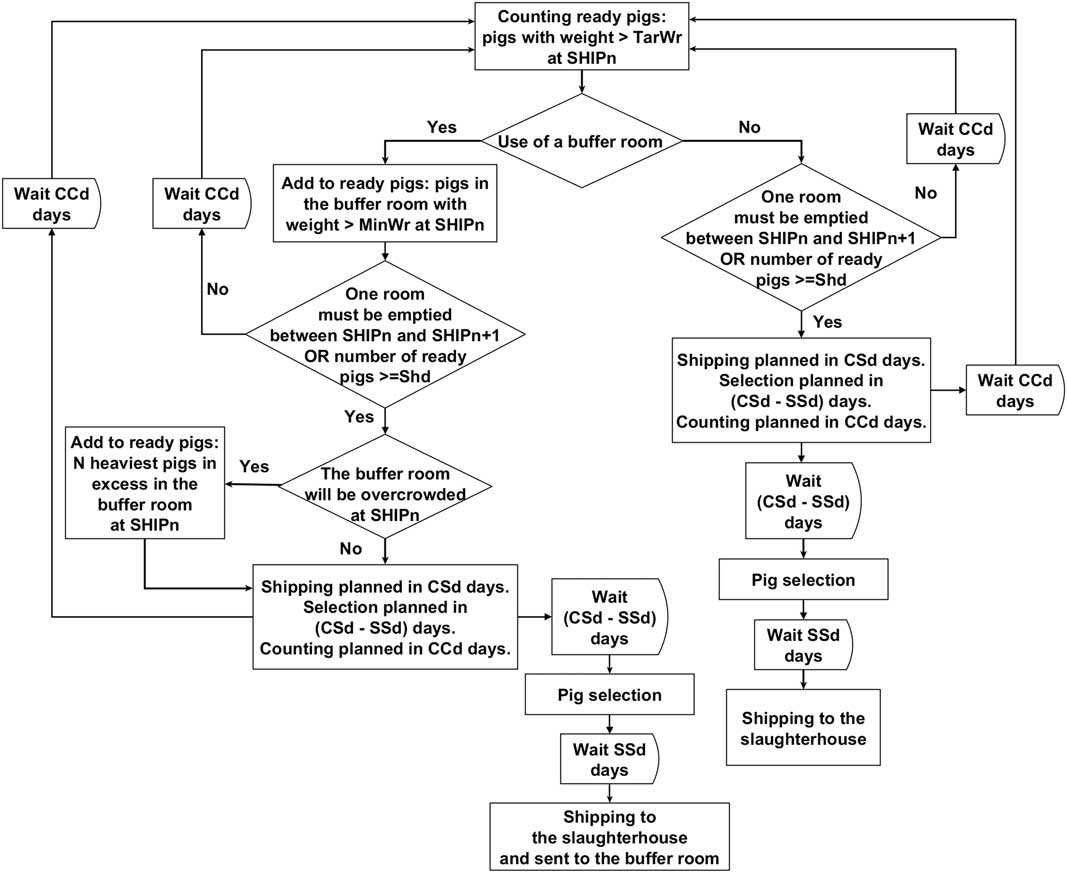
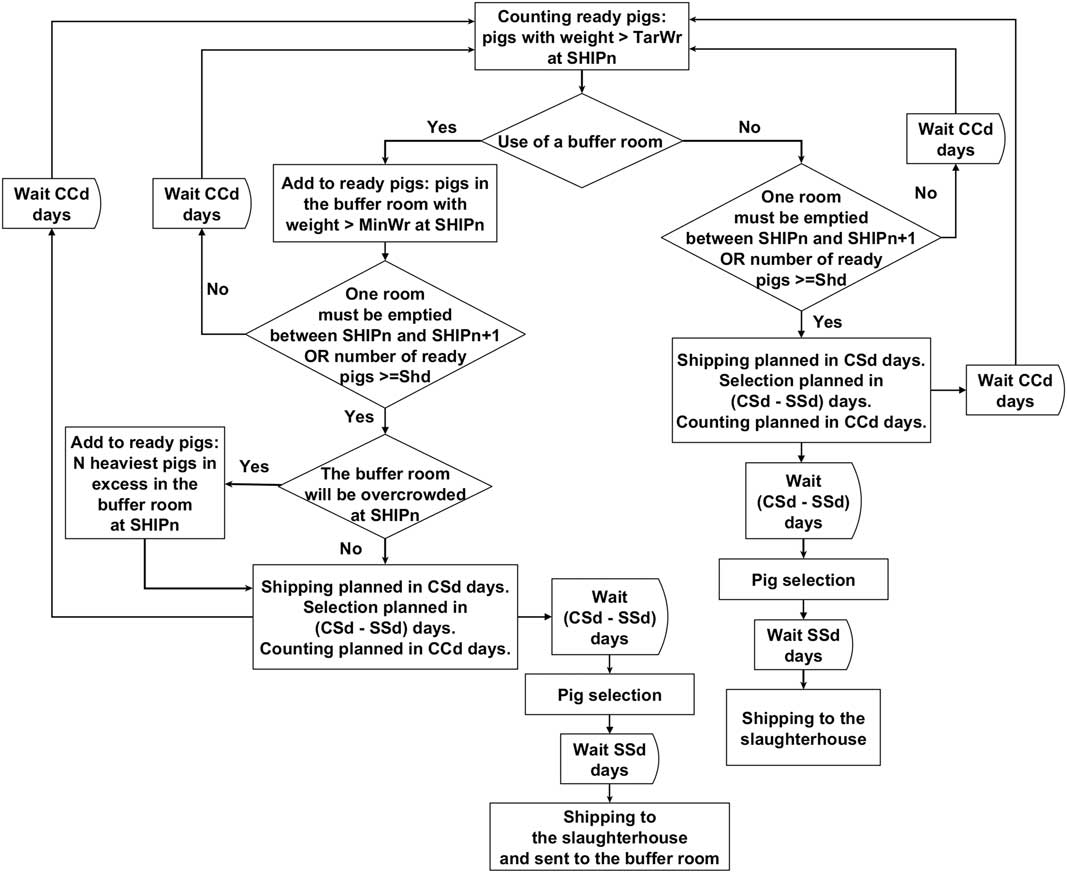
To schedule shipping (Figure 2), the ‘counting ready pigs’ function counts how many pigs can or must (when emptying the room) be slaughtered on the next possible shipping day (according to their weight and age). A given number of days before shipping, the ‘pig selection’ function selects the pigs that will be slaughtered (according to their weight and age) to determine slaughter groups. For this purpose, the model uses the discrete event simulation method, that is a discrete time step in which events are planned which modify the state of the system at a predefined time. In our model, counting and selection of pigs to determine the slaughter groups and shipping to the slaughterhouse are planned by placing their dates of occurrence in a calendar of events.
Diagram of the farmer’s process for planning shipping to the slaughterhouse. Diamond boxes represent the decisions to take (i.e. the answer is yes or no); rectangular boxes represent actions; curved boxes represent delays between actions and/or decisions. TarWr=target slaughter weight; MinWr=minimum slaughter weight without payment penalties; SHIPn=current shipping; SHIPn+1=next shipping; Shd=minimum number of ready pigs required to plan shipping; CSd=interval between counting and shipping to the slaughterhouse; SSd=interval between selecting pigs and shipping to the slaughterhouse; CCd=interval between current and next counting.
Management of the remaining fattening pigs
When a room must be emptied because a new batch is planned, the farmer applies the management practice chosen for the pigs which have not reached MinWr. In the ‘without buffer room’ option, all pigs are sold when the room must be emptied, even the lightest pigs, which incurs payment penalties. In the ‘with buffer room’ option, the lightest pigs are moved to the buffer room until they reach the optimal SW range or the maximum duration allowed for remaining in the buffer room.
Feeds and feeding plans
Formalisation of feeding practices is adapted from the InraPorc® model (van Milgen et al., Reference van Milgen, Valancogne, Dubois, Dourmad, Seve and Noblet2008), which combines a feed rationing plan, a feed sequence plan, and the level at which these plans are applied (i.e. individual, pen or room level). Each feed sequence plan defines the feeds provided to the animals, their relative percentages and the rules to shift from one feed to another (i.e. a target weight, a fattening duration or the total amount distributed). Each feed rationing plan defines the amount of feed or energy provided to pigs as a percentage of ad libitum intake or an amount per pig and per day for each period of the plan. The model shifts from one period to another in the feed rationing plan according to one of several criteria: fattening duration, age, weight, cumulative quantity of feed consumed or quantity of feed distributed. These rules are applied at the specified level: individual, pen (average value for pigs in the same pen) or room (average value for pigs in the same room). The feed rationing plans, feed sequence plans and feed composition are determined with the InraPorc software tool (InraPorc®, 2006) and are sent as inputs to the model.
Animals and performance
Pigs are simulated in an individual-based model, also adapted from InraPorc (van Milgen et al., Reference van Milgen, Valancogne, Dubois, Dourmad, Seve and Noblet2008). The model calculates feed intake (FI), protein and lipid deposition, and the resulting growth and nutrient excretion of each pig according to its growth potential and feeding plan. Each pig is assigned a profile which includes its initial age, initial weight, and four parameters that correspond to its potential FI and growth. The last five parameters are set using a covariance matrix and a multivariate random process (Vautier et al., Reference Vautier, Quiniou, van Milgen and Brossard2013) to generate the structure of a pig population. By default, the population of growing pigs is composed of 50% gilts and 50% barrows. All pig profiles are inputs to the model. Mortality is set at a constant rate throughout the fattening period.
Environmental indicators using Life Cycle Assessment
The environmental indicators are environmental impacts calculated by LCA. The model calculates environmental impacts of the fattening of each slaughtered pig, while environmental impacts of producing piglets and breeding sows in upstream farrowing and post-weaning units are calculated according to average performance (IFIP, 2016) and feed composition (Supplementary Material Table S2). Impacts of feed ingredients came from the ECOALIM data set (Wilfart et al., Reference Wilfart, Espagnol, Dauguer, Tailleur, Gac and Garcia-Launay2016) and those of their transport by road to the feed factory were based on distances assumed for pig production in Western France (Garcia-Launay et al., Reference Garcia-Launay, Wilfart, Dusart, Nzalli, Gaudré, Dronne and Espagnol2016). The amounts of electricity and natural gas required to grind and pelletise the feeds at the feed factory came from Garcia-Launay et al. (Reference Garcia-Launay, van der Werf, Nguyen, Le Tutour and Dourmad2014). By default, transport distance of the feed from the factory to the pig farm was assumed to be 30 km. Background data (i.e. impacts of road transport; electricity, light fuel oil and natural gas used in the pig unit) came from the ecoinvent database V3.1 (Weidema et al., Reference Weidema, Bauer, Hischier, Mutel, Nemecek, Reinhard, Vadenbo and Wernet2013).
Environmental impacts of manure use were estimated using a system expansion approach (Garcia-Launay et al., Reference Garcia-Launay, van der Werf, Nguyen, Le Tutour and Dourmad2014) in which we assumed that the manure produced replaced a certain percentage of mineral fertilisers, indicated as a mineral fertiliser equivalent (MFE, %). We assumed that MFE was 75% for manure N, which was assumed to lose 5% more N as nitrate (NO3) than mineral fertilisers (Nguyen et al., Reference Nguyen, Hermansen and Mogensen2010), and that MFE was 100% for manure P (Sommer et al., Reference Sommer, Maahn, Poulsen, Hjorth and Sehested2008). Processes for manure transport and spreading came from AGRIBALYSE V3.1 (Koch and Salou, Reference Lurette, Belloc, Touzeau, Hoch, Seegers and Fourichon2015). The quantities of manure produced and N and P excreted by piglets and sows were calculated according to Rigolot et al. (Reference Rigolot, Espagnol, Pomar and Dourmad2010a and 2010Reference Rigolot, Espagnol, Robin, Hassouna, Beline, Paillat and Dourmadb).
Ammonia (NH3), nitrous oxide (N2O), nitrogen oxide (NOx) and methane (CH4) emissions to the air were estimated separately for housing, manure storage and manure spreading. The model calculated amounts of nutrients (N, P, potassium (K)) remaining in manure at the end of each step. Amounts of N, P, copper (Cu), zinc (Zn), K and organic matter excreted by pigs were calculated by the growth and slaughter shipping submodel. Methane emissions from enteric fermentation were calculated according to digestible fibre contents of the feeds (Rigolot et al., Reference Rigolot, Espagnol, Pomar and Dourmad2010a), while those from manure storage were calculated according to IPCC (2006) and Rigolot et al. (Reference Rigolot, Espagnol, Robin, Hassouna, Beline, Paillat and Dourmad2010b). Ammonia emissions from the building and manure storage were calculated according to emission factors developed by Rigolot et al. (Reference Rigolot, Espagnol, Robin, Hassouna, Beline, Paillat and Dourmad2010b). N2O and NOx emissions from manure storage were calculated according to IPCC (2006) and Dammgen and Hutchings (Reference Dammgen and Hutchings2008), respectively. During field application, NH3 emissions were based on Andersen et al. (Reference Andersen, Poulsen, Børsting, Rom, Sommer and Hutchings2001), N2O emissions on IPCC (2006) and NOx emissions on Nemecek and Kägi (Reference Nemecek and Kägi2007). Potential NO3 and phosphate (PO4) leaching rates came from Nguyen et al. (Reference Nguyen, Hermansen and Mogensen2012). We calculated environmental impacts using the CML 2001 method and total cumulative energy demand V1.08 (non-renewable fossil+nuclear) as implemented in Simapro software, version 8.05 (PRé consultants, Amersfoort, the Netherlands). We considered potential impacts of pig production on climate change (CC, 100-year horizon, kg CO2−eq., 25 CO2−eq. for CH4 and 298 CO2−eq. for N2O), eutrophication potential (EP, g PO4−eq.), acidification potential (AP, g SO2−eq.), cumulative energy demand (CED, MJ), and land occupation (LO, m2 year).
Economic indicators
Gross margin per fattening pig is the main economic indicator in the model. It equals revenue from sale of pigs minus expenses related to their feed (Supplementary Material Table S3) and the purchase of piglets. The premium per kg of carcass is calculated according to the French payment grid used by default, which associates a bonus or malus value to each pig based on its carcass characteristics (weight and lean content).
Simulation study
Four simulations were performed which combined two feed rationing plans (ad libitum (Ad),restriction (Res)) and two feed sequence plans (two-phase (2P), 10-phase (10P)): 2P-Ad, 2P-Res, 10P-Ad and 10P-Res. The 21-day interval set between two successive batches represents the typical batch management of French pig farms. Simulations represent five fattening rooms and a buffer room with 100 places. The size of each batch was set at 400 pigs, in accordance with the mean number of pigs per batch in a French fattening unit (IFIP, 2016). The number of batches per simulation (i.e. replicates for the statistical analysis) was set at five, in order to use each pig profile only once (1000 female profiles for 200 female pigs per batch, and 1000 male profiles for 200 male pigs per batch). The duration of simulation, that is 600 days, has been chosen in order to consider the time required for model stabilisation and the completed fattening of five successive batches.
Pigs were allocated by weight in pens, and were fed according to the mean weight of each pen. The Res rationing plan simulates ad libitum distribution of up to a maximum of 2.5 kg of feed per day. Feed intake and nutrient requirements of gilts were used as the reference for feed formulation. Feeds were estimated using InraPorc® (2006) and provided mean reference standardised ileal digestible (SID) lysine requirements of 0.98 g/MJ at 70 days of age, 0.75 g/MJ at 65 kg of BW, and 0.54 g/MJ at 110 kg BW. Soya bean used in the formulation was assumed to be a mix produced in the Centre West (70%) and South of Brazil (30%). Two feeds, A and B, were formulated (Supplementary Material Table S4) on a least-cost basis to contain 9.75 MJ of NE per kg and to meet at least 110% of the SID amino acid requirements of the mean gilt profile (BW70=30 kg, a=4.45, b=0.0216/kg, PDm=143 g/day, BGompertz=0.0171/day, Brossard et al., Reference Brossard, Vautier, van Milgen, Salaun and Quiniou2014) at 30 kg BW (beginning of fattening) and 120 kg BW (target SW), for example 1.13 and 0.55 g SID lysine/MJ NE, respectively. The two feeds were then combined in percentages adequate to meet amino acid requirements at the beginning of each phase in the 2P and the 10P feed sequence plans. The 2P strategy was designed to supply 1.13 g SID lysine/MJ NE from 70 days of age to 65 kg BW (Feed A) and 0.86 g/MJ NE from 65 kg BW until slaughter (combining Feed A and Feed B). The 10P strategy contained 10 feeding phases with a progressive shift from 100% of feed A to 100% of feed B. Feeds for gestating and lactating sows and for the first and second post-weaning phases (to calculate environmental indicators) were formulated according to Garcia-Launay et al. (Reference Garcia-Launay, van der Werf, Nguyen, Le Tutour and Dourmad2014), with feed ingredient prices from February 2014 including the cost of transporting feed ingredients (Garcia-Launay et al., Reference Garcia-Launay, Wilfart, Dusart, Nzalli, Gaudré, Dronne and Espagnol2016).
The selling price of pigs is based on the French market price in February 2014 (1.314 €/kg carcass), and the premium per kg carcass is calculated according to the French payment grid. Piglet value in the simulations is estimated according to the cost of producing piglets in February 2014 (62.10 €/piglet of 30 kg BW).
The four simulations were performed twice: with (Var+) and without (Var−) variability among pigs. Two average animal profiles were used (Brossard et al., Reference Brossard, Vautier, van Milgen, Salaun and Quiniou2014), one for gilts (BW70=30 kg, a=4.45, b=0.0216/kg, PDm= 143 g/day, BGompertz=0.0171/day) and one for barrows (BW70=30 kg, a=5.02, b=0.0189/kg, PDm=150 g/day, BGompertz=0.0194/day) for the Var− simulations, and to generate the structure of the pig population for the Var+ simulations (Vautier et al., Reference Vautier, Quiniou, van Milgen and Brossard2013).
The average performance per simulation were calculated for the Var− simulations whereas for the results obtained from the Var+ simulations a variance analysis was performed using a linear mixed model with fixed effects of feed sequence plan, feed rationing plan, and their interaction, and random effects of the animal profile within the batch. According to this model, the experimental unit was the batch (n=5). For this analysis, we used the lme4 package (V1.1, Douglas et al., Reference Douglas, Martin, Ben and Steve2015) and the lmer function of R software (R Development Core Team, 2015).
Average performances per batch were calculated (number of shipments per batch, percentage of pigs within the range of optimal SW, average premium per pig and number of pigs moved to the buffer room) and analysis of variance was performed on the results. We used a general linear model to assess effects of the feed sequence plan, feed rationing plan and their interaction. For this analysis, we used the stats package (V3.3.0) and the glm function of R software.
Results
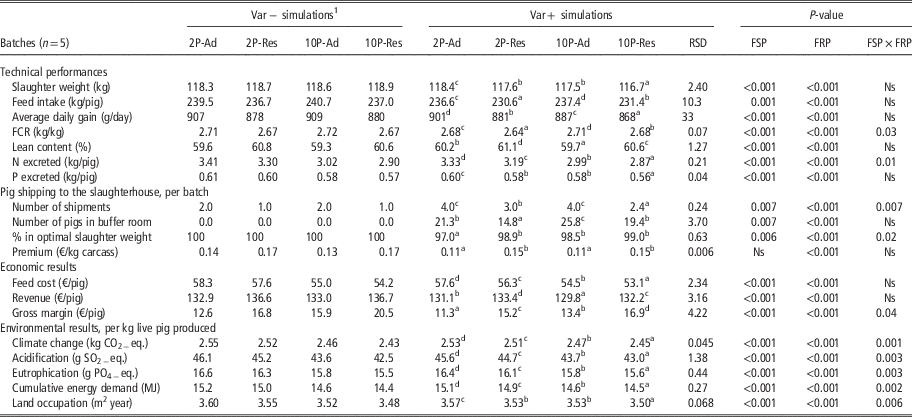
Table 1 presents the predicted performance obtained for the four simulations, with and without considering variability among pigs.
Least-square means of the technical, economic and environmental outputs of the model for the four simulations with or without variability among pigs

2P-Ad=two-phase+ad libitum; 2P-Res=two-phase+restriction; 10P-Ad=10-phase+ad libitum; 10P-Res=10-phase+restriction; RSD=residual standard deviation; FSP=feed sequence plan; FRP=feed rationing plan; N=nitrogen; P=phosphorus; FCR=feed conversion ratio.
The significance of the effect of FSP, FRP and their interaction concerns only the individual-based model simulations. Environmental outputs include impacts of farrowing, post-weaning, and fattening units.
a,b,c,dMeans followed by same letter do not differ (P>0.05) according to Fischer’s test.
1 Simulations with (Var+) or without (Var−) variability among pigs.
Effect of the incorporation of variability among pigs
Average SW does not differ between strategies in Var− simulations, whereas it varies from 116.7 to 118.4 kg in Var+ simulations. Feed intake, average daily gain (ADG), feed conversion ratio (FCR), N and P excreted, economic results, and premium are higher in Var− than in Var+ simulations, and lean content is lower. The number of shipments is 1.9 less per batch in Var− than in Var+, with in average 100 v. 98.4% of pigs in optimal SW, respectively. Moreover, no pigs were sent to the buffer room in Var− whereas they were in average 20.3 sent to buffer room in Var+. Environmental impacts are in average 0.9% higher in Var− than in Var+ for the 2P scenarios, whereas the opposite is found in the 10P scenarios. In the next subsections, we will focus on the results of the Var+ simulations. Regarding the Var+ simulations, effects of feed rationing and feed sequence plans (FSP and FRP) are significant for all variables, except for the premium with FSP.
Simulation of technical performances
Slaughter weight is heavier in Ad than in Res pigs and is also heavier with the 2P than with the 10P feeding strategy. Average daily gain and excreted N and P experience similar effects. Conversely, lean content is lower in Ad than in Res pigs and is also lower with the 10P than with the 2P feeding strategy. Feed intake and FCR are higher in Ad than in Res pigs and are also higher with the 10P than with the 2P feeding strategy.
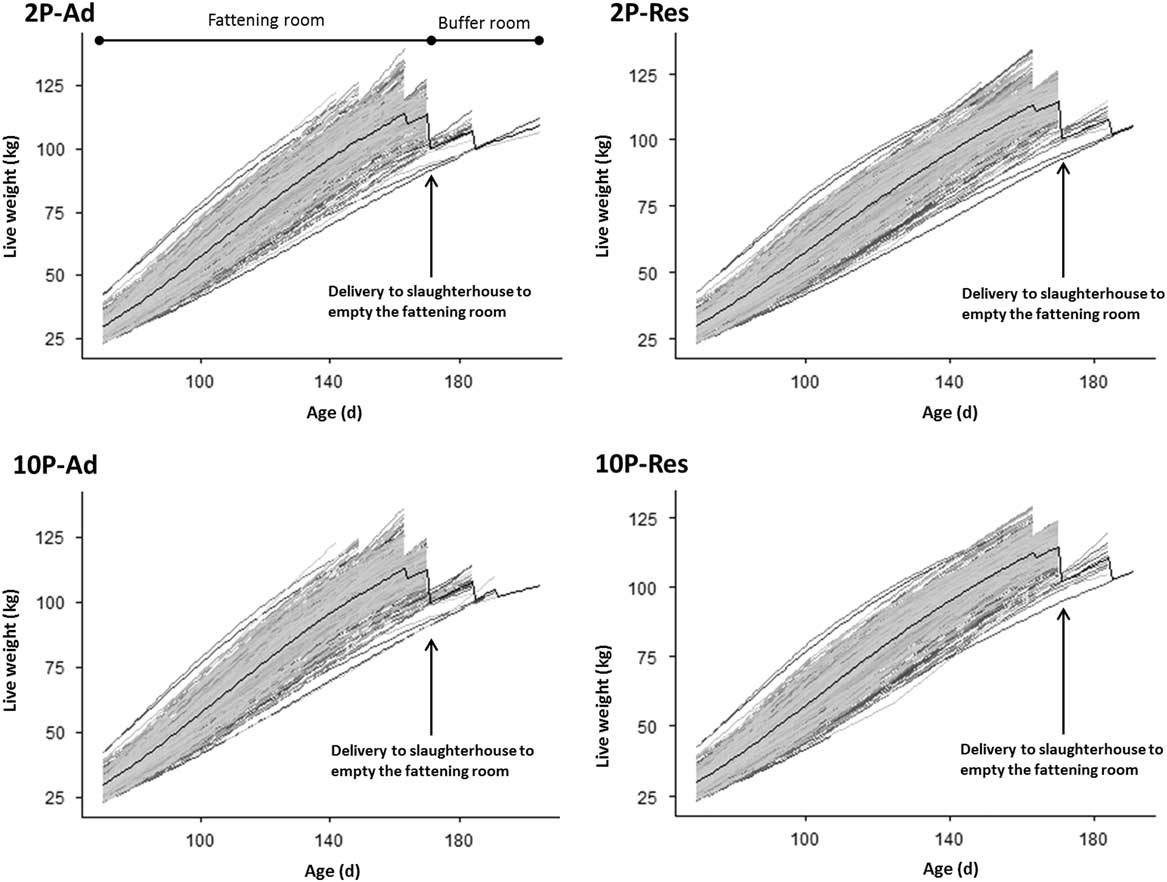
Mean live weight decreases each time pigs are shipped (Figure 3). The standard deviation of pig weight, initialised at the beginning of fattening, increased during the simulation. An early shipment of the heaviest pigs appears at 140 days of age in Ad simulations but not in Res simulations (Figure 3). This suggests that performance differ more with the Ad than with the Res feeding strategy.
Predicted growth curves of pigs from the same batch from four simulations with representation of the variability among pigs. Each black curve represents the average weight of pigs in the batch. 2P-Ad=two-phase+ad libitum; 2P-Res=two-phase+restriction; 10P-Ad=10-phase+ad libitum; 10P-Res=10-phase+restriction.

Simulation of shipping to the slaughterhouse
The mean number of shipments per batch is higher for Ad than for Res pigs and is also higher with the 2P than with the 10P feeding strategy. Conversely, the percentage of pigs within the range of optimal SW is lower for Ad than for Res pigs and is also lower with the 2P than with the 10P feeding strategy. The mean number of pigs moved to the buffer room is higher for Ad than for Res pigs and is lower with the 2P than with the 10P feeding strategy. The average premium per pig is lower for Ad than for Res pigs, but the feed sequence plan has no significant effect on it.
Simulation of economic and environmental indicators
Feed cost per pig is higher for Ad than for Res pigs and also higher with the 2P than with the 10P feeding strategy. Conversely, average revenue per pig is lower for Ad than for Res pigs. Consequently, the gross margin is higher for Res pigs and is also higher with the 10P feeding strategy.
Climate change impact per pig is higher for Ad than for Res pigs and is also higher with the 2P than with the 10P feeding strategy. Similar effects are observed on AP, EU, CED and LO impacts.
Discussion
The model developed in this study is able to simulate dynamics of a pig fattening unit by considering variability in performances among pigs and interactions with farmers’ practices and farm infrastructure. Such a model can be used for analyses of scenarios as illustrated in the simulation study provided. Performing the statistical analysis of the results from the scenarios needs to address the issue of the numbers of replicates (i.e. batches) and pigs per batch in a way slightly different from classical animal experiments. As the choice of the number of replicates may change the P-values we tested the effect of increasing it from five to 10 with no effect on mean farm results. The simulations required about 7 min computation time per scenario with five replicates. This seems reasonable, although already long, in the perspective of routine use as decision support tool for on-farm advice.
Accounting for variability in performances among pigs provides a way to accurately represent effects of farmers’ practices. Most published models simulate only one shipment to the slaughterhouse. With a 21-day interval between two successive batches, in practice, farmers usually organise three to five shipments per batch (Aubry et al., Reference Aubry, Lescot, Cadéro, Garcia, Correge and Quiniou2016). Using average animal profiles does not allow simulating the occurrence of all shipments and induces an overestimation of the economic results (e.g. by 11% to 21% for gross margin). This is mainly related to the fact that without variability in animal characteristics all pigs from the same gender have the same nutrient requirement and achieve the same growth and carcass performance. This results in maximum two shipments per batch, one for the gilts and one for the barrows. Due to the lack of variability the premium per pig is also higher resulting in improved economic performance. For these reasons, we will focus in the following discussion on the results from the Var+ simulations.
The model showed appropriate behaviour when compared with expert knowledge. Results of the 2P-Res simulation, which represents the most common feeding strategy in France, are in the range of the results of French pig farms (IFIP, 2016) for characteristics such as FCR (2.64 v. 2.69±0.17 kg feed/kg live weight from 30 to 115 kg), lean content (61.1 v. 61.0±0.8%), and average SW (117.6 v. 119.6±2.9 kg). The relative differences between two-phase and multiphase feeding strategies obtained with the model and in previous studies also suggest that the model adequately simulates the effects of the feeding strategies investigated here. Indeed, the calculated amount of N excreted per pig is 10% lower in multiphase v. two-phase feeding strategy with the model, what is in line with previous experimental results: the difference between one-phase and multiphase strategies in Bourdon et al. (Reference Bourdon, Dourmad and Henry1995) was 10% and the decrease of nitrogen excreted between a three-phase programme and a daily multiphase programme was 12.5% in Andretta et al. (Reference Andretta, Pomar, Rivest, Pomar, Lovatto and Neto2014). The model (with variability among pigs) also predicted a very slight increase (+1%) of FCR when shifting from two-phase to multiphase strategy what is in accordance with the experimental results of Pomar et al. (Reference Pomar, Pomar, Dubeau, Joannopoulos and Dussault2014) who did not find a significant increase in FCR between three-phase and daily multiphase feeding. This is also in accordance with Brossard et al. (Reference Brossard, Dourmad, Rivest and van Milgen2009) who already found with a simulation approach that using multiphase v. two-phase strategy may increase FCR, when the SID lysine content at the beginning of each phase is set at a value lower or equal to 110% of the mean population requirement. Although the model proposed here needs to be further extensively validated against experimental results, this first study suggests that it simulates adequately the effects of these feeding strategies.
Effects of feeding practices on pig performance are often studied in pig production models, but the resulting output at slaughter and the economic indicators are less documented. In our model, feed restriction results in a higher gross margin, due to lower feed cost and higher selling price, than ad libitum feeding. Morel et al. (Reference Morel, Sirisatien and Wood2012) studied effects of animal genotype and feed rationing plan on the gross margin of a fattening unit, finding that feed restriction increases the gross margin more than an ad libitum feeding, regardless of the genotype.
In our study, use of a 10-phase feed sequence plan results in a lower variability in pig SW, like in Niemi et al. (Reference Niemi, Sevon-Aimonen, Pietola and Stalder2010), and in a higher gross margin than use of a two-phase feed sequence plan. Morel et al. (Reference Morel, Sirisatien and Wood2012) suggested that pig genotype, especially maximum daily protein deposition potential, has a major influence on technical and economic performances of the unit. Our model includes effects of pig genotype in pig profiles and incorporates the feed cost to estimate effects of a management strategy on technical and economic performances.
As in Garcia-Launay et al. (Reference Garcia-Launay, van der Werf, Nguyen, Le Tutour and Dourmad2014), our results indicate that increasing the number of phases in the feed sequence plan reduces environmental impacts. More phases increase the supply of nutrients to pigs and decrease N and P excretions. According to Monteiro et al. (Reference Monteiro, Garcia-Launay, Brossard, Wilfart and Dourmad2016) and our simulations, increasing the number of phases tended to increase mean FCR and decrease ADG. As they suggested, this could be related to supplying insufficient amounts of amino acids to the highest performing pigs during transition periods.
Conclusion
To our knowledge, our model is the first individual-based model of a fattening pig unit which also calculates economic and environmental performances. This model is promising for exploration of effects of farmers’ practices, pigs’ characteristics and farm infrastructure on technical, economic and environmental performances of the unit, and simulation of different management practices to improve performances or reduce costs. In the near future, the model will be used to simulate a virtual experiment to investigate effects of both management and feeding practices, and their interactions with the potential performance of the pig population, on technical, economic and environmental performances of the pig fattening unit. This model is intended for application in France in conventional farms, but it should be usable in other countries with appropriate calibration. Because it is also intended for on-farm advice, the model will be further tested with external data before being included in decision support tool.
Acknowledgements
The authors thank Alain Valancogne for advice during integration of the InraPorc model in MOGADOR. This study was supported by CIFRE Ph.D. funding (agreement in industry for training by research) of the ANRT (National Agency for Research and Technology) with co-funding from the call for projects ‘Targeted research and innovation’ of the French Ministry of Agriculture, Agrifood and Forestry.
Software and data repository resources
The code to perform the simulations described in this paper is accessible on the ZENODO data warehouse (https://zenodo.org/record/890623#.WcuRoWekFcg). Launching the file ‘Animal_MOGADOR.R’ using R software will reproduce the paper results.
Supplementary material
To view supplementary material for this article, please visit https://doi.org/10.1017/S1751731117002920