1. Introduction
Iconicity is a core component of various approaches to the study of communication, including both spoken and signed languages (Dingemanse, Blasi, Lupyan, Christiansen, & Monaghan, Reference Dingemanse, Blasi, Lupyan, Christiansen and Monaghan2015; Perniss, Thompson, & Vigliocco, Reference Perniss, Thompson and Vigliocco2010; Taub, Reference Taub2001), language evolution (Imai & Kita, Reference Imai and Kita2014; Perniss & Vigliocco, Reference Perniss and Vigliocco2014; Tamariz, Roberts, Martínez, & Santiago, Reference Tamariz, Roberts, Martínez and Santiago2017), language development (Perniss, Lu, Morgan, & Vigliocco Reference Perniss, Lu, Morgan and Vigliocco2017; Perry, Perlman, Winter, Massaro, & Lupyan, Reference Perry, Perlman, Winter, Massaro and Lupyan2017), and linguistic structure (Christensen, Fusaroli, and Tylén, Reference Christensen, Fusaroli and Tylén2016). There is also considerable variety in the methods used to measure iconicity, including lab-based experiments, developmental data, and corpus studies. Taken together, these diverse approaches and methods make for a rich, complex, and interdisciplinary endeavour with broad applicability. However, they raise the concomitant difficulty of defining and measuring iconicity.
In this paper, we lay out empirical methods currently used for measuring iconicity in signals and across systems. We focus on behavioural metrics (based on how humans perceive, produce, or learn signal–meaning mappings), and also provide a brief discussion of data-driven metrics (based on objective measures of similarity between signals and meanings). We hope to provide a comprehensive toolbox that can facilitate researchers choosing a method of measurement that suits their data and hypotheses.
2. What is iconicity?
Given the diversity described above, our aim is not to settle on a single definition of iconicity. Rather, we aim to provide a broad framework as the starting point for a review of measurement methods.
Peirce (Reference Peirce1974) contrasts icons with symbols and indices. These terms refer to the relationship between a sign and its object, and are not mutually exclusive. Something is a symbol if the sign is related to its object by convention (e.g., it is purely by convention that the English word dog can refer to a dog). For an index, the sign is related to its object via a physical connection, such as causation (certain spots are an index of chicken pox because they are caused by that disease) or position (a pointing finger aligns with the thing pointed at). An icon stands for its object by virtue of some quality or property that it possesses (the red circle on the flag of Japan represents the rising sun because of its colour and shape).
However, this definition is rather abstract: it situates broad classes of signs in a theoretical semiotic framework. For practical purposes, as when describing iconicity to experimental participants or constructing a model, researchers often need to flesh out this theoretical definition with some concrete details. These more concrete attempts at definition fall into two groups: the operational (how is iconicity operationalised in an experiment or model?) and the functional (what effect does iconicity have on cognition or communication?)
The operational hallmarks of iconicity vary widely. For instance, some researchers might practically treat iconicity as involving perceptual resemblance, as with onomatopoeia. Others might study perceptual phenomena without requiring direct resemblance: the word kiki (cf. the Bouba-Kiki effect; Ramachandran & Hubbard, Reference Ramachandran and Hubbard2001) doesn’t resemble a spiky shape in the same way that the word caw resembles a crow’s call. Still others might study higher-order forms of similarity, such as analogy, that are less perceptual and more schematic (e.g., Emmorey, Reference Emmorey2014). Importantly, a definition of iconicity that does not demand one-to-one resemblance allows for iconicity to be present across levels in language, and in different ways. For example, a word can sound like its referent based on phonemic properties (‘caw’) or prosodic properties (‘looooong’). Iconicity can be present at the phrase, rather than the word, level, such as the sequential iconicity of “veni, vidi, vici” reflecting the order of the three events (Jakobson, Reference Jakobson1971, p. 350). Thus, as Peirce himself acknowledged with various subcategories, quite a disparate range of phenomena fall under the broad icon category.
Other researchers, rather than focusing on what iconicity is, are principally interested in what role it plays in human cognition or communication. If (operationally) iconicity means that a signal resembles its referent, then (functionally) iconicity may make it easier for naive perceivers to guess the meaning of a signal. In this sense, iconicity is the feature of a signal that allows its meaning to be predicted from its form. A functional approach may therefore not use direct resemblance as its primary criterion; rather, it requires that certain signal–referent pairings are cognitively easier to process or communicatively more effective than others.
As such, a purely functional approach can be problematic, as it may conflate iconicity and systematicity, a phenomenon related to – but distinct from – iconicity (Dingemanse et al., Reference Dingemanse, Blasi, Lupyan, Christiansen and Monaghan2015; Winter, Perlman, Perry, & Lupyan, Reference Winter, Perlman, Perry and Lupyan2017). Systematicity involves statistical regularities in form that allow one to make predictions about meaning, benefitting language learning (Monaghan, Christiansen, & Fitneva, Reference Monaghan, Christiansen and Fitneva2011). For instance, there are statistical sound patterns that can help distinguish English nouns and verbs, and an English speaker might be able to guess whether a novel word is a noun or verb based on its length or phonotactics (Fitneva, Christiansen, & Monaghan, Reference Fitneva, Christiansen and Monaghan2009), rather than by direct resemblance between signal and meaning. In our discussion below, we suggest some methodological considerations that can lessen the likelihood of conflating the two related concepts.
With these definitions in mind, we will trace the history of experimental iconicity research with respect to the methods used and the effectiveness of these approaches. We begin with a discussion of intuition-based approaches to iconicity, typical of the earliest studies. We then detail many of the behavioural methods used for measuring iconicity, and finish with data-driven approaches.
3. Intuition-based approaches to iconicity
3.1. descriptive approaches
Some of the earliest studies of iconicity exploited researchers’ own intuition about which forms in a language are iconic, and what might be the link between linguistic form and meaning. If we understand iconicity as a form–meaning mapping that reflects perceptual and real-world experience, then it is unsurprising that researchers relied on their own perceptual and real-world experience to explain iconic mappings.
Early discussions of iconicity were therefore mainly descriptive, cataloguing the ways in which the sounds or signs of a language represented the concepts they expressed (Frishberg, Reference Frishberg1975; Jakobson & Waugh, Reference Jakobson and Waugh1979; Jespersen, Reference Jespersen1922; Marchand, Reference Marchand1959). Such discussions of iconicity and sound symbolism laid the foundations for, and in some cases directly motivated, later experimental work, setting down testable hypotheses concerning the relations between form and meaning. However, the reliance on intuition and observation failed to provide systematic or robust analyses of form–meaning pairings, and frequently left explanatory gaps. For example, Marchand (1959, p. 147) notes the prevalence of /k/-/p/ and /k/-/b/ in words referring to “protuberant forms”, such as knap and knob, but acknowledges that we cannot ascertain why the mapping would be iconic.
3.2. coding schemes
Researchers have otherwise aimed to constrain intuition-based approaches through the use of coding schemes and reliability analyses, limiting the subjective judgements of individual researchers. Such studies include data from sign languages (e.g., Pietrandrea, Reference Pietrandrea2002), spoken languages (Diessel, Reference Diessel2008), and artificial systems (Christensen et al., Reference Christensen, Fusaroli and Tylén2016; Lister, Fay, Ellison, & Ohan, Reference Lister, Fay, Ellison, Ohan, Noelle, Dale, Warlaumont, Yoshimi, Matlock, Jennings and Maglio2015). For example, rather than judging signs holistically, Pietrandrea (Reference Pietrandrea2002) based judgements of signs in Italian Sign Language on individual articulatory parameters that are considered the minimal units of signs (handshape, location, and movement). For example, the flat-hand handshape for the sign TABLE resembles the flat surface of a table. In this case, the author simply notes the presence or absence of an iconic link. Other measures tag for specific features of signals, such as argument structure (Diessel, Reference Diessel2008), or use scalar ratings (e.g., Lister et al., Reference Lister, Fay, Ellison, Ohan, Noelle, Dale, Warlaumont, Yoshimi, Matlock, Jennings and Maglio2015).
Data coding is usually done by multiple researchers, in order to ascertain reliability of the coding scheme. If agreement between coders is high, then it is assumed that the coding is a meaningful measure, and not just reflective of subjective judgements by individuals. Reliability is commonly given as the percentage of agreement between coders, or as the Cohen’s Kappa statistic (Cohen, Reference Cohen1960), which takes into account how much agreement would be expected by chance. For instance, a Kappa statistic of 1 indicates perfect agreement, with 0 indicating no agreement. Viera and Garrett (Reference Viera and Garrett2005) give a summary of the Kappa statistic, with guidelines for its interpretation.
Predefined and piloted coding criteria, as well as reliability analyses of coding from multiple researchers, offer robustness, whilst still exploiting the valuable tool of the researchers’ own perceptions.
4. Behavioural approaches to iconicity
From the early twentieth century, researchers recognised the value of testing their own assumptions about iconicity with naive experimental participants (e.g., Köhler, Reference Köhler1929). We identify three main methods that are now widely used to measure iconicity: comprehension, rating, and production tasks.
4.1. comprehension experiments
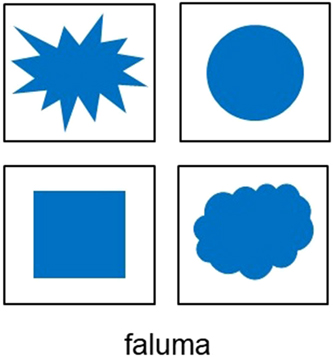
Under a functional definition of iconicity, the hallmark of an iconic signal is the ability of naive perceivers to guess its meaning from its form. This can be tested with an open-ended comprehension task (i.e., asking participants “What does the Japanese word kibikibi mean?”). However, due to the lack of constraint in such tasks, experimenters often make use of some variety of forced-choice methodology (e.g., from Lockwood, Dingemanse, & Hagoort (Reference Lockwood, Dingemanse and Hagoort2016): “does kibikibi mean ‘energetic’ or ‘tired’?”; see Figure 1). This method is used extensively to test sound–symbolic relationships in artificial languages (e.g., Imai, Kita, Nagumo, & Okada, Reference Imai, Kita, Nagumo and Okada2008; Nielsen & Rendall, Reference Nielsen and Rendall2011; Ramachandran & Hubbard, Reference Ramachandran and Hubbard2001), but has also been used with natural languages (Klima & Bellugi, Reference Klima and Bellugi1979; Dingemanse, Schuerman, Reinisch, Tufvesson, & Mitterer, Reference Dingemanse, Schuerman, Reinisch, Tufvesson and Mitterer2016), and has more recently been used to test how iconicity is shaped by communication pressures (Little, Eryilmaz, & de Boer, Reference Little, Eryilmaz and de Boer2017a; Perlman, Dale, & Lupyan, Reference Perlman, Dale and Lupyan2015).
Example of a comprehension task interface. Here, an array of four choices is given to match to the label shown underneath. Participants can click on one of the four choices to make their guess.

4.1.1. Operationalisation
Although open-ended tasks are much harder than forced-choice tasks, researchers must be careful when interpreting results from the latter. If such tasks measure iconicity, they rest on a functional definition of iconicity: the signals are iconic in that they aid guessing. However, we noted above that this is also a benefit of systematicity. Thus, forced-choice measures might reflect systematicity rather than iconicity. In particular, the use of an array of possible meanings might emphasise the systematic relationships between signals and meanings, or might emphasise the similarity between signal and meaning. Furthermore, artificial stimuli are often designed to be maximally contrastive, whereas contrasts in natural languages are not encoded so starkly. For example, Dingemanse et al. (Reference Dingemanse, Schuerman, Reinisch, Tufvesson and Mitterer2016) demonstrated that participants performed worse at a binary forced-choice task that used ideophones from five unfamiliar real-world languages than they did at a traditional Bouba-Kiki task, which used artificial stimuli (though participants still performed above chance). In this way, forced-choice tasks may exaggerate contrasts between meanings, indicating a level of sensitivity that may not be present in more naturalistic contexts.
4.1.2. Stimuli presentation
Stimuli can be presented as orthographic words (Perry, Perlman, & Lupyan, Reference Perry, Perlman and Lupyan2015), images (Perlman & Lupyan, Reference Perlman and Lupyan2018; Thompson, Vinson, & Vigliocco, Reference Thompson, Vinson and Vigliocco2009; Vinson, Thompson, Skinner, & Vigliocco, Reference Vinson, Thompson, Skinner and Vigliocco2015), or videos (Verhoef, Padden & Kirby, Reference Verhoef, Padden, Kirby, Roberts, Cuskley, McCrohon, Barceló-Coblijn, Fehér and Verhoef2016). However, the selection of the particular stimuli is important: Thompson et al. (Reference Thompson, Vinson and Vigliocco2009) found that signers of American Sign Language (ASL) were faster to match signs to pictures when there was a congruent mapping between the sign and the picture. For example, participants were faster to match the sign BASKET, which indicates a round shape, to a picture of a round-shaped basket, compared with a square-shaped basket. Therefore, in a study where single images are paired with single labels, salient images might affect participant responses, either allowing or inhibiting comprehension. Perlman and Lupyan (Reference Perlman and Lupyan2018) offer one way to reduce this confound. Their stimuli included different exemplars of each meaning (e.g., different images representing the concept ‘fire’), and one exemplar was randomly used in the meaning array given to each participant. This reduced the possibility that any particular image could drive comprehension success.
Finally, some meanings are selected more often overall because they suit the affordances of the modality. For instance, Little et al. (Reference Little, Eryilmaz and de Boer2017a) used theremin-produced signals in a forced-choice task. A theremin produces specific timbres and lends itself to particular melodic patterns. Some meanings were clicked on substantially more often than others (regardless of accuracy), indicating that those particular meanings aligned better with the timbres and melodic patterns of the signals.
4.1.3. Effects of prior knowledge
Previous linguistic and cultural knowledge can also contribute to comprehension accuracy, over and above iconic resemblance. Perlman et al. (Reference Perlman, Dale and Lupyan2015) found such a cultural effect, where participants matched some signals correctly based on conventional associations instead of iconic associations. For example, a high-pitched whistle was easy to guess as a signal for ATTRACTIVE, as was a disgusted ‘eww’ for UGLY. An example of a linguistic effect comes from Styles and Gawne (Reference Styles and Gawne2017), who demonstrated that stimuli that were phonotactically inconsistent with participants’ native languages could affect performance in a comprehension task using pseudo-words.
Thus, when designing stimuli, researchers can take both pre-emptive and post-hoc approaches to control for stimuli salience, such as pilot studies, or norming studies that assess how interesting or salient individual test items are. If this is not possible, it is also useful to track selection frequencies during the experiment and include these in analyses.
4.2. iconicity ratings
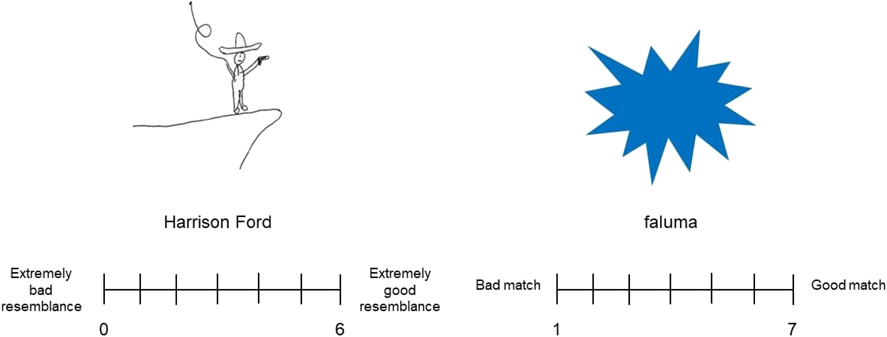
The above forced-choice tasks involve a binary response (an item is either selected or not). A more graded response involves participants rating how iconic a signal is on a Likert or other scale (Figure 2). Whereas the forced-choice measure relies on a functional definition of iconicity (iconicity helps people guess a signal’s meaning), rating tasks usually rest on an operational definition: participants are asked to rate how well a signal resembles its referent. Rating tasks are common in visual domains, such as sign language research (Bosworth & Emmorey, Reference Bosworth and Emmorey2010; Caselli, Sevcikova Sehyr, Cohen-Goldberg, & Emmorey, 2017; Occhino, Anible, Wilkinson, & Morford, Reference Occhino, Anible, Wilkinson and Morford2017; Sevcikova Reference Sevcikova Sehyr and EmmoreySehyr & Emmorey, in press; Vinson, Cormier, Denmark, Schembri, & Vigliocco, Reference Vinson, Cormier, Denmark, Schembri and Vigliocco2008) or symbolisation (Lister et al., Reference Lister, Fay, Ellison, Ohan, Noelle, Dale, Warlaumont, Yoshimi, Matlock, Jennings and Maglio2015; Sulik Reference Sulik2018), but are increasingly common in studies of spoken language (Perry et al., Reference Perry, Perlman and Lupyan2015; Winter et al., Reference Winter, Perlman, Perry and Lupyan2017).
Examples of rating task interfaces. The ‘signal’ to be rated is shown on top, with its ‘meaning’ underneath. The labels for the rating scales differ, demonstrating how labels can suit the format of the stimuli. For example, it is more pertinent to reference direct resemblance in the left-hand example (from Sulik, Reference Sulik2018), than the right. Additionally, scales can start from 1, or 0, where 0 might be more intuitive for cases where there is no resemblance.

4.2.1. Operationalisation
For participants to rate the iconicity of signals, it is important to first define iconicity for them in lay terms. In a task rating British Sign Language signs, Vinson et al. (Reference Vinson, Cormier, Denmark, Schembri and Vigliocco2008) advise participants that an iconic sign “somehow looks like what it means. One sign generally considered to be very iconic is DRINK, which looks like a person holding a cup and bringing it to their mouth. You would be able to guess this sign’s meaning even if you did not know BSL” (p. 1087). The instructions in Perry et al. (Reference Perry, Perlman and Lupyan2015) describe iconicity thus: “Some English words sound like what they mean. For example, SLURP sounds like the noise made when you perform this kind of drinking action” (p. 12). In both cases, more detailed instructions are given. For instance, Vinson et al. (Reference Vinson, Cormier, Denmark, Schembri and Vigliocco2008) found in a pilot that finger-spelled signs were being rated as more iconic, not because they resemble referents but because they resemble the symbolic orthography of written English words for those referents. As such, the final instructions used warn against this tendency.
Although iconicity ratings typically focus on an operational definition of iconicity involving resemblance, the instructions quoted from Vinson et al. (Reference Vinson, Cormier, Denmark, Schembri and Vigliocco2008) also hint at the functional definition by suggesting that iconicity helps people guess the meaning of signs. Perry et al. (Reference Perry, Perlman and Lupyan2015) make this distinction more explicit: in Studies 1 and 2, they ask for ratings of resemblance between English words and their meanings (using orthographic and auditory stimuli, respectively), but in Study 3, they ask participants to rate how likely it is that a “space alien [would] guess the meaning of a word based only on its sound” (p. 6). The authors found the same pattern of results across rating methods, suggesting that iconicity ratings are reasonably robust against variation in instructions. However, these diverse approaches potentially tap into different aspects of iconicity. Their results demonstrated a strong correlation between the two resemblance-based ratings (written~auditory, r = .61), but a more moderate correlation between the resemblance- and functional-based ratings (written~alien r = .46, auditory~alien r = .41). Sevcikova Reference Sevcikova Sehyr and EmmoreySehyr and Emmorey (in press) introduce a similar distinction, comparing iconicity ratings for ASL signs with both a comprehension test (guessing the meanings of signs) and ratings for ‘perceived transparency’ (i.e., rating how obvious their guessed meaning would be to others), similar to Perry et al.’s (Reference Perry, Perlman and Lupyan2015) alien question. Though they find a strong correlation across measures, they also see notable differences (discussed further in Section 4.2.3). Thus, iconicity is not a monolithic construct, and research involving rating tasks should be sensitive to this distinction.
4.2.2. Rating scale and sample size
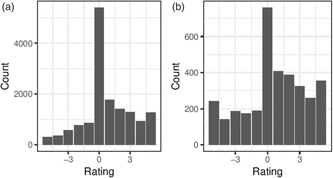
Another variant found in rating task designs is the choice of rating scale. Commonly, the ends of a Likert scale are labelled ‘arbitrary’ and ‘iconic’. Alternatively, Perry et al. (Reference Perry, Perlman and Lupyan2015) used a scale that ranged from ‘anti-iconic’ (–5, e.g., a long word being used to mean something small) to ‘iconic’ (+5) with ‘arbitrary’ as a mid-point on the scale (0). Figure 3 shows that the negative half of the anti-iconic-to-iconic scale is relatively underutilised. This may be because the stimuli were early-learned words, so ‘anti-iconic’ relations might be uncommon in this set. However, analysis of rating consistency across the scale shows that the anti-iconic end of the scale is not only underused, but also less consistent (see <https://osf.io/v2ceu/>), suggesting that anti-iconic relationships are difficult to assess.
Bar plots showing the distribution of iconicity ratings, from anti-iconic (negative) to iconic (positive); (a) presentation of written English words from Perry et al. (2015, Experiment 1); (b) auditory presentation of non-linguistic vocalisations from Perlman and Lupyan (Reference Perlman and Lupyan2018).

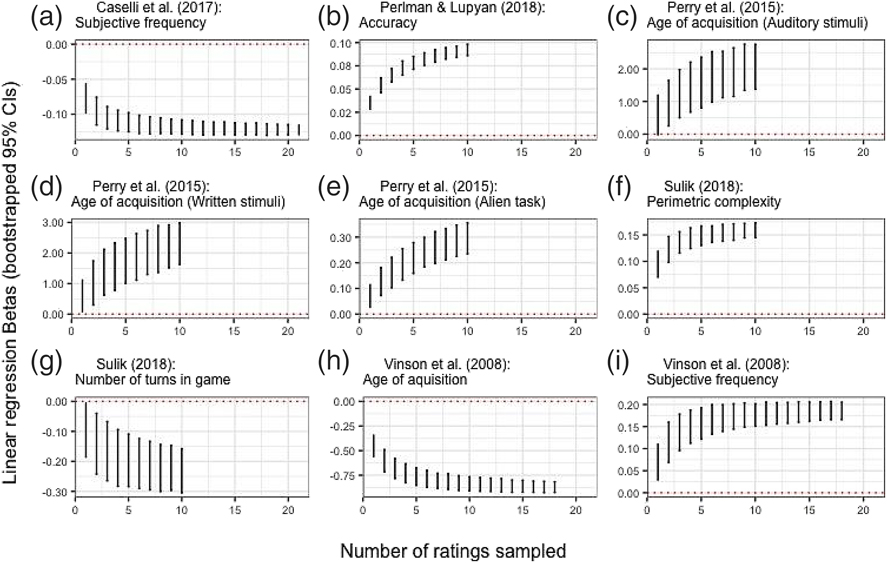
Since iconicity ratings are subjective, researchers typically collect multiple ratings and average these per signal. An important design decision is the number of ratings to collect per signal. To address this, we simulated varying numbers of ratings based on published datasets. Each dataset contains one or more variables reported to have a significant relationship with iconicity, including frequency of use, likelihood of accurately guessing a signal’s meaning, age of acquisition, visual complexity, or the number of times the item has been used in a signalling game (for details of these datasets and variables, see <https://osf.io/v2ceu/>). From each dataset, we randomly sampled different numbers of iconicity ratings. For each sample, we bootstrapped confidence intervals for coefficients in linear regressions where iconicity predicts one of the variables of interest. Figure 4 plots how these confidence intervals vary by number of ratings sampled. In general, the estimate was relatively stable for more than 10 ratings, but increased – often dramatically – for fewer ratings. Across datasets, the estimate started to plateau before 10 ratings. Since these datasets cover a wide range of stimulus types and outcome variables, we believe such patterns to be generally informative. We thus suggest 10 ratings are a sensible a rule of thumb. However, since a number of factors may affect this decision, researchers may apply our simulation script (at <https://osf.io/v2ceu/>) to their own pilot data.
Bootstrapped confidence intervals for linear regression coefficients, varying by the number of ratings sampled from the datasets cited. In each case, the mean iconicity rating is entered as the independent variable, and the dependent variable is given in each subtitle. Full details are provided at <https://osf.io/v2ceu/>.

In addition to quantity of data, the subjective nature of iconicity ratings may raise concerns about the quality of data. Potentially, raters might respond carelessly or idiosyncratically. This is especially a concern when ratings are collected online (Mason & Suri, Reference Mason and Suri2012), as is frequently the case for iconicity ratings. We provide a script (at <https://osf.io/v2ceu/>) that calculates one measure of problematic responding, the person–total correlation (Dupuis, Meier, & Cuneo, Reference Dupuis, Meier and Cuneo2018), which can be used to evaluate data quality, and potentially exclude random or idiosyncratic responses.
4.2.3. Effects of prior knowledge
As with comprehension studies, previous linguistic and cultural knowledge introduces a potential confound in rating tasks. Researchers must decide whether to recruit raters from a population familiar with the language in question (Perry et al., Reference Perry, Perlman and Lupyan2015; Vinson et al., Reference Vinson, Cormier, Denmark, Schembri and Vigliocco2008), or naive participants (Caselli et al., Reference Caselli, Sevcikova Sehyr, Cohen-Goldberg and Emmorey2017). However, the linguistic and cultural experience of the sample population can affect the results. Occhino et al. (Reference Occhino, Anible, Wilkinson and Morford2017) compared ratings made by native ASL and German Sign Language signers for signs from their own languages and from each other’s languages, and found that signers rated signs from their native language to be more iconic than those from the unknown language. Sevcikova Sehyr and Emmory (in press.) contrast native ASL signers with hearing non-signers, finding that non-signers rate signs more iconic, on average, than signers. In addition, they find differences between signers and non-signers in terms of iconicity ratings based on sign class, handedness, and the mapping strategy of the sign. These results differ from those of Occhino et al. (Reference Occhino, Anible, Wilkinson and Morford2017), and shed further light on how linguistic experience can affect iconic perception. In this case, the authors suggest that the metalinguistic knowledge of the signers (e.g., that two-handed signs encode multiple properties of meaning) might lead to different perceptions of iconicity, compared to the hearing non-signers. These results, taken together, highlight how iconicity, though empirically measurable, is still subjective.
A further potential confound is world knowledge. In a graphical signalling task that investigated how novel symbols evolve (Sulik, Reference Sulik2018), signallers typically drew Harrison Ford with a whip and a fedora (i.e., as Indiana Jones; Figure 2). This is an iconic signal, because the signal resembles its referent. However, the reason people were likely to guess its meaning is not just because it is iconic, but also because these were salient features of many people’s conceptual representations of Harrison Ford. Because of this salience, the drawings produced independently across participants were quite similar, and the signal was easy to guess. In contrast, participants varied a great deal in their conceptual representations of museums: dinosaurs were salient for some, urns and statues for others. Consequently, drawings for this item were less similar, and the signal was harder to guess (Little & Sulik, Reference Little, Sulik, Cuskley, Flaherty, Little, McCrohon, Ravignani and Verhoef2018). Sulik (Reference Sulik2018) provides some suggestions regarding the measurement and analysis of world knowledge as it relates to iconicity. Sevcikova Reference Sevcikova Sehyr and EmmoreySehyr and Emmorey (in press) found a similar result, using Shannon’s diversity index as a measure of response diversity, to assess how different participant responses are to each meaning they respond to. They found that response diversity correlated with iconicity ratings, such that participants produced more consistent guesses in response to ASL signs that had higher iconicity ratings, compared to signs with low iconicity ratings.
A useful distinction for rating task design (Occhino et al., Reference Occhino, Anible, Wilkinson and Morford2017, Reference Sevcikova Sehyr and EmmoreySevcikova Sehyr & Emmory, in press) is between iconicity (form–meaning links, usually based on resemblance) and transparency (the ability to understand the meaning purely based on the form). Though these concepts are highly related (transparent signs are often highly iconic), they are not entirely overlapping; signals that are highly iconic may not be easily understood by naive participants. Similarly, it is sometimes easy to see how a signal resembles its referent once you know what it means, though it might be hard to do so without such knowledge (implying low transparency). For instance, the ASL sign for HOSPITAL, a cross shape outlined on the shoulder, derives from a time when Red Cross armbands were culturally prevalent (Emmorey, Reference Emmorey2014). These types of signs are also known as translucent signs (Klima & Bellugi, Reference Klima and Bellugi1979; Luftig & Lloyd, Reference Luftig and Lloyd1981).
The extent to which iconicity and transparency overlap is illustrated by Sevcikova Reference Sevcikova Sehyr and EmmoreySehyr and Emmorey (in press), who compared iconicity ratings for ASL signs with guessing accuracy for the same signs, and found that some signs rated as highly iconic were still not guessed accurately. They further introduce the idea of ‘perceived transparency’, where participants rate how likely someone else is to guess the same meaning that they had guessed. Importantly, participants can rate signs as highly transparent, even if they have guessed the wrong meaning. Though direct transparency and perceived transparency are highly correlated with iconicity, there are some discrepancies between the three measures, indicating that they are not interchangeable terms. Overall, the iconicity of a signal is tightly bound up with the linguistic knowledge and world knowledge motivating that signal. When collecting ratings based on resemblance, we recommend that researchers carefully consider the linguistic knowledge of the participants, and the world knowledge required for the signal’s interpretation.
4.3. production tasks
Most approaches to measuring iconicity focus on the perceiver, asking if participants commonly recognise iconic properties of a signal. However, some studies have measured iconicity in production tasks, where the question is posed: if participants use similar forms to express a given meaning, could there be something natural or iconic about those forms? For example, Perlman et al. (Reference Perlman, Dale and Lupyan2015) asked pairs of participants to communicate using improvised vocalisations. Participants demonstrated remarkable consistency in their productions, reflecting possible iconic mappings between form and meaning. Nygaard, Herold, and Namy (Reference Nygaard, Herold and Namy2009) found similar consistency of form for prosodic productions in simulated child-directed language.
4.3.1. Operationalisation
Importantly, production tasks focus on the articulatory parameters that are hypothesised as the locus of iconicity, and thus may not directly measure iconicity. For example, Brentari, Coppola, Mazzoni, and Goldin-Meadow (Reference Brentari, Coppola, Mazzoni and Goldin-Meadow2012) analysed finger complexity for different handshapes produced by signers and hearing gesturers. They suggest that a reduction in finger complexity might suggest a reduction in iconicity across a given handshape category, such that signs or gestures for particular meanings lose some of the distinct features that make them iconic. In this case, as in others, the parameter that suggests a change in iconicity is measured using a coding scheme (see Section 3.2). However, there are also automatic ways to measure features that can serve as a proxy for iconicity. For vocal modalities, properties of auditory signals such as pitch and amplitude can be analysed in this way (Little, Eryilmaz, & de Boer, Reference Little, Eryilmaz and de Boer2017b; Perlman & Lupyan Reference Perlman and Lupyan2018), using the open-source software Praat (Boersma & Weenink Reference Boersma and Weenink2018). Another example comes from a set of studies that use a graphical signalling task to investigate the creation and evolution of novel communicative symbols. Garrod, Fay, Lee, Oberlander, and MacLeod (Reference Garrod, Fay, Lee, Oberlander and MacLeod2007), amongst others (Caldwell & Smith, Reference Caldwell and Smith2012; Fay, Garrod, Roberts, & Swoboda, Reference Fay, Garrod, Roberts and Swoboda2010; Sulik, Reference Sulik2018) track the graphical complexity (Pelli, Burns, Farell, & Moore-Page, Reference Pelli, Burns, Farell and Moore-Page2006) of drawings that participants produce – Sulik (Reference Sulik2018) provides a Python script for calculating this. As with Brentari et al. (Reference Brentari, Coppola, Mazzoni and Goldin-Meadow2012), the hypothesis linking this measure to iconicity asserts that lower complexity in the signal suggests a loss of specificity in the signal with relation to its meaning.
We stress that the use of these measures requires a clear hypothesis about how iconicity might manifest in the signals participants produce, in order to devise an appropriate proxy. We further advise that such measures can be supported by direct measures of iconicity. For instance, Perlman et al. (Reference Perlman, Dale and Lupyan2015), combine this approach with a comprehension task in their experiment, using identification accuracy by naive participants to support earlier analyses of acoustic properties.
5. Data-driven measures of iconicity
In the following sections, we discuss how objective, quantitative analyses (i.e., that do not rely on participant or researcher judgements) have been used to measure iconicity and related phenomena in natural languages. Such approaches investigate sound–meaning correspondences across large groups of languages, and focus on identifying statistical regularities across languages (Blasi, Wichmann, Hammarström, Stadler, & Christiansen, Reference Blasi, Wichmann, Hammarström, Stadler and Christiansen2016; Haynie, Bowern, & LaPalombara Reference Haynie, Bowern and LaPalombara2014; Urban, Reference Urban2011; Wichmann, Holman, & Brown, Reference Wichmann, Holman and Brown2013). As such, some applications of these measures do not directly measure iconicity, but rather systematicity. Therefore, these approaches are useful for identifying non-arbitrariness in language, and can be used to generate and test hypotheses that directly address iconicity.
5.1. cross-linguistic form–meaning correspondence
One set of regularities that researchers can look for in linguistic systems are systematic mappings between features of words and features of meanings, an approach largely agnostic to what types of mappings are expected. For example, Blasi et al. (Reference Blasi, Wichmann, Hammarström, Stadler and Christiansen2016) analysed data from thousands of languages to explore cross-linguistic regularities in form–meaning mappings. They found, for example, that words for ‘tongue’ were associated with the lateral phoneme /l/, and words for ‘breasts’ disproportionately contain the phoneme /m/. In total, they found 72 statistically robust associations, for which they can generate specific numerical predictions about the strengths of potential biases – e.g., that the association between the meaning ‘tongue’ and /l/ is much stronger than the correlation between the meaning ‘name’ and /i/. Crucially, their approach attempted to correct for historical relatedness of languages, as well as features of their areal distribution and contact – even in unrelated languages certain sound–meaning mappings are more common than would be expected by chance.
5.2. from correspondence to iconicity
The question remains, then, how measures such as these, which are neutral in their predictions about specific form–meaning relationships, pertain to iconicity. Indeed, the analysis conducted by Blasi et al. (Reference Blasi, Wichmann, Hammarström, Stadler and Christiansen2016) does not provide evidence that the relationships found are iconic, only that they are statistically reliable. However, the value of such research for studies of iconicity is that they offer clear and testable hypotheses for iconic relationships, both within a linguistic system and cross-linguistically. In this way, objective measures of systematicity may go hand in hand with the behavioural methods discussed in this paper, which can be used to empirically test whether (and how) people are sensitive to these form–meaning relationships during language comprehension and processing. For example, Carr, Smith, Cornish, and Kirby (Reference Carr, Smith, Cornish and Kirby2016) measured sound symbolism in the signals that emerged in their experiments by testing the relationship between the meanings in the experiment (triangles) and the phonemes in the signals participants produced that showed an association with spiky stimuli in previous literature (e.g., Köhler, Reference Köhler1929; Kovic, Plunkett, & Westermann, Reference Kovic, Plunkett and Westermann2010; Maurer, Pathman, & Mondloch, Reference Maurer, Pathman and Mondloch2006). In this way, the authors used prior findings from iconicity research as an assumption, rather than asking new participants to rate the signal–meaning pairs.
To maximise the number of languages that can be compared, data-driven approaches often rely on lists of core vocabulary, such as the Swadesh list (Blasi et al., Reference Blasi, Wichmann, Hammarström, Stadler and Christiansen2016; Wichmann et al., Reference Wichmann, Holman and Brown2013). However, a potential weakness of this approach is that such core vocabulary is not necessarily where one would expect high levels of iconicity. Rather than looking at the largest datasets, blind to the relationships you expect to find, it is possible to instead focus on meaning domains for which we would expect iconic mappings – such as those that describe sensory referents (Winter et al., Reference Winter, Perlman, Perry and Lupyan2017), or convey magnitude (Haynie et al., Reference Haynie, Bowern and LaPalombara2014). Using this more selective approach, Joo (Reference Joo2018) found a proportionately higher number of associations across unrelated languages. Thus, though the data-driven approach is useful for identifying potential cases of systematicity in language, we caution that claims about iconicity benefit from clear hypotheses about where iconicity is expected to occur.
6. Conclusion
Quantitative and experimental research into iconicity has made significant headway in providing robust methods for identifying iconicity and understanding its effects. We hope that, from the discussion of methods we have presented, it is clear that there already exists a well-stocked methodological toolbox to take advantage of. However, we have also highlighted how specific design choices can produce different effects. Most productively, we believe it is important to recognise how these approaches can inform each other and feed into a more complete understanding of iconicity. Behavioural approaches to studying iconicity have provided us with a wealth of information about what kinds of associations experimental participants identify. Theory-neutral data-driven approaches come at the problem from the opposite side, asking simply which non-arbitrary associations between form and meaning can be found in a given dataset. Knowledge gleaned from behavioural experiments can be used to guide data-driven approaches, both by informing the meanings that we use, and how signals are coded. Similarly, the findings of data-driven approaches can be tested behaviourally to determine the degree to which they reflect true iconicity, rather than systematic associations driven by non-iconic factors (e.g., Carr et al., Reference Carr, Smith, Cornish and Kirby2016). Moving forward, we propose that clarity in the following areas is paramount:
1. The definition of iconicity – what are you measuring?
2. The testing hypothesis – why are you measuring it?
3. The set of measures – how are you measuring it?
We have highlighted that different approaches to iconicity may rest on small but non-trivial differences in their definition of the object at study. Following the example of the instructions given by Vinson et al. (Reference Vinson, Cormier, Denmark, Schembri and Vigliocco2008), a strict resemblance-based criterion for iconicity (signal must resemble the meaning) may seed different results from a classification based on recognition (signal is recognisably associated with the meaning). Participants with existing knowledge of a system may recognise signs as iconic that naive viewers would not (Occhino et al., Reference Occhino, Anible, Wilkinson and Morford2017). A method that looks at how well participants recognise iconic mappings (Thompson et al., Reference Thompson, Vinson and Vigliocco2009) tests something different from a method that asks participants to classify signals as iconic (Perry et al., Reference Perry, Perlman and Lupyan2015), though they both fall under the umbrella of iconicity research. These variations are useful, in that they can tap into the different roles iconicity might play in language processing, but clarity along these lines ensures that results are fully interpretable given the diversity of methods. The study of iconicity spans multiple fields in linguistics, psychology, and cognitive science, and as such demands a focused, collaborative research programme that carefully considers how iconicity and its effects can be measured, across languages and domains. Thus far, iconicity researchers are far from consensus both on the terminology used and how results are interpreted. We suggest that clear definitions and hypotheses can help us to recognise specific definitions and operationalisations, and understand how they might affect the interpretation of results. In turn, this offers a better chance of reaching a consensus on terminology, methodology, and interpretation. If we are ever to develop a complete theory of iconicity in language learning, processing, and evolution, we must find a common framework to unify these diverse methodological approaches.