





1. Introduction
As a typical fluid flow phenomenon, turbulent thermal convection that is driven by the temperature gradient occurs ubiquitously in nature. For example, it plays a crucial role in the atmospheric and oceanic circulations, the Earth's mantle movement, the formation of the geomagnetic field, as well as numerous industrial applications. A paradigmatic model to study this kind of flow is turbulent Rayleigh–Bénard (RB) convection (Ahlers, Grossmann & Lohse Reference Ahlers, Grossmann and Lohse2009; Lohse & Xia Reference Lohse and Xia2010; Chillà & Schumacher Reference Chillà and Schumacher2012; Sun & Zhou Reference Sun and Zhou2014), i.e. the motion of a fluid layer sandwiched between two horizontal conducting plates heated from below and cooled from above. From a fundamental point of view, a key issue for turbulent RB convection is to reveal the relationship between the global heat-transfer efficiency, which is expressed in terms of the Nusselt number
 \begin{equation} Nu = \frac{Q}{\chi\varDelta/H}, \end{equation}
and the control parameters of the system, called the Rayleigh number  $Ra$ and the Prandtl number
 $Pr$, namely
 \begin{equation} Ra=\frac{\alpha g\varDelta H^3}{\nu\kappa} \quad \text{and}\quad Pr=\frac{\nu}{\kappa}, \end{equation}
where  $Q$ is the transported heat flux across the fluid layer of height
 $H$ for an applied temperature difference
 $\varDelta$,
 $g$ is the gravitational acceleration,
 $\chi$,
 $\alpha$,
 $\nu$ and
 $\kappa$ are the thermal conductivity, thermal expansion coefficient, kinematic viscosity and thermal diffusivity of the working fluid, respectively. Some of the earliest systematic studies and important theories (Malkus Reference Malkus1954; Priestly Reference Priestly1954; Kraichnan Reference Kraichnan1962; Howard Reference Howard1963; Spiegel Reference Spiegel1971) focused on this issue, and have stimulated many experimental (Xia, Xin & Tong Reference Xia, Xin and Tong1995; Xin, Xia & Tong Reference Xin, Xia and Tong1996; Xia, Lam & Zhou Reference Xia, Lam and Zhou2002; du Puits, Resagk & Thess Reference du Puits, Resagk and Thess2010; Roche et al. Reference Roche, Gauthier, Kaiser and Salort2010; He et al. Reference He, Funfschilling, Nobach, Bodenschatz and Ahlers2012; Bao et al. Reference Bao, Chen, Liu, She, Zhang and Zhou2015; Lepot, Aumaître & Gallet Reference Lepot, Aumaître and Gallet2018; Wang, Mathai & Sun Reference Wang, Mathai and Sun2019; Zhu et al. Reference Zhu, Jiang, Zhou and Sun2019a), numerical (Verzicco & Camussi Reference Verzicco and Camussi1999; Silano, Sreenivasan & Verzicco Reference Silano, Sreenivasan and Verzicco2010; Stevens, Lohse & Verzicco Reference Stevens, Lohse and Verzicco2011; Huang & Zhou Reference Huang and Zhou2013; Kaczorowski & Xia Reference Kaczorowski and Xia2013; van der Poel, Stevens & Lohse Reference van der Poel, Stevens and Lohse2013; Pandey & Verma Reference Pandey and Verma2016; Zwirner & Shishkina Reference Zwirner and Shishkina2018; Wang, Zhou & Sun Reference Wang, Zhou and Sun2020) and theoretical (Dubrulle Reference Dubrulle2002; Grossmann & Lohse Reference Grossmann and Lohse2004, Reference Grossmann and Lohse2011; Whitehead & Doering Reference Whitehead and Doering2011; Shishkina et al. Reference Shishkina, Horn, Wagner and Ching2015) investigations in the past several decades. Among these studies, the scaling relation has been widely used to describe the dependence
 $Nu(Ra, Pr)$ (see, Ahlers et al. (Reference Ahlers, Grossmann and Lohse2009); Chillà & Schumacher (Reference Chillà and Schumacher2012), for recent reviews).
Although thermal convection is believed to be an effective means to transport heat via a moving fluid – it carries upwards a heat flux which is normally many times larger than that by thermal diffusion – the turbulent heat-exchange efficiency is vastly limited by thermal diffusion in the boundary layers (BLs). As the enhancement of heat transfer is of fundamental interest and especially useful in many thermal engineering processes, some strategies have been put forward to overcome the BL limitation and to achieve high heat flux. Among these methods, the introduction of wall roughness is the most widely used one (Roche et al. Reference Roche, Castaing, Chabaud and Hebral2001; Qiu, Xia & Tong Reference Qiu, Xia and Tong2005; Tisserand et al. Reference Tisserand, Creyssels, Gasteuil, Pabiou, Gibert, Castaing and Chillà2011; Wei et al. Reference Wei, Chan, Ni, Zhao and Xia2014; Liot et al. Reference Liot, Ehlinger, Rusaouen, Coudarchet, Salort and Chillà2017; Xie & Xia Reference Xie and Xia2017; Jiang et al. Reference Jiang, Zhu, Mathai, Verzicco, Lohse and Sun2018; Rusaouen et al. Reference Rusaouen, Liot, Castaing, Salort and Chillà2018; Foroozani et al. Reference Foroozani, Niemela, Armenio and Sreenivasan2019; Zhu et al. Reference Zhu, Stevens, Shishkina, Verzicco and Lohse2019b). For instance, Du & Tong (Reference Du and Tong1998, Reference Du and Tong2000) experimentally observed that rough surfaces could enhance the detachment of the thermal BL from the tips of rough elements, and hence the heat transport across the cell with rough upper and lower surfaces is increased by more than  $76\,\%$. Numerical results of Stringano, Pascazio & Verzicco (Reference Stringano, Pascazio and Verzicco2006) and Salort et al. (Reference Salort, Liot, Rusaouen, Seychelles, Tisserand, Creyssels, Castaing and Chillà2014) also reported an increase of heat transfer when the mean thermal BL thickness becomes smaller than the roughness height. In a cylindrical cell with a set of isothermal obstacles attached to the plates, Emran & Shishkina (Reference Emran and Shishkina2020) recently showed that the global heat flux can be several times that in the traditional smooth cell when the obstacle rings are very tall and the gaps between them are sufficiently wide. On the other aspect, Ciliberto & Laroche (Reference Ciliberto and Laroche1999) experimentally found that the scaling exponent of heat transport between
 $Nu$ and
 $Ra$ increases if the roughness has power-law distributed heights and the thermal BL thickness is smaller than the maximum roughness size. With sinusoidally rough upper and lower surfaces in two dimensions, Toppaladoddi, Succi & Wettlaufer (Reference Toppaladoddi, Succi and Wettlaufer2015, Reference Toppaladoddi, Succi and Wettlaufer2017) numerically showed that the
 $Nu(Ra)$ scaling exponent reaches the value of 0.5 for a certain roughness wavelength. Recent studies (Zhu et al. Reference Zhu, Stevens, Verzicco and Lohse2017; MacDonald et al. Reference MacDonald, Hutchins, Lohse and Chung2019; Emran & Shishkina Reference Emran and Shishkina2020) further revealed that at height
 $Ra$ the
 $Nu(Ra)$ exponent decreases back to the exponent in the smooth cell, due to the competition between the turbulent bulk and BL flow.
Nevertheless, when looking closely into the results in the literature, some data (Stringano et al. Reference Stringano, Pascazio and Verzicco2006; Zhu et al. Reference Zhu, Stevens, Verzicco and Lohse2017) seem to suggest that surface roughness would also reduce the global heat transport through the convection system. Indeed, Shishkina & Wagner (Reference Shishkina and Wagner2011) argued that when the distances between rough elements are very small, a reduction of the resulting  $Nu$ is possible due to the decrease of the effective
 $Ra$. In a previous work, we systematically investigated
 $Nu(h)$ in both two-dimensional (2-D) and three-dimensional (3-D) cells with rough elements of height
 $h$ (Zhang et al. Reference Zhang, Sun, Bao and Zhou2018). Our results revealed that when
 $h$ is small or
 $Ra$ is low, the global heat transport may be suppressed as the hot/cold fluid is trapped and accumulates inside the cavity regions between the adjacent rough elements, leading to much thicker thermal BLs in these regions. On the other hand, when
 $h$ is large or
 $Ra$ is high enough, the large-scale circulation (LSC) in the bulk can penetrate into the cavities, vigorously mixing the trapped hot/cold fluid, and thus significantly improving the heat-exchange efficiency of the system. The division between these two regimes (i.e. the
 $Nu$-reduction and
 $Nu$-enhancement regimes) then gives a critical roughness height
 $h_c$, at which
 $Nu(h)$ crosses the value of
 $Nu(h=0)$ of the smooth cell.
As a typical length scale for the convective heat transfer,  $h_c$ denotes the onset of the
 $Nu$-enhancement induced by rough surfaces. Therefore, it is of great interest and fundamental importance to reveal its dependence on the control parameters of the system, such as
 $h_c(Ra, Pr)$. Our previous results have shown that
 $h_c$ decreases with growing
 $Ra$ as
 $h_c\sim Ra^{-0.6}$. The objective of the present paper is to reveal the
 $Pr$ effects on
 $h_c$ with the help of direct numerical simulations of turbulent thermal convection in a 2-D square box. Note that the
 $Pr$-dependence in three dimensions may be different from that in two dimensions, as the observed phenomenon at low to intermediate
 $Pr$ could be different in three dimensions (van der Poel et al. Reference van der Poel, Stevens and Lohse2013). The paper is organized as follows. Section 2 gives a brief description of the governing equations and numerical methods adopted. The
 $Pr$-dependence of
 $h_c$ is discussed and analysed in § 3, where we try to understand the mechanism that dominates the observed
 $h_c(Pr)$ relation in three different
 $Pr$ regimes. Finally, we summarize our results in § 4.
2. Numerical methods
The coupled equations of motion for the velocity field  $\boldsymbol {u}$ (
 $=u\boldsymbol {x}+w\boldsymbol {z}$) and the temperature field
 $\theta$ in the Oberbeck–Boussinesq approximation of turbulent thermal convection are numerically solved,
 \begin{gather} \boldsymbol{\nabla} \boldsymbol{\cdot} \boldsymbol{u}=0, \end{gather}
 \begin{gather}\partial_t \boldsymbol{u}+(\boldsymbol{u} \boldsymbol{\cdot} \boldsymbol{\nabla}) \boldsymbol{u}=-\boldsymbol{\nabla} p+\sqrt{\frac{P r}{R a}} \nabla^{2} \boldsymbol{u}+\theta \boldsymbol{z}, \end{gather}
 \begin{gather}\partial_t \theta+(\boldsymbol{u} \boldsymbol{\cdot} \boldsymbol{\nabla}) \theta=\sqrt{\frac{1}{{R a} P r}} \nabla^{2} \theta, \end{gather}
where  $p$ is the kinematic pressure field and
 $\boldsymbol {x}$ and
 $\boldsymbol {z}$ are, respectively, the unit vectors in the horizontal and vertical directions. The equations have been non-dimensionalized with respect to the cell height
 $H$, the imposed temperature difference across the cell
 $\varDelta$ and the free-fall velocity
 $\sqrt {\alpha g\varDelta H}$.
The convection cell adopted is a 2-D square box of height  $H=1$, width
 $D=1$ and aspect ratio
 $\varGamma =D/H=1$. As shown in figure 1, the triangular rough elements with a vertex angle of
 $90^{\circ }$, height
 $h$ and base width
 $2h$ are located on both of the upper and lower conducting plates. To study the effects of surface roughness on the global heat transport, we systematically vary the roughness height
 $h$. For such roughness geometry, the contact area of the rough surface is
 $41\,\%$ larger than the smooth surface and does not change with the roughness height
 $h$. Hence, the contact area does not contribute to the variations in the measured
 $Nu$ when changing
 $h$. In the present study, we simulate over the parameter ranges
 $10^7\leqslant Ra\leqslant 10^9$ and
 $0.01\leqslant Pr\leqslant 100$, mainly focusing on the effects of the Prandtl number
 $Pr$ on the global heat transport through the RB system with rough surfaces. At least 10 individual simulations with different
 $h_c$ were carried out for each set of
 $(Ra, Pr)$, and a total of more than 400 independent realizations of 2-D turbulent RB convection with rough surfaces have been performed in the present study.
A sketch of the 2-D convection cell with the coordinate system. Right-triangular rough elements with a vertex angle of  $90^{\circ }$, height
 $h$ and base width
 $2h$ are located on either of the conducting plates.

During the simulations, the temperatures of the upper and lower conducting plates are fixed at  $\theta _t=-0.5$ and
 $\theta _b=0.5$, respectively, while the vertical sidewalls are thermally insulated (i.e.
 $\partial \theta /\partial \boldsymbol {n}=0$). No-slip boundary conditions are applied at all solid surfaces for the velocity field. In our numerical code, a fourth-order finite-difference scheme with staggered grids is adopted to solve the governing equations and an immersed boundary method is applied to deal with the boundaries of rough elements. Non-equidistant meshes are implemented and the computational meshes are refined close to all solid walls so that the thermal and viscous BLs near the rough surfaces are, respectively, resolved with at least 16 and 15 grid points for all runs.
Our numerical code has been extensively used in previous studies (Bao et al. Reference Bao, Chen, Liu, She, Zhang and Zhou2015; Zhang et al. Reference Zhang, Sun, Bao and Zhou2018, Reference Zhang, Xia, Dong, Wang and Zhou2019). Here, to further validate the code, we compare in figure 2(a) the measured Nusselt number  $Nu$ as a function of the Prandtl number
 $Pr$ obtained at
 $Ra=10^8$ in the smooth cell with those of Huang & Zhou (Reference Huang and Zhou2013) and van der Poel et al. (Reference van der Poel, Stevens and Lohse2013). Although the dependence between
 $Nu$ and
 $Pr$ seems to be a bit complicated, excellent agreement among the three data sets can be clearly observed, illustrating the good quality of the present simulations. We further note that the Nusselt number of the smooth cell we measure (
 $Nu=50.85$ at
 $Ra=10^9$ and
 $Pr=1$) is in agreement with the one computed using the open-source code Nek5000 by Xu et al. (Reference Xu, Wang, Wan, Yan and Sun2018) (
 $Nu=50.833$) to a precision of less than
 $1\,\%$.
(a) The Nusselt number  $Nu$ as a function of
 $Pr$ obtained in the smooth cell at
 $Ra=10^8$. For comparison, we also plot the data from Huang & Zhou (Reference Huang and Zhou2013) (triangles) and van der Poel et al. (Reference van der Poel, Stevens and Lohse2013) (diamonds). (b) The Nusselt number
 $Nu$ as a function of
 $Pr$ at
 $Ra=10^8$ obtained in the smooth cell and rough cells of three typical roughness heights
 $h=0.02$, 0.05 and 0.125. (c) The corresponding ratio
 $Nu(h)/Nu(0)$ as a function of
 $Pr$. The data are the same as those in panel (b). Different colours mark the three regimes and the two dashed lines indicate the two transitional Prandtl numbers,
 $Pr_{t1}$ and
 $Pr_{t2}$, obtained at
 $Ra=10^8$.

3. Results and discussion
We first examine the Nusselt number  $Nu$, which is calculated as
 \begin{equation} Nu = \sqrt{PrRa}\langle w\theta\rangle - \langle\partial_z\theta\rangle, \end{equation}
where  $w$ is the vertical velocity,
 $\partial _z$ is the vertical derivative and
 $\langle \cdot \rangle$ indicates the average over time and over the midheight horizontal plane. The temporal average is performed over a duration of more than 500 dimensionless time units after the convective flow in the system has been fully developed. The time convergence of
 $Nu$ is checked by comparing the time-averages over the first and the last halves of the simulation, and the resulting error is smaller than
 $2\,\%$ for all runs.
In figure 2(b) we show a semilog plot of the numerically measured  $Nu$ versus the Prandtl number
 $Pr$ obtained in rough cells of three typical heights
 $h=0.02$, 0.05 and 0.125. For comparison, the global convective heat flux through a smooth cell,
 $Nu(h=0)$, is also plotted. In general, the heat-transfer efficiency is enhanced with increasing
 $Pr$. For most values of
 $Pr$ studied,
 $Nu(h)$ is higher than that of the smooth cell for large roughness height (e.g.
 $h=0.125$, blue down-triangles), and is lower than the corresponding
 $Nu(0)$ for small
 $h$ (e.g.
 $h=0.02$, green squares). The situation for medium roughness height (e.g.
 $h=0.05$, pink diamonds) seems to be more complicated. To better compare the data, we adopt
 $Nu(0)$ of the smooth cell to normalize
 $Nu(h)$ of the rough cells, and the corresponding results are displayed in figure 2(c). Clearly, the data of
 $h=0.05$ exhibit a zigzag dependence on
 $Pr$, i.e.
 $Nu(h)/Nu(0)$ is an increasing function for small or large
 $Pr$ and is a decreasing function for intermediate
 $Pr$. As discovered by Zhang et al. (Reference Zhang, Sun, Bao and Zhou2018), there is a critical roughness height
 $h_c$:
 $Nu(h)/Nu(0)>1$ for
 $h>h_c$, while
 $Nu(h)/Nu(0)<1$ for
 $h<h_c$. The zigzag behaviours of
 $Nu(h)/Nu(0)$ on
 $Pr$ thus imply a complicated
 $Pr$-dependence of
 $h_c$. Indeed, as we shall see below, the zigzag behaviour of the
 $h=0.05$ data exactly coincides with the three regimes of
 $h_c(Pr)$.
The normalized Nusselt number,  $Nu(h)/Nu(0)$, is plotted in figure 3(a,c,e) as a function of the roughness height
 $h$ for several values of
 $Pr$ varying from 0.01 to 100. Similar to our previous results at fixed
 $Pr=0.7$ (Zhang et al. Reference Zhang, Sun, Bao and Zhou2018), the data sets of all
 $Pr$ studied can be divided into two regimes: the
 $Nu$-reduction regime at small
 $h$ and the
 $Nu$-enhancement regime at large
 $h$. The crossover between these two regimes thus yields a critical roughness height
 $h_c$, at which
 $Nu(h_c)=Nu(h=0)$, denoting the onset of
 $Nu$-enhancement induced by rough surfaces. The dashed lines in figure 3(e) illustrate how
 $h_c$ is obtained in our simulations. Specifically, a linear function is used to fit the data of
 $Nu(h)$ around
 $Nu(h)/Nu(0)=1$, and then the critical roughness height
 $h_c$ is determined by the crossing between the fitting and the value of unity. It is clearly seen that
 $h_c$ varies with
 $Pr$, i.e.
 $h_c$ is in general large for low
 $Pr$, but small for high
 $Pr$. Furthermore, the overall magnitudes of
 $Nu$ for high
 $Pr$ are in general larger than those for low
 $Pr$, i.e. the
 $Nu$-reduction is more pronounced and the
 $Nu$-enhancement is much weaker for low
 $Pr$. Therefore, the
 $Nu$-reduction problem induced by surface roughness becomes more relevant for low
 $Pr$. For moderate
 $Pr$, on the other hand, the dependence of
 $h_c$ on
 $Pr$ seems to be a bit complicated. Note that
 $Nu(h)/Nu(0)$ varies non-monotonically with
 $h$ for
 $h>h_c$. As argued by Zhu et al. (Reference Zhu, Stevens, Verzicco and Lohse2017) and Zhang et al. (Reference Zhang, Sun, Bao and Zhou2018), this may be caused by the transition from the bulk-controlled regime to the BL-dominated regime with the increasing roughness size.
The ratio  $Nu(h)/Nu(0)$ as a function of (a,c,e)
 $h$ and (b,d,f)
 $h/h_c$ obtained at (a,b)
 $Ra=10^7$, (c,d)
 $Ra=10^8$ and (e,f)
 $Ra=10^9$ for
 $Pr$ varying from 0.01 to 100. The dashed lines in panel (e) show the determination of the critical roughness height
 $h_c$ at which
 $Nu(h)/Nu(0)=1$.

To compare  $Nu(h)$ obtained at different
 $Pr$, we use
 $h_c$ to normalize the data, and the corresponding results are plotted in figure 3(b,d,f). Unlike our previous results which show a nearly universal profile between
 $Nu(h)/Nu(0)$ and
 $h/h_c$ for different
 $Ra$ (Zhang et al. Reference Zhang, Sun, Bao and Zhou2018), the symbols for different
 $Pr$ cannot collapse well on top of each other. This discrepancy is a result of the different regimes, i.e. the convective flow in different
 $Pr$-regimes is governed by different dynamics.
In order to reveal the detailed relation between  $h_c$ and
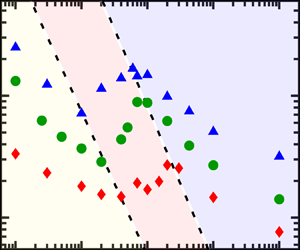
 $Pr$, we plot in figure 4 the measured
 $h_c$ as a function of
 $Pr$ for three
 $Ra$. The value of
 $h_c$ decreases with increasing
 $Pr$ for too small and too large
 $Pr$, but increases with ascending
 $Pr$ for medium
 $Pr$. Based on the observed
 $h_c(Pr)$ relation, one can identify three flow regimes, which are marked by different colours as shown in figure 4. As we shall see below, the three regimes are governed by different flow dynamics, and can be referred to the LSC-controlled regime, the corner–LSC-competition regime and the plume-controlled regime, respectively.
Log–log plot of the critical roughness height  $h_c$ as a function of
 $Pr$ obtained at
 $Ra=10^7$ (triangles),
 $Ra=10^8$ (circles) and
 $Ra=10^9$ (diamonds). Three flow regimes can be separated by two transitional Prandtl numbers,
 $Pr_{t1}$ and
 $Pr_{t2}$, and indicated by different colours: the LSC-controlled regime (yellow), the corner–LSC-competition regime (pink) and the plume-controlled regime (cyan). The solid line indicates the scaling
 $h_c\sim Re^{-1}\sim Pr^{0.88}$ (Zhang et al. Reference Zhang, Sun, Bao and Zhou2018) for reference.

It should be noted that based on dimensional analysis, our previous work (Zhang et al. Reference Zhang, Sun, Bao and Zhou2018) yielded a scaling relation between  $h_c$ and the Reynolds number
 $Re$, i.e.
 $h_c\sim Re^{-1}$, by assuming a balance between the inertial and viscous forces. This, taken together with the results of
 $Re\sim Pr^{-0.88\pm 0.04}$ in § 3.4, one obtains
 $h_c\sim Pr^{0.88}$. In figure 4, we plot this scaling as the solid line for reference. It is clearly seen that the scaling is a good description for the data at
 $Ra=10^8$, but the data at
 $Ra=10^7$ and
 $10^9$ are less well described by this trend, which indicates that the dynamics are not as simple as suggested by the previous dimensional analysis. Indeed, a much more complicated zigzag dependence of
 $h_c(Pr)$ is obtained in the present study. The reason for this discrepancy may be due to the fact that thermal effects (or the plume dynamics) are not considered in the previous dimensional analysis. As we shall see below, the plume dynamics plays a central role in the transitions among the three regimes. In the remainder of this paper, we will focus on the flow dynamics in each regime.
3.1. The LSC-controlled regime
We next focus on the low- $Pr$ regime. Figure 5(a,b) shows the time-averaged temperature and velocity fields obtained at
 $Ra=10^8$ and
 $Pr=0.01$ in the smooth cell and in the rough cell with
 $h=0.05$, respectively. The mean dominant flow pattern is a square-like anticlockwise rotatory motion. From the corresponding movie, one can also see some smaller secondary rolls at the corners of the cell. In this low-
 $Pr$ regime, however, these corner-flow rolls are not stable and could detach from the corners and hence are not pronounced in the mean flow field, as shown in figure 5(a). This is because the corner-flow rolls are energetically fed by thermal plumes that are emitted from thermal BLs (Sugiyama et al. Reference Sugiyama, Ni, Stevens, Chan, Zhou, Xi, Sun, Grossmann, Xia and Lohse2010). But at low
 $Pr$ (i.e. for large thermal diffusivity), thermal plumes are hardly being generated (Verzicco & Camussi Reference Verzicco and Camussi1999), since they can much more easily lose their thermal energy through thermal diffusion. Therefore, for low
 $Pr$, the flow is dominated by the single LSC, which we refer to as the LSC-controlled regime.
Snapshots of the time-averaged temperature (colour) and velocity (arrows) fields at  $Ra=10^8$ and
 $Pr=0.01$ in the LSC-controlled regime obtained (a) in the smooth cell and (b) in the rough cell with
 $h=0.05$ (the
 $Nu$-reduction regime). The corresponding movie is provided in the supplementary material available at https://doi.org/10.1017/jfm.2020.1091.

To understand the behaviour of  $h_c(Pr)$ in the LSC-controlled regime, we note that the global heat flux through the RB system is depressed for too small
 $Pr$. Indeed, as revealed by figure 2(a),
 $Nu$ decreases from 25.5 at
 $Pr=0.2$ to 16.4 at
 $Pr=0.01$. The decrease in heat transport for a given
 $Ra$ as
 $Pr$ drops has already been observed in previous numerical (Verzicco & Camussi Reference Verzicco and Camussi1999; Scheel & Schumacher Reference Scheel and Schumacher2016; Zwirner & Shishkina Reference Zwirner and Shishkina2018; Xu, Shi & Xi Reference Xu, Shi and Xi2019) and experimental (Horanyi, Krebs & Müller Reference Horanyi, Krebs and Müller1999; Xia et al. Reference Xia, Lam and Zhou2002; Frick et al. Reference Frick, Khalilov, Kolesnichenko, Mamykin, Pakholkov, Pavlinov and Rogozhkin2015) studies. The reason for such a decrease in
 $Nu(Pr)$, as argued by Grossmann & Lohse (Reference Grossmann and Lohse2004, Reference Grossmann and Lohse2008), is that the convective flow at low Prandtl numbers is dominated by molecular transport, and correspondingly does not significantly contribute to the global heat transport.
As the convective heat transport is mainly determined by the conductive thermal BLs in the classical regime of turbulent thermal convection, the decrease in  $Nu(Pr)$ with descending
 $Pr$ means the thickening of thermal BLs. Figure 6(a) shows the mean thermal BL thickness
 $\delta ^0_{th}$, estimated using
 $\delta ^0_{th}=1/[2Nu(0)]$, as a function of
 $Pr$ obtained in the smooth cell at
 $Ra=10^8$. Here, only part of the data is shown because we mainly focus on the flow dynamics in the low-
 $Pr$ regime. It is illustrated that
 $\delta ^0_{th}$ is elevated with descending
 $Pr$ in the LSC-controlled regime (i.e. the yellow-shaded area), as expected from the
 $Nu$ data in figure 2(a). Figure 6(b) displays the local thermal BL thickness
 $\delta ^0_{th}(x)$ along the lower plate obtained at three
 $Pr$ in the smooth cell. Here,
 $\delta ^0_{th}(x)$ is determined as the distance at which the tangent of the time-averaged temperature profile at the lower plate meets the bulk temperature (Zhou & Xia Reference Zhou and Xia2013). It is further illustrated that at low Prandtl numbers thermal BLs thicken with decreasing
 $Pr$. A thicker thermal BL would make the bulk flow harder to penetrate into the cavities between the rough elements and properly mix the trapped hot/cold fluid. Therefore, higher rough elements are needed to disrupt thermal BLs and enhance the global heat transport through the system, which leads to the increase of
 $h_c$ with decreasing
 $Pr$ in the LSC-controlled regime.
(a) The mean thermal BL thickness,  $\delta ^0_{th}$, as a function of
 $Pr$ obtained in the smooth cell at
 $Ra=10^8$. Here,
 $\delta ^0_{th}$ is estimated using
 $\delta ^0_{th}=1/[2Nu(0)]$. The yellow-shaded area corresponds to the LSC-controlled regime. (b) The local thermal BL thickness,
 $\delta ^0_{th}(x)$, in the
 $z$-direction near the lower plate as a function of the horizontal position
 $x$ obtained in the smooth cell at
 $Ra=10^8$ and at three different
 $Pr$. Here,
 $\delta ^0_{th}(x)$ is determined from the time-averaged temperature profiles using the ‘slope’ method (Zhou & Xia Reference Zhou and Xia2013).

3.2. The corner–LSC-competition regime
With the increase in  $Pr$ (i.e. the decrease in thermal diffusivity), thermal plumes become more coherent and then detach from thermal BLs. Some of these plumes are trapped in the corner and provide energy to the corner flows. Correspondingly, some stable corner-flow rolls can be developed at medium Prandtl numbers. Figure 7(a) shows the time-averaged velocity and temperature fields at
 $Ra=10^8$ and
 $Pr=0.4$ in the smooth cell. As we can see, except for the dominant stadium-like LSC that is diagonally orientated in the cell, two smaller clockwise rolls are built up well at the two opposite corners. When the hot/cold fluids move upwards/downwards with the corner flows, they encounter and then compete with the LSC. Due to the relatively weak strength of the corner rolls, these hot/cold fluids are forced back to the hot/cold plates. This process gives rise to strong counter-gradient local heat flux that negatively contributes to the global heat transport (Huang & Zhou Reference Huang and Zhou2013). Such a competition also plays a crucial role in the flow dynamics of turbulent RB convection, such as the reversals of the LSC (Sugiyama et al. Reference Sugiyama, Ni, Stevens, Chan, Zhou, Xi, Sun, Grossmann, Xia and Lohse2010; Chandra & Verma Reference Chandra and Verma2013). Therefore, for moderate
 $Pr$, there exists an intense competition between the corner-flow rolls and the LSC, which we refer to as the corner–LSC-competition regime.
Snapshots of the time-averaged temperature (colour) and velocity (arrows) fields at  $Ra=10^8$ and
 $Pr=0.4$ in the corner–LSC-competition regime obtained (a) in the smooth cell and (b) in the rough cell with
 $h=0.0833$ (the
 $Nu$-enhancement regime). The corresponding movie is provided in the supplementary material.

When wall roughness is introduced into the system, more plumes are produced and erupted from the tips of rough elements (Du & Tong Reference Du and Tong1998, Reference Du and Tong2000), and then enter the convective bulk. A detailed observation of the supplementary movie corresponding to figure 7 reveals that these plumes interact with the large-scale flow structures in the bulk. When these plumes are strong enough (i.e. for rough elements high enough), they make the corner-flow rolls unstable. Figure 7(b) shows the time-averaged flow field obtained in a rough cell with  $h=0.0833$ in the
 $Nu$-enhancement regime. Unlike the smooth case (see figure 7a), the corner-flow rolls are dramatically suppressed in this rough case due to the disturbance induced by the interaction of thermal plumes from the roughness tips. As stated above, the corner-flow rolls negatively contribute to the global heat transport via the corner–LSC competition, and thus the suppression of the corner flows would result in an enhancement of the heat-transfer efficiency of the system.
In the corner–LSC-competition regime, the increase of the critical roughness height  $h_c$ with
 $Pr$ may be attributed to two effects. First, as
 $Pr$ increases, the corner rolls grow in both kinetic energy and size and their strength becomes stronger (Sugiyama et al. Reference Sugiyama, Ni, Stevens, Chan, Zhou, Xi, Sun, Grossmann, Xia and Lohse2010; Huang & Zhou Reference Huang and Zhou2013). Correspondingly, higher rough elements are needed to disrupt the stronger corner-flow rolls and suppress the counter-gradient heat transport induced by the corner–LSC competition. The second possible factor is that the flow inside the cavities between the rough elements becomes more viscous with the increase in
 $Pr$ (i.e. the increase in kinematic viscosity). Accordingly, a larger roughness height is needed to vigorously mix the trapped hot/cold fluid within the cavity regions and achieve a heat-transport enhancement (Zhang et al. Reference Zhang, Sun, Bao and Zhou2018).
3.3. The plume-controlled regime
As  $Pr$ continues to elevate, the Reynolds number decreases and the large-scale flows weaken due to the increase of fluid viscosity (Verzicco & Camussi Reference Verzicco and Camussi1999; Breuer et al. Reference Breuer, Wessling, Schmalzl and Hansen2004). Then, thermal plumes become more dominant and are responsible for most of the heat transport (Shang, Tong & Xia Reference Shang, Tong and Xia2008). Figure 8(a,b) shows typical snapshots of the instantaneous temperature and velocity fields at
 $Pr=100$ in the smooth cell and in the rough cell with
 $h=0.0417$, respectively. A corresponding video can be viewed as supplementary material. As we can see, thermal plumes are generated and erupted from thermal BLs at random positions (at random tips in rough cells). In the bulk region, they are fully developed with a well-defined spatial structure, and bring about a multicellular structure of the flow. Therefore, for high
 $Pr$, the flow is dominated by thermal plumes, which we refer to as the plume-controlled regime.
Typical snapshots of the instantaneous temperature (colour) and velocity (arrows) fields at  $Ra=10^8$ and
 $Pr=100$ in the plume-controlled regime obtained (a) in the smooth cell and (b) in the rough cell with
 $h=0.0417$ (the
 $Nu$-enhancement regime). The corresponding movie is provided in the supplementary material.

To physically understand why the critical roughness height  $h_c$ decreases with
 $Pr$ in the plume-controlled regime, we look closely into the flow structures near the lower plate, as illustrated in figure 9. At medium
 $Pr$ (figure 9a), the convective bulk is mainly controlled by large-scale flow structures, like the corner flows and the LSC, which sweep the upper and lower horizontal plates. As the separation between the adjacent rough elements is not large enough, like the situation shown in figure 9(a), the large-scale flow cannot effectively penetrate into the cavity regions. This results in the accumulation of the hot/cold fluid in the cavities and correspondingly impedes the global heat flux, as revealed by Zhang et al. (Reference Zhang, Sun, Bao and Zhou2018). At high
 $Pr$ (figure 9b), on the other hand, thermal dissipation is much slower than viscous dissipation. Thermal structures, like plumes, can thus sustain their thermal energy (i.e. keep their temperature higher/lower than the environment) for a long time. Under the effects of buoyant forces, these structures move upwards/downwards, carry and transfer most of the heat through the system. Since the rough elements can trigger the massive eruption of thermal plumes, they speed up this process. As shown in figure 9(b), the hot fluid moves upwards along the sides of rough elements and eventually forms thermal plumes and detaches from the rough tips, rather than being trapped inside the cavities. Therefore, at high Prandtl numbers, it is much easier for the roughness to produce thermal plumes and contribute to the
 $Nu$-enhancement, which leads to a small
 $h_c$ for high
 $Pr$.
Typical snapshots of the instantaneous temperature (colour) and velocity (arrows) fields near the centre of the lower plate. The data are obtained in the rough cell with  $h=0.0625$ at
 $Ra=10^8$ and at (a)
 $Pr=1$ and (b)
 $Pr=100$. The corresponding movie is provided in the supplementary material.

3.4. Transitions among the three regimes
According to the above discussions, thermal plumes play a crucial role in the transitions among the three  $h_c$–
 $Pr$ regimes. For too small
 $Pr$ (i.e. the LSC-controlled regime), thermal plumes hardly appear due to large thermal diffusivity and the heat transport is mainly dominated by molecular transport (Grossmann & Lohse Reference Grossmann and Lohse2004, Reference Grossmann and Lohse2008). For medium
 $Pr$ (i.e. the corner–LSC-competition regime), thermal plumes begin to be produced and detach from thermal BLs. After entering the bulk region, these plumes organize themselves into the large-scale flow structures (Xi, Lam & Xia Reference Xi, Lam and Xia2004), like the corner-flow rolls and the LSC. For too large
 $Pr$ (i.e. the plume-controlled regime), the large-scale flows weaken due to large fluid viscosity and most of the heat in the system is carried and transferred by thermal plumes. Taken together, there are two transitions among these three regimes; the first one corresponds to the emergence of thermal plumes, and the second one is due to the thermal plumes becoming dominant in the convective flow.
To confirm that the different regimes discussed above coincide with the transitions of  $h_c(Pr)$ identified in figure 4, we note that there are stable corner-flow rolls for medium
 $Pr$ (see figure 10b), while the corner rolls are less pronounced for too small (see figure 10a) or too large
 $Pr$ (see figure 10c). To quantitatively characterize these flow states, we calculate the angular velocity in the lower-left corners as
 \begin{equation} \varOmega=\left\langle\frac{u(x,z,t)}{z-0.1H}-\frac{w(x,z,t)}{x-0.1D}\right\rangle_{corner,t}, \end{equation}
where  $\langle \cdots \rangle _{corner,t}$ denotes an average over time and over a spatial regime
 $0<x<0.2D$ and
 $0<z<0.2H$, as indicated by the dashed squares in figure 10(a–c). Based on this definition, a large magnitude of
 $\varOmega$ corresponds to a stable corner-flow roll and thus signals the corner–LSC-competition regime, while the corner flow is weak and unstable when the magnitude of
 $\varOmega$ is small. Figure 10(d–f) shows the measured
 $\varOmega$ as a function of
 $Pr$, where
 $\varOmega$ has been compensated by
 $U_{rms}/H$ with
 $U_{rms}=\sqrt {\langle (u^2+w^2)\rangle _{V,t}}$ being a typical root mean square (subscript rms) velocity of the system and
 $\langle \cdot \rangle _{V,t}$ being a space–time average. For comparison, different background colours of figure 10(d–f) mark the three regimes identified at the corresponding
 $Ra$ in figure 4. For all three
 $Ra$ studied, the magnitude of the compensated
 $\varOmega H/U_{rms}$ is close to the value of zero in the LSC-controlled regime (the yellow-shaded area), as for small
 $Pr$ the convective flow is dominated by a single large-scale wind and the corner-flow rolls are not stable and could detach from the corners. The magnitude of
 $\varOmega H/U_{rms}$ raises rapidly in the corner–LSC-competition regime (the pink-shaded area), indicating that stable corner-flow rolls are well developed in this regime. In the plume-controlled regime (the cyan-shaded area), the value of
 $\varOmega H/U_{rms}$ drops with increasing
 $Pr$, as both the LSC and the corner-flow rolls weaken for large
 $Pr$. Therefore, the flow analysis in figure 10(d–f) quantitatively verifies that the three regimes (i.e. the LSC-controlled, corner–LSC-competition and plume-controlled regimes) indeed correspond to the transitions of
 $h_c(Pr)$ identified in figure 4.
(a–c) Typical snapshots of the instantaneous temperature (colour) and velocity (arrows) fields in the lower-left corners of the smooth convection cell at  $Ra=10^8$ and at (a)
 $Pr=0.01$ (the LSC-controlled regime), (b)
 $Pr=0.4$ (the corner–LSC-competition regime) and (c)
 $Pr=100$ (the plume-controlled regime). The dashed squares indicate the regimes where the angular velocity
 $\varOmega$ of the lower-left corners is calculated. (d–f) The compensated angular velocity,
 $\varOmega H/U_{rms}$, as a function of
 $Pr$ obtained at (d)
 $Ra=10^7$, (e)
 $Ra=10^8$ and (f)
 $Ra=10^9$. Different colours mark the three regimes identified from figure 4 and the dashed lines indicate the transitional Prandtl numbers at the corresponding
 $Ra$.

In figure 11, we present the explored control parameters and a quantitative division of phase space based on the zigzag dependence of  $h_c(Pr)$ (as shown in figure 4). Three regimes are separated by two transitional Prandtl numbers
 $Pr_{t1}$ and
 $Pr_{t2}$ (see the two dashed lines in figure 11), both of which follow a similar scaling
 $\sim Ra^{0.27\pm 0.02}$. This implies that both transitions are governed by the same mechanism. As discussed above, the plume dynamics may be the possible mechanism that determines the transitions. On the basis of this view, we are now in a position to understand the scaling that separates the three regimes. In turbulent thermal convection, thermal plumes are subject to two kinds of dissipation: one is thermal dissipation and the other is viscous dissipation. When thermal dissipation is faster, plumes much more easily lose their thermal energy and coherence, and then they either hardly appear in the convective bulk or are entrained by the large-scale flows. In this situation, the convective bulk is dominated by the large-scale flows. On the other hand, when viscous dissipation is faster, the flows much more easily lose their kinetic energy, and plumes can sustain their thermal energy (as well defined thermal structures) for a long time and hence become more prominent in the system. Therefore, the transition can be quantified by the balance between the viscous dissipation time
 $\tau _u=U^2/\varepsilon _u$ and the thermal dissipation time
 $\tau _{\theta }=\varDelta ^2/\varepsilon _{\theta }$, where
 $U$ is the typical velocity, and
 $\varepsilon _u$ and
 $\varepsilon _{\theta }$ are the viscous and thermal dissipation rates, respectively. By making use of the two exact relations of the dissipation rates
 $\varepsilon _u=\nu ^3H^{-4}NuRaPr^{-2}$ and
 $\varepsilon _{\theta }=\kappa H^{-2}\varDelta ^2Nu$ (Ahlers et al. Reference Ahlers, Grossmann and Lohse2009), and the definition of the Reynolds number
 $Re=UH/\nu$, one can obtain
 $Re^2\sim RaPr^{-1}$. According to previous results of
 $Re\sim Ra^{0.6}$ in 2-D turbulent RB convection (Sugiyama et al. Reference Sugiyama, Calzavarini, Grossmann and Lohse2009; Zhang, Zhou & Sun Reference Zhang, Zhou and Sun2017), together with our present results of
 $Re\sim Pr^{-0.88\pm 0.04}$ (as shown in figure 12), the balance between
 $\tau _u$ and
 $\tau _{\theta }$ yields
 $Pr_t\sim Ra^{0.26\pm 0.03}$, which agrees remarkably well with that of
 $Pr_{t1}, Pr_{t2}\sim Ra^{0.27\pm 0.02}$ in figure 11, within uncertainty.
Explored phase diagram of different regimes in the  $Ra$–
 $Pr$ plane. The two dashed lines mark the transitional Prandtl numbers
 $Pr_{t1}$ and
 $Pr_{t2}$ that separate the three regimes. Here,
 $Pr_{t1}$ and
 $Pr_{t2}$ are determined from the zigzag dependence of
 $h_c(Pr)$ (see figure 4) and both have a scaling of
 $\sim Ra^{-0.27\pm 0.02}$.

Log–log plot of the Reynolds number  $Re$ as a function of
 $Pr$ for
 $Ra=10^7$ (triangles),
 $Ra=10^8$ (circles) and
 $Ra=10^9$ (diamonds) obtained in the smooth cell. Here, the Reynolds number in our simulations is calculated as
 $Re=U_{rms}H/\nu$. The dashed lines are the best power-law fits to the corresponding data. The fitted scaling exponents are similar, but decrease with Rayleigh number from
 $0.9\pm 0.03$ for
 $Ra=10^7$ and
 $0.91\pm 0.03$ for
 $Ra=10^8$ to
 $0.84\pm 0.03$ for
 $Ra=10^9$.

4. Conclusion
In summary, we have made a numerical exploration of 2-D turbulent RB convection over rough conducting plates. The critical roughness height  $h_c$, denoting the onset of heat-transport enhancement owing to the wall roughness, is systematically investigated over a wide range of Prandtl number, with
 $10^7\leqslant Ra\leqslant 10^9$ and
 $0.01\leqslant Pr\leqslant 100$. Three regimes of
 $h_c(Pr)$ are identified in the phase diagram. For low
 $Pr$, the global
 $Nu$ is mainly determined by molecular transport and decreases with descending
 $Pr$, resulting in the thickening of thermal BLs. This makes thermal BLs harder to be disrupted by rough elements and leads to a large
 $h_c$ at small
 $Pr$. For medium
 $Pr$, the corner-flow rolls begin to be well developed due to the emergence of thermal plumes. The enhancement of the corner-flow strength and the increase of fluid viscosity both make
 $h_c$ increase with
 $Pr$ in this regime. For high
 $Pr$, the convective flow becomes dominated by thermal plumes. Since the rough elements can trigger massive eruptions of thermal plumes, it is much easier for the wall roughness to enhance the global
 $Nu$, leading to a small
 $h_c$ at large
 $Pr$. Our detailed analysis further reveals that the plume dynamics plays a crucial role in the transitions among the three regimes.
Supplementary movies
Supplementary movies are available at https://doi.org/10.1017/jfm.2020.1091.
Acknowledgement
We are grateful for stimulating discussions with C. Sun and D. Lohse.
Funding
This work was supported by the Natural Science Foundation of China under grant nos. 11825204, 92052201, 91852202 and 11972220, the Program of Shanghai Academic Research Leader under grant no. 19XD1421400 and Shanghai Science and Technology Program under project no. 19JC1412802.
Declaration of interests
The authors report no conflict of interest.



