1. Introduction
Rapid population ageing, mainly caused by increasing life expectancy and decreasing fertility rates, brings substantial challenges in many countries, such as labor shortage and increasing elderly population. More older people mean higher medical expenditures and higher social welfare costs associated with the elderly, which increases the financial burden on a country. The total fertility rate (TFR) of Taiwan was around 1.0–1.2 over the past 20 years (2001–2020), and the annual increment of life expectancy in Taiwan was 0.2–0.3 during the same period. As a result, the proportion of the elderly (ages 65 and over) population almost doubled over the past 20 years and is expected to reach 20% in 2025. The medical expenditure for the elderly is about five times Taiwan's national average, and thus the financial burden on the National Health Insurance (NHI) system is expected to increase with time. The prolonging of life is associated with reducing mortality rates for all ages, especially for the groups of infants and early childhood. About ¼ of newborns in Taiwan died before the age of five in the first quarter of the 20th century. On the other hand, more than 75% of newborns were expected to survive to the age of 85 in 2020. This is also true in other countries; for example, almost ¾ of American newborns were expected to survive to the age of 85 in 2019. In addition to prolonging lifespan, deaths are more likely to appear in a shorter range of ages, which is also known as “mortality compression” [Kannisto (Reference Kannisto2000), Cheung et al. (Reference Cheung, Robine, Tu and Caselli2005)]. It is generally believed that human lifespan will continue to increase, but there is no consensus on whether there is a limit to lifespan or mortality compression [Yue (Reference Yue2012)]. In terms of the age distribution at death, mortality compression implies larger means and smaller variances, and insurance companies have a lower risk in issuing life insurance products.
Morbidity compression is another conjecture related to prolonging lifespan. The hypothesis is that there is a lower incidence of chronic diseases and they would be compressed to a short period before death [Fries (Reference Fries1980, Reference Fries2000)]. However, the results of studies into morbidity compression are mixed [Mor (Reference Mor2005)]. Actually, the result that delaying the onset of morbidity is also expected to reduce the healthcare costs under Fries' conjecture [Swartz (Reference Swartz2008)], and it would lower the risk of issuing health insurance products as well. However, the morbidity compression is not supported by recent studies, if morbidity is defined as major diseases and mobility function loss [Crimmins and Beltrán-Sánchez (Reference Crimmins and Beltrán-Sánchez2011)]. If morbidity compression is not true, or conversely there is morbidity decompression, it would be difficult to evaluate the risk of health insurance products.
Cancer is among the leading causes of death worldwide, and especially in Asia. It killed around 10 million people globally in 2020, three million in China alone. In addition, it is also the leading cause of death for those aged 45 to 64 [Dieleman et al. (2016), Heron (Reference Heron2019)]. Cancer has been the leading cause of death in Taiwan since 1982, accounting for ⅓ of deaths in 2020. In Taiwan, annual medical expenditure for curing cancer under the NHI is more than 30% of annual personal income. Targeted therapy (or precision medicine) for cancer is usually not covered by the NHI and costs one to four times personal income. This creates a huge financial burden on people diagnosed with cancer. Thus, the commercial cancer insurance products have become the most popular health products, with about 40% of Taiwanese purchasing cancer policies in 2021.
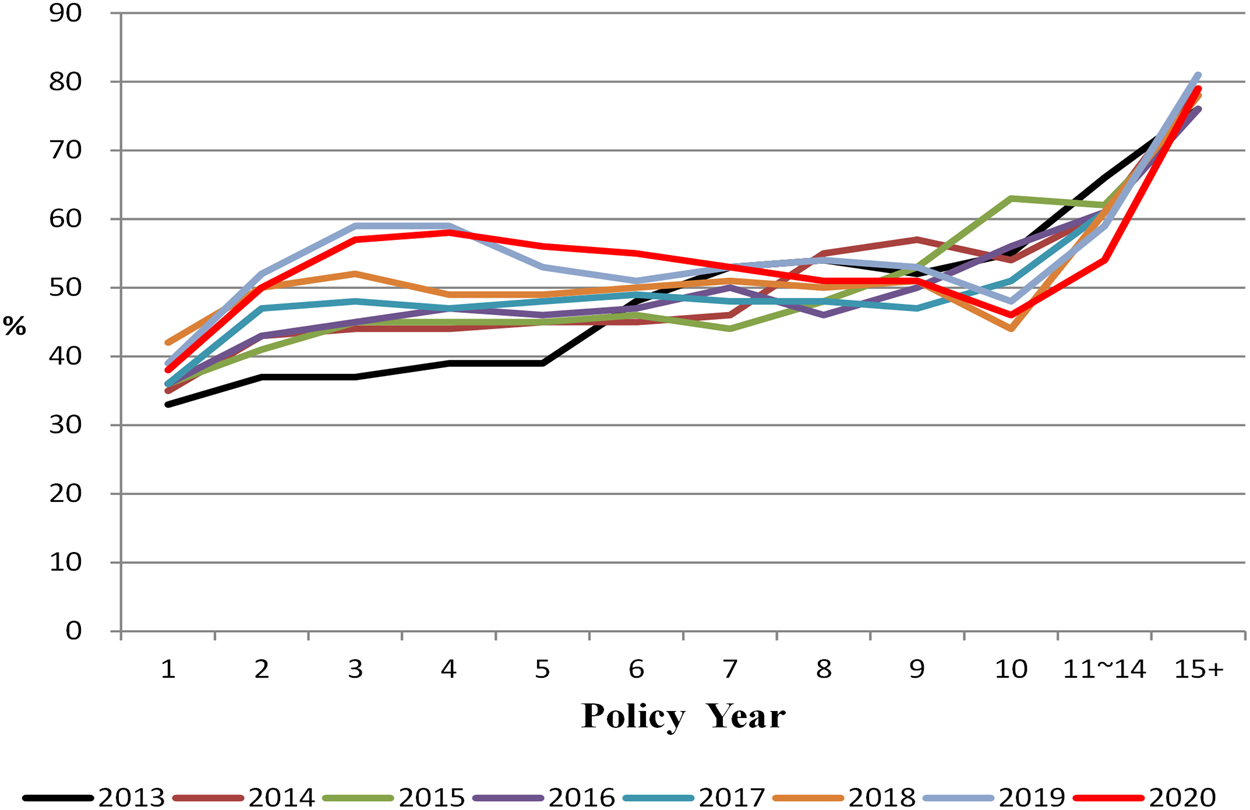
If cancer meets the conditions of morbidity compression, then the risk of selling cancer insurance would be predictable. However, this is not the case in Asia, e.g., in South Korea and Taiwan, the loss ratio of cancer insurance products is more than 150%, which becomes another type of longevity risk [Yue et al. (Reference Yue, Wang, Leong and Su2018), Su and Yue (Reference Su and Yue2022)]. Cancer insurance is not the only product facing a growing loss ratio. According to the Taiwan Insurance Institute (TII), the loss ratio of short-term health products increased from 83.14% in 2014 to 99.27% in 2020, and that of long-term health products increased with the policy year, causing the loss ratio in many insurance companies to exceed 100% after 15 years (Figure 1). These loss ratios do involve cancer-related products. Note that the longevity risk is the chance that life expectancies (or survival rates) exceed pricing assumptions, which is used originally in annuity products, and it can be applied to other insurance products, such as cancer insurance in this study.
Loss ratio of long-term health products in Taiwan.

In this study, we aim to evaluate the risk of selling cancer insurance from the perspective of morbidity compression, treating it as an extension of Yue et al. (Reference Yue, Wang, Leong and Su2018) but with a different focus. We want to know if cancer insurance is still viable and affordable in Taiwan. In particular, we intend to apply the tools of Exploratory Data Analysis (EDA) to investigate the trends of cancer incidence rates and cancer survival rates. Moreover, Taiwan's cancer insurance policies often include medical expenditure and post-surgery payments, as well as benefits to the insured when they are diagnosed with cancer. Therefore, we consider the survival rates and the corresponding medical expenditures after people are diagnosed with cancer. All these values are derived via the data from Taiwan's National Health Insurance research databases (NHIRD). If the conditions of morbidity compression fail, we would propose a modification form of cancer insurance to reduce the influence of longevity risk.
The current paper has been organized as follows: Section 2 provides a brief introduction of the methodology and data used in this study, being Taiwan's NHIRD. Section 3 shows the results of exploratory data analysis regarding cancer incidence, mortality rates, and inpatient and outpatient medical utilization of cancer patients. Section 4 explores the relationship between cancer survival and medical expenditure, and insurance products application. The final section contains discussions about the study of cancer, the applications of cancer insurance products, and suggestions.
2. Data and methodology
2.1 Data
Taiwan launched a single-payer National Health Insurance program on March 1, 1995. As of the end of 2021, about 99.96% of Taiwan's population were enrolled, with approximately 23.86 million individuals in this registry. The Bureau of National Health Insurance (BNHI) has been collecting data from the NHI program, including the insured registration and claim data for reimbursement. These data are de-identified by scrambling individuals' personal identification numbers and sent to the National Health Research Institutes to form the NHIRD. This database has been used by many researchers to explore the health and medical utilization of Taiwanese people and help Taiwan's government to improve the NHI service [Lee et al. (Reference Lee, Huang, Tsai, Huang, Kuo, McKee and Nolte2010), Hsing and Ioannidis (Reference Hsing and Ioannidis2015)].
Note that Taiwan government releases official cancer statistics annually, including number of cancer incidences/deaths by age and sex, standardized cancer incidence/death rate (number of occurrences/deaths per 100,000 people). However, we cannot use these results to calculate the premium for cancer incidence benefit and cancer death benefit. We need the cancer incidence rates for those without cancer and the death rates of cancer patients. We can obtain the cancer related incidence and death rates from the NHIRD, and use them to design cancer insurance products. Official cancer figures are only used to check our results.
In this study, we used the NHIRD to explore cancer incidence as well as the medical expenditure and survival of cancer patients. The data used include the 1993–2013 registry for catastrophic illness patients (HV), 2003–2013 inpatient expenditures by admissions (HV_DD), and 2003–2013 care expenditures by visits (HV_CD). The files of HV_CD and HV_DD contain outpatient and inpatient medical records of the patients with HV, respectively. Catastrophic illness, or HV, is severe illness requiring long-term hospitalization and significant medical expenses. There are 30 categories of HV recorded in the NHIRD, and cancer, cardiovascular disease and chronic renal failure are among the more well-known. In 2020, about 4% of Taiwan's population are HV patients and approximately half of them are diagnosed with cancer.
We should define the terms used in this study, including two types of mortality standardization for exploring whether cancer-related values change with time. Let the cancer incidence rate of ages between x–2 and x + 2 be denoted by 5Ix –2/5Px –2, where 5Ix –2 is the number of people diagnosed with cancer (who were not cancer patients previously), and 5Px –2 is the mid-year population estimates (or exposures) of Taiwan's population not diagnosed with cancer at the beginning of the year for ages 0–4, 5–9, …, 95–99. The mortality rate of cancer patients can be defined similarly as the ratio between the number of deaths of cancer patients and the number of cancer patients for ages 0–4, 5–9, …, 95–99. The survival rate is the percentage of people who survive after being diagnosed with cancer.
2.2 Methodology
Note that this study emphasizes on applying EDA methods to verify if the cancer-related values increase/decrease with time. The EDA is aimed at applying visualization tools to summarize the main characteristics of data [Tukey (Reference Tukey1977)]. This is different from Yue et al. (Reference Yue, Wang, Leong and Su2018), although both studies apply the Lee-Carter model. In particular, we propose using the standardized mortality ratio (SMR) to visually inspect the change over time, with the aggregate of all data as the standard population. There are two methods of mortality standardization: direct and indirect. The reason behind mortality standardization is the need to use a single index to measure the mortality level of a place without the influence of age structure. The SMR is the most popular indirect method, often used in epidemiology, and it is defined as follows:

where Dj is the observed number of deaths for population j, $P_x^j$ is the population size of age x for population j, and $m_x^s$
 is the central mortality rate of age x for standard population.
The possible range of SMRj is (0,∞) and if SMRj is equal to 1, it means that the overall mortality rates of population j are about the same as those of the standard population. Likewise, if SMRj is smaller/larger than 1, then this implies that the overall mortality rates of population j are lower/higher than those of the standard population. Note that the SMR can also be used to explore trends in populations. For example, let the standard population be the aggregate of all data from a certain population, and SMRj be the SMR of this population at year j to the aggregate population. If the mortality rates of this population decrease with time, then SMRj decreases with time as well, and vice versa.
Standardized death rate (SDR) is a frequently used direct method, defined as

where Ps is the population size for standard population, $P_x^s$ is the population size of age x for standard population, and $m_x^j$
 is the central mortality rate of age x for population j. The SDR is usually presented as the number of deaths per 100,000 people, which can give us a rough idea about the mortality level. In fact, we can use either SDR or SMR to judge if the mortality rates increase/decrease with time. However, the SMR can provide more information and we can use the scale of SMR to estimate the mortality change, which will be shown later. Note that the SDR and SMR can be applied to incidence rates and other values, in addition to mortality rates. Also, the SDR is to indicate the overall mortality and thus the same standard population, e.g., 2000 WHO standard [Ahmad et al. (Reference Ahmad, Pinto, Lopez, Murray, Lozano and Inoue2001)], is used. On the other hand, the SMR is to show the mortality trend and the standard population is usually the aggregate of target population under inspection.
In addition to the SMR and SDR, we also consider the Lee-Carter model [Lee and Carter (Reference Lee and Carter1992)] to estimate the trend of cancer-related values. The Lee-Carter model assumes that

where m xt is the central mortality rate for age x and time t and $\varepsilon _{xt}$ is the error term. Also, α x and β x are age-related parameters and κ t is time-related parameter. We use maximum likelihood estimation to obtain parameters' estimates of the Lee-Carter model [Brouhns et al. (Reference Brouhns, Denuit and Vermunt2002)]. Adopting the idea of Yue and Huang (Reference Yue and Huang2011), we can treat bβ x as a measure of the annual change rate of mortality rates for age x, where κ t = a + bt.
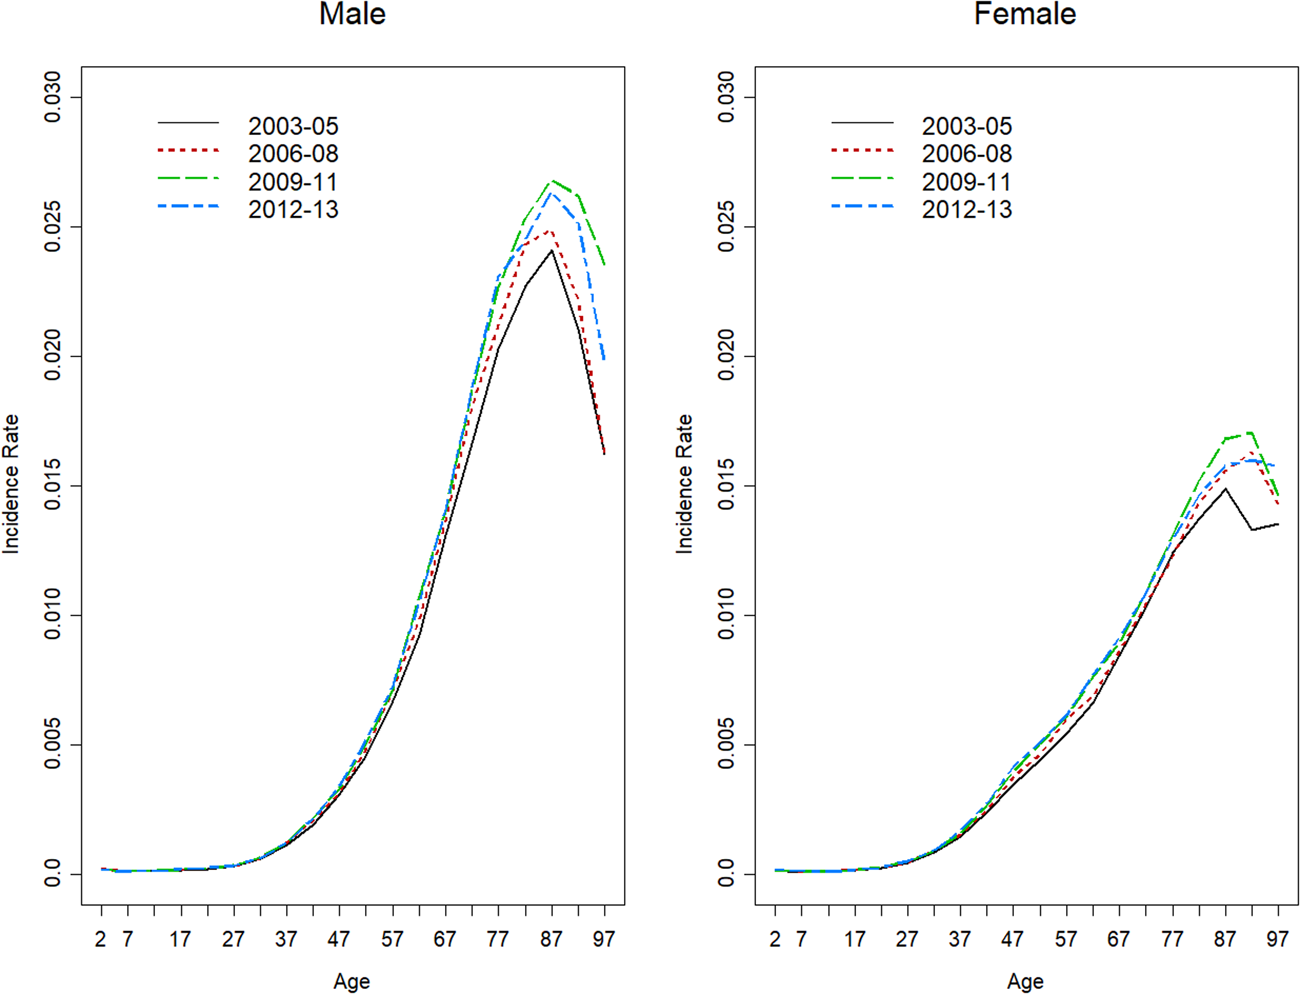
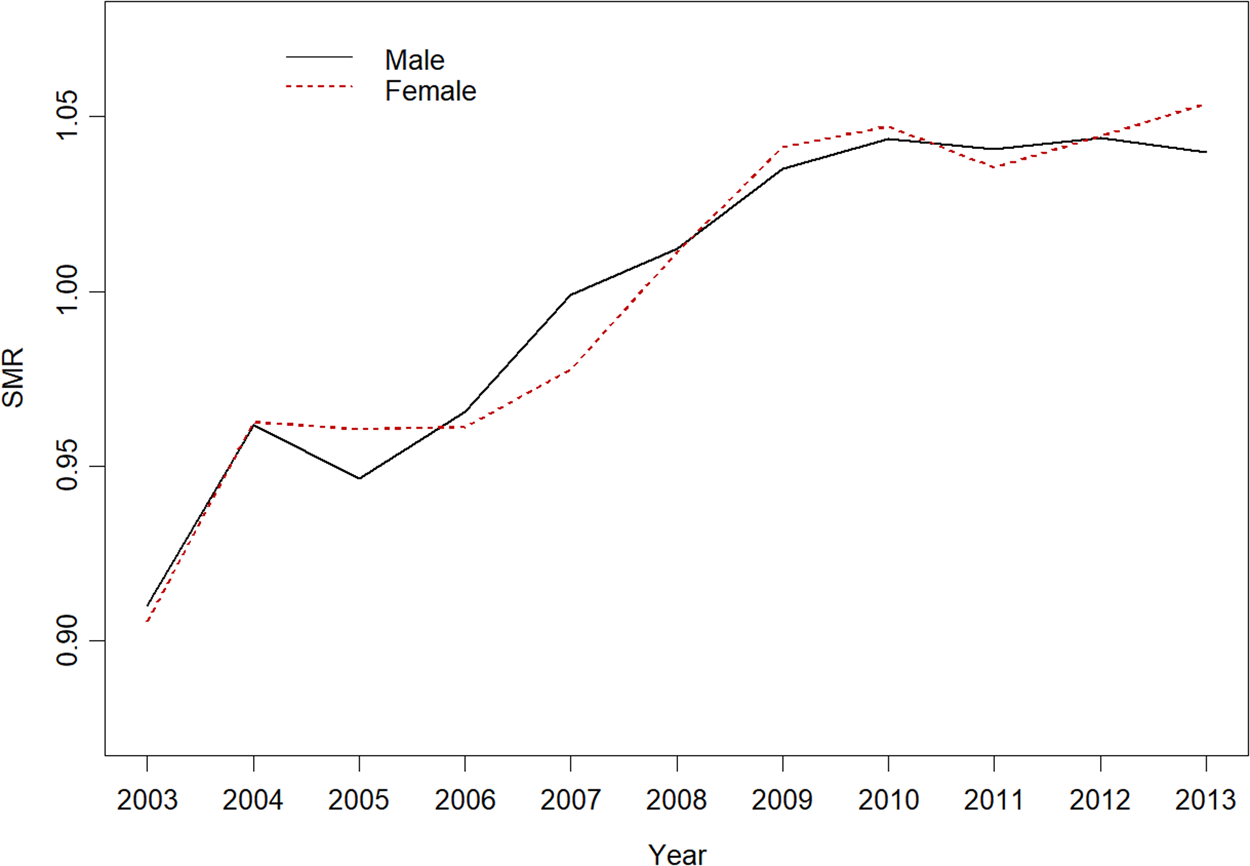
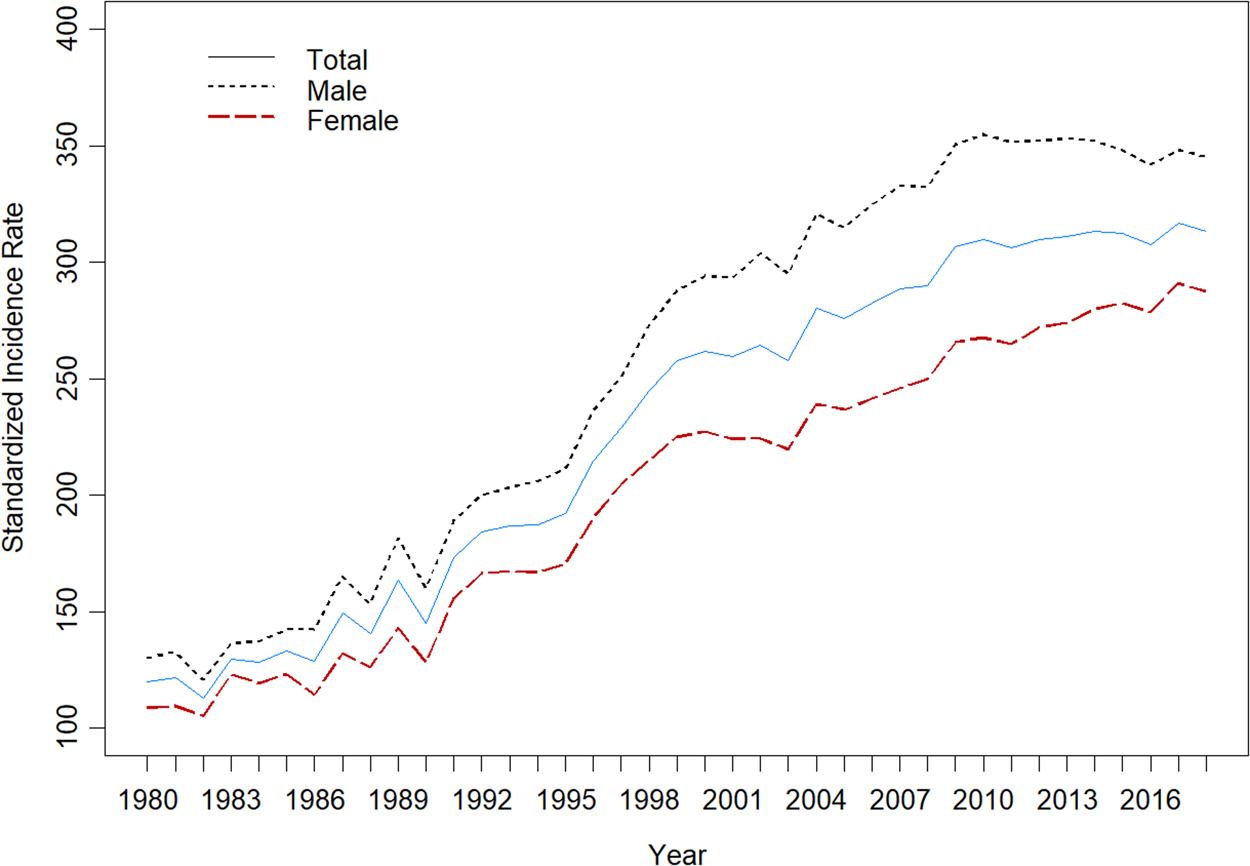
We use two examples to demonstrate how we apply the preceding methods. First, we show the case of cancer incidence rates, with three-year average cancer incidence rates in Figure 2. The male cancer incidence rates are higher for all age groups, and the increase seems to gradually slow down over time. The slight increase in cancer incidence (annual increment of about 1.3%) can also be seen from the SMR (Figure 3). Of course, the SDR can also show that the annual increment of cancer incidence rates is slowing down (Figure 4), but it is not that obvious (Data Source: Ministry of Health and Welfare). Thus, we only use the SMR for the rest of this study. Note that the increasing cancer incidence indicates that there is a potential longevity risk for cancer insurance. Please not that Figures 3 and 4 have different ranges in the x axes since the SMR and SDR are from different data sources. Note that the age-specific values in this study are shown in the format of five-year age group and the age labels in the x-axis of Figure 2 are the mid-year of each group.
Age-specific cancer incidence rates.

Trend of cancer incidence rates (SMR).

Trend of cancer incidence rates (SDR).

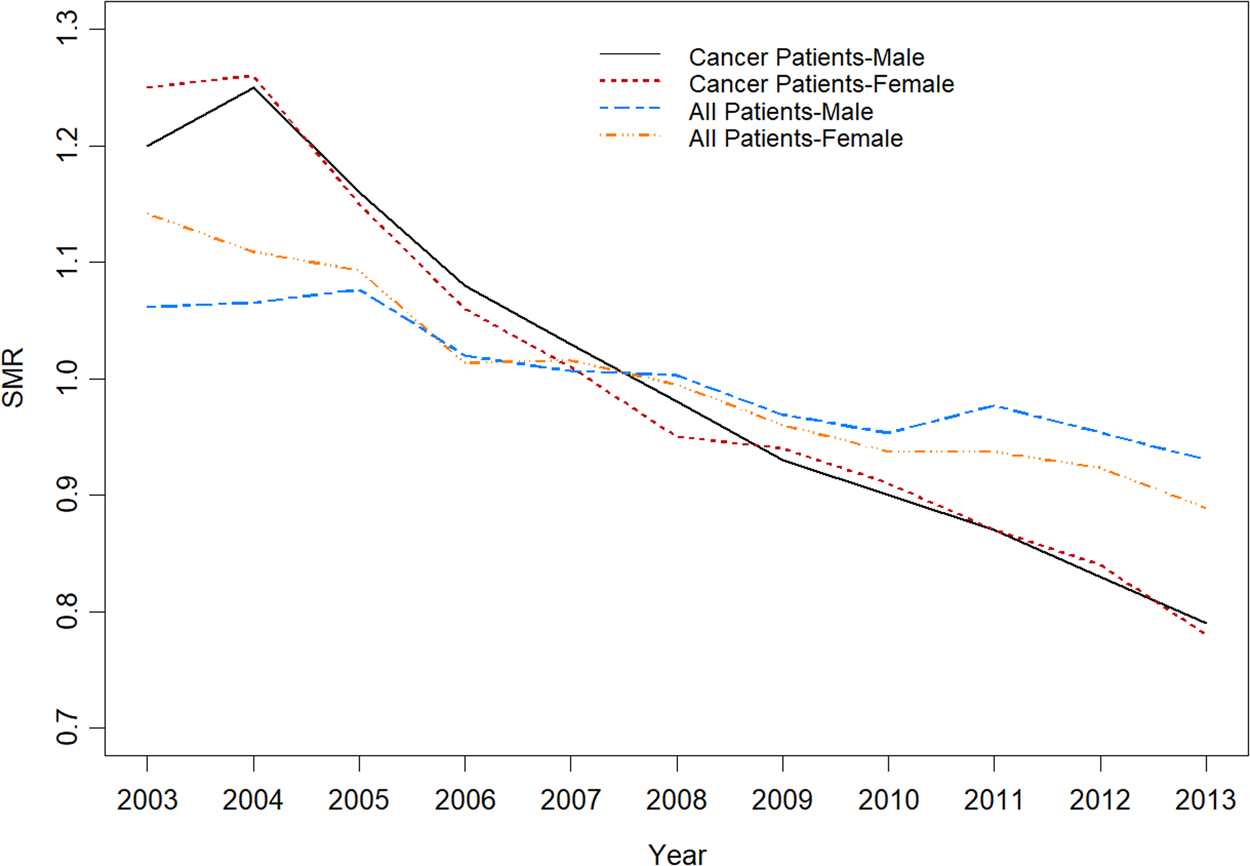
The mortality rates of cancer patients could not be derived from the NHIRD, since the death records were not available when we purchased the data. Still, we can use medical records to judge if individuals are alive with the criteria used in the previous studies [Yue et al. (2018 2019)]. It is shown that the death criteria can provide fairly accurate estimates of mortality rates (Table 1), especially for catastrophic illness patients. The mortality rates of cancer patients are shown in Figure 5, which apparently decrease with time and increase with age, similar to those in Siegel et al. (Reference Siegel, Miller, Fuchs and Jemal2021) and Islami et al. (Reference Islami, Ward, Sung, Cronin, Tangka, Sherman, Zhao and Robert2021). In addition, we found the SMR of cancer patients reduced by 4% annually, twice that for all-causes (Figure 6). As a comparison, we applied the Lee-Carter model and used the estimated values of bβ x, to represent the future rates of β x and κ t, for the mortality rates of cancer patients. In general, the cancer mortality rates also decreased about 4% annually and the younger population (e.g., before the age of 25) has better mortality improvement.
Death criteria for cancer patients

Cancer patients' mortality rates (NHIRD).

SMR of mortality rate for various groups.

2.2.1 Cancer survival analysis and medical expenditure
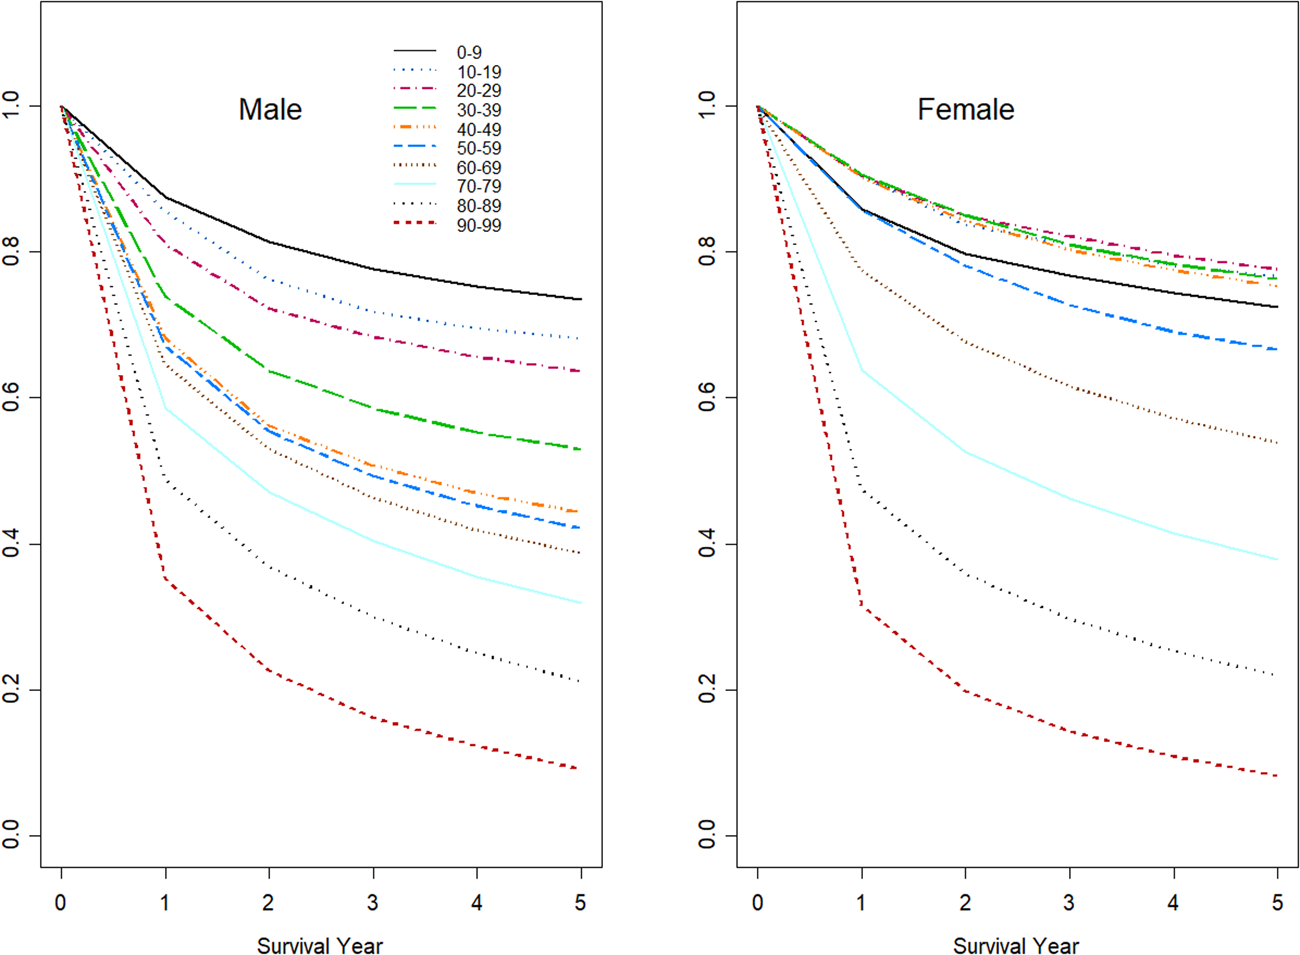
As mentioned in the introduction, Taiwan's cancer insurance policies usually include the medical expenditure and post-surgery pension. Thus, in this section we will explore the survival rates from all causes of death after the insured are diagnosed with cancer. We use the five-year survival rates as an example (Figure 7). The five-year survival rates decrease with age, and they are higher for females. It is relatively higher (about 80%) for females before the age of 50, but declines rapidly after the age of 50. Again, we can apply the concept of SMR to cancer survival in order explore the improvement of cancer survival.
Five-year survival rate (10-year age group).

We use the term Standardized Survival Ratio (SSR) to measure the trend of k-year survival rateFootnote 1 of cancer patients (k = 1, 2, 3, 4, 5),

where$\;P_x^t$ is the number of patients diagnosed with cancer at age x for year t, $S_x^k$
 is the k-year survival rate of patients diagnosed with cancer at age x for year t, $L_t^k \;$
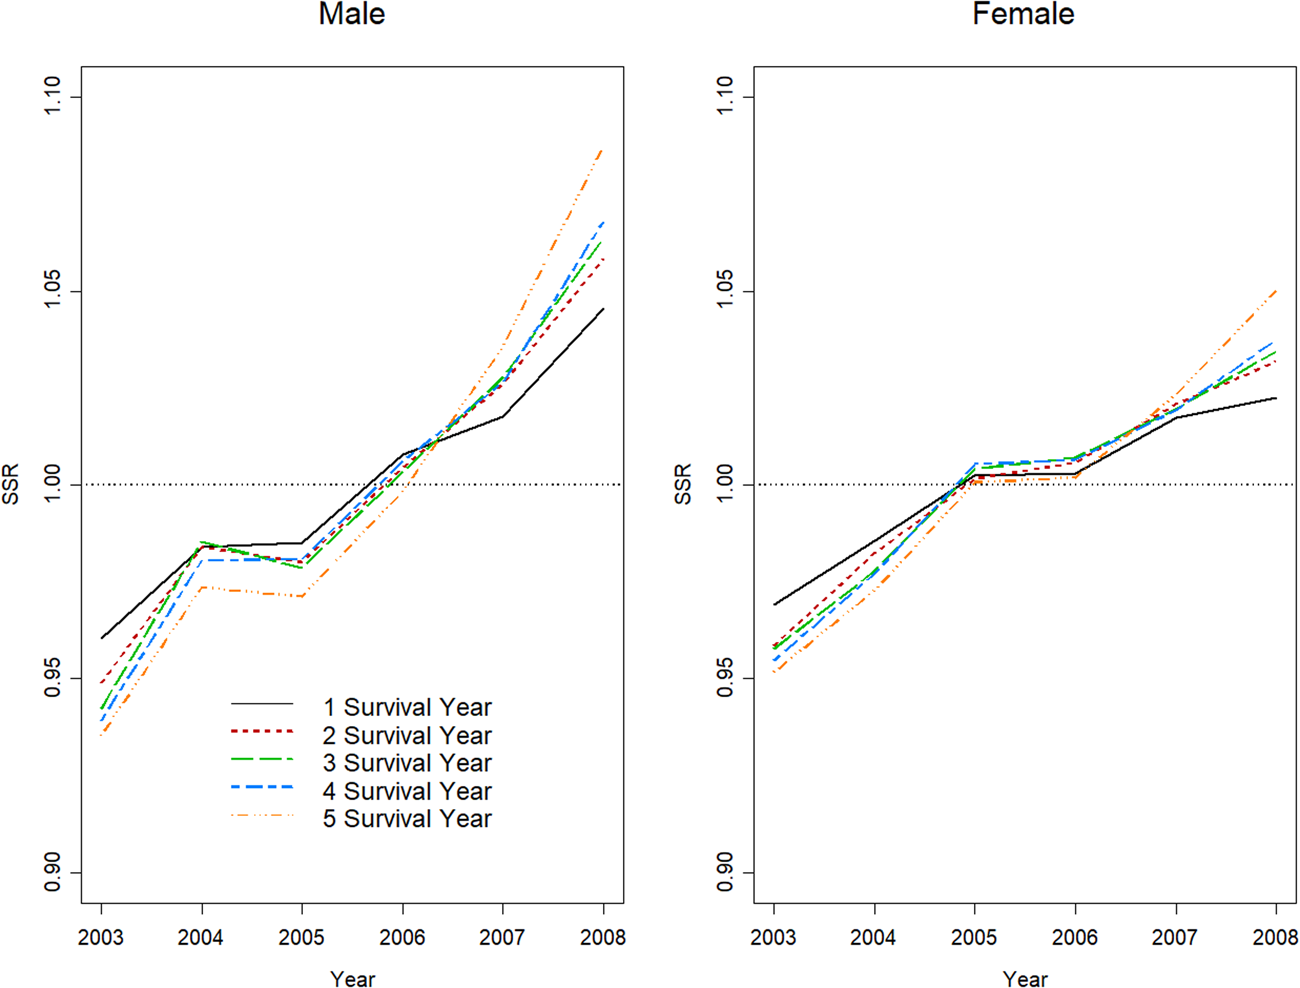
 is the number of k-year survivors for all patients diagnosed with cancer for year t, and t = 2003, …, 2008. Similar to SMR, if the cancer survival rate increases with time, then the SSR increases with time and this is the case (Figure 8). The annual increment of male survival rates was larger, which was 8.5% for the first year and 15.2% for the fifth year, compared to 5.4% and 9.8% for the female, respectively. The improvement of fifth-year survival rates is almost twice that of the first year (Figure 8).
Five-year survival rate (SSR).

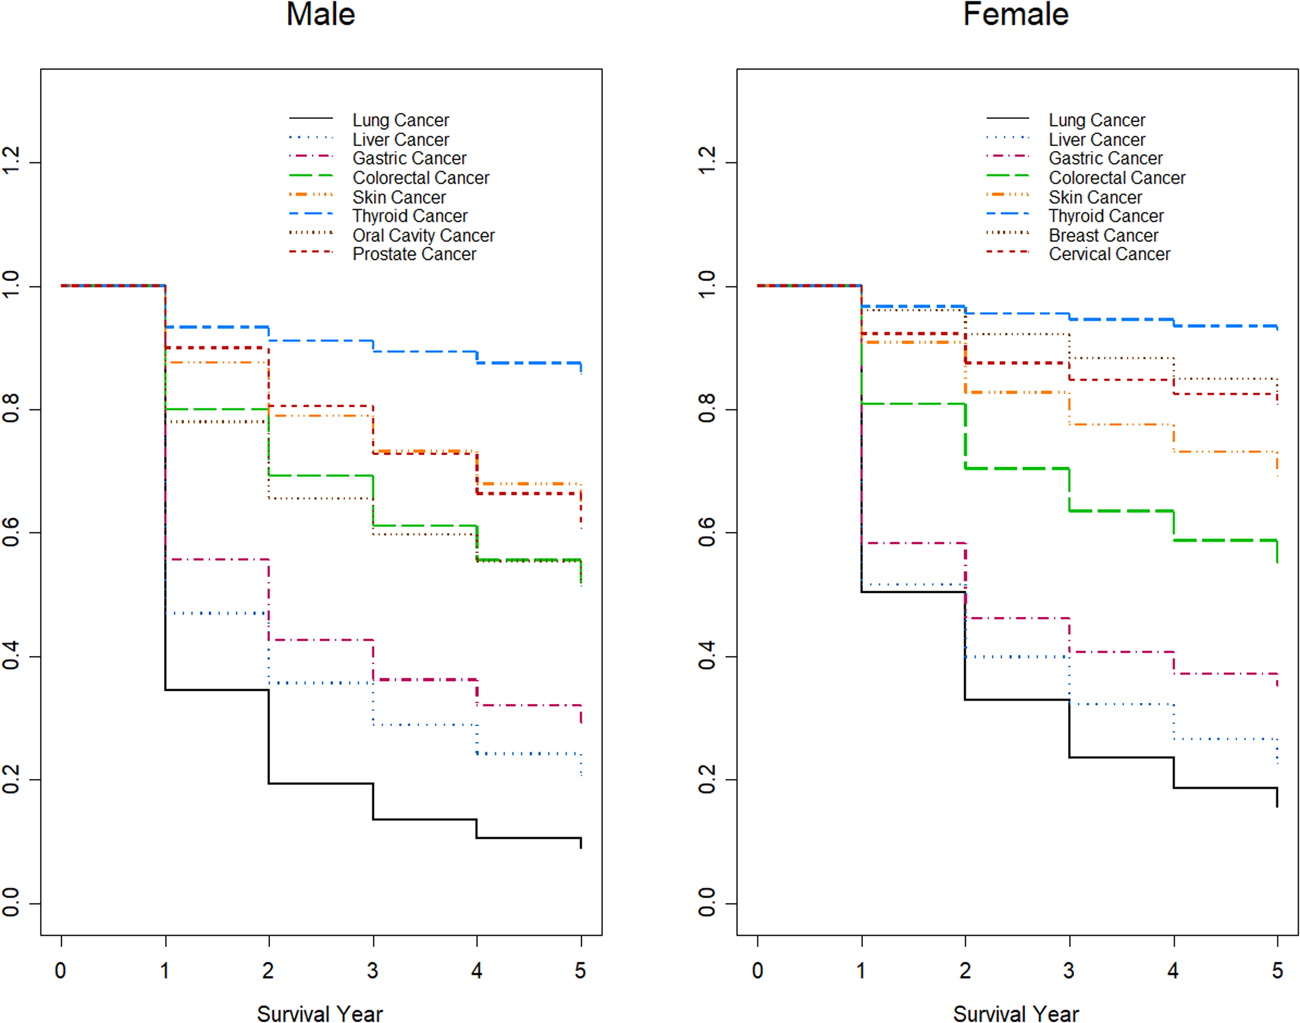
The five-year survival rates for females were more than 80% for the breast and cervical cancer, much larger than those of other cancers, due to the government's active promotion of female cancer screening in recent years. Taiwan's government also promotes male cancer screening, emphasizing colorectal and oral cancer, and the survival rates for these cancers (about 60%) were also higher than those for lung and liver cancer. However, the five-year survival rates of male cancer patients were lower than those of females for same types of cancer (Figure 9). It is believed that men pay less attention to their health and thus the Taiwan government should provide incentives for men to improve their health.
Survival rates of ten types of cancer.

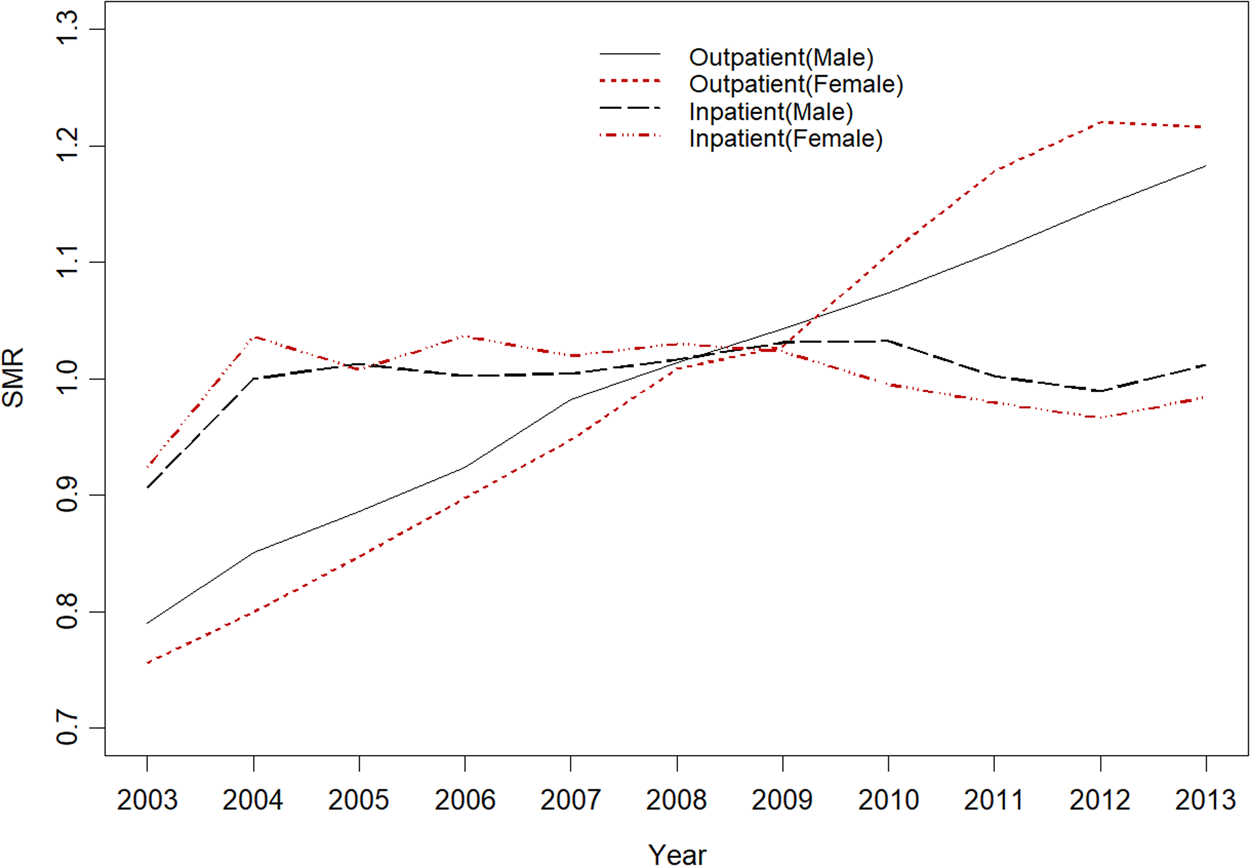
We continue to explore the medical utilization of cancer patients. The SMR of inpatient and outpatient medical utilization of cancer patients are shown in Figure 10, and it seems that the annual increment rates of outpatient expenditure are 3.9% and 4.6% for men and women, respectively. On the other hand, the outpatient expenditures of both genders are not so obvious. The inpatient and outpatient medical expenditures for cancer are about the same, which means that the growing medical expenses mainly come from outpatient visits. Also, the growth rate of total medical expenditure of cancer patients is half the growth rate for outpatient expenditure, which was around 2%. In summary, cancer incidence rates and cancer survival rates are both increasing and thus length of life with cancer has increased in Taiwan. In other words, if judging from cancer, morbidity compression is not true and providing cancer insurance would be risky for insurers. Moreover, the medical costs of cancer are also rising, making cancer insurance premiums even more expensive.
Average cancer medical expenditure of cancer patients (SMR).

3. Designing cancer insurance products
As we can see from the last section, morbidity compression does not hold in the case of cancer and the length of life with cancer increased in Taiwan. This can be treated as evidence to explain the fact that the loss ratio of cancer insurance is more than 150% and will increase with time. We think that it would be too risky to insurers to issue whole-life and long-term cancer products in Taiwan. It would also be too expensive for the insured to purchase these products. In fact, major cancer treatments, such as surgery, chemotherapy, and radiation therapy, usually occur in the first few years after patients are diagnosed with cancer. Most cancer related-medical expenditures also occur at the same time. Thus, we propose modifying the coverage of cancer insurance and restricting medical expenses to only the first five years, for example, after patients are diagnosed with cancer.
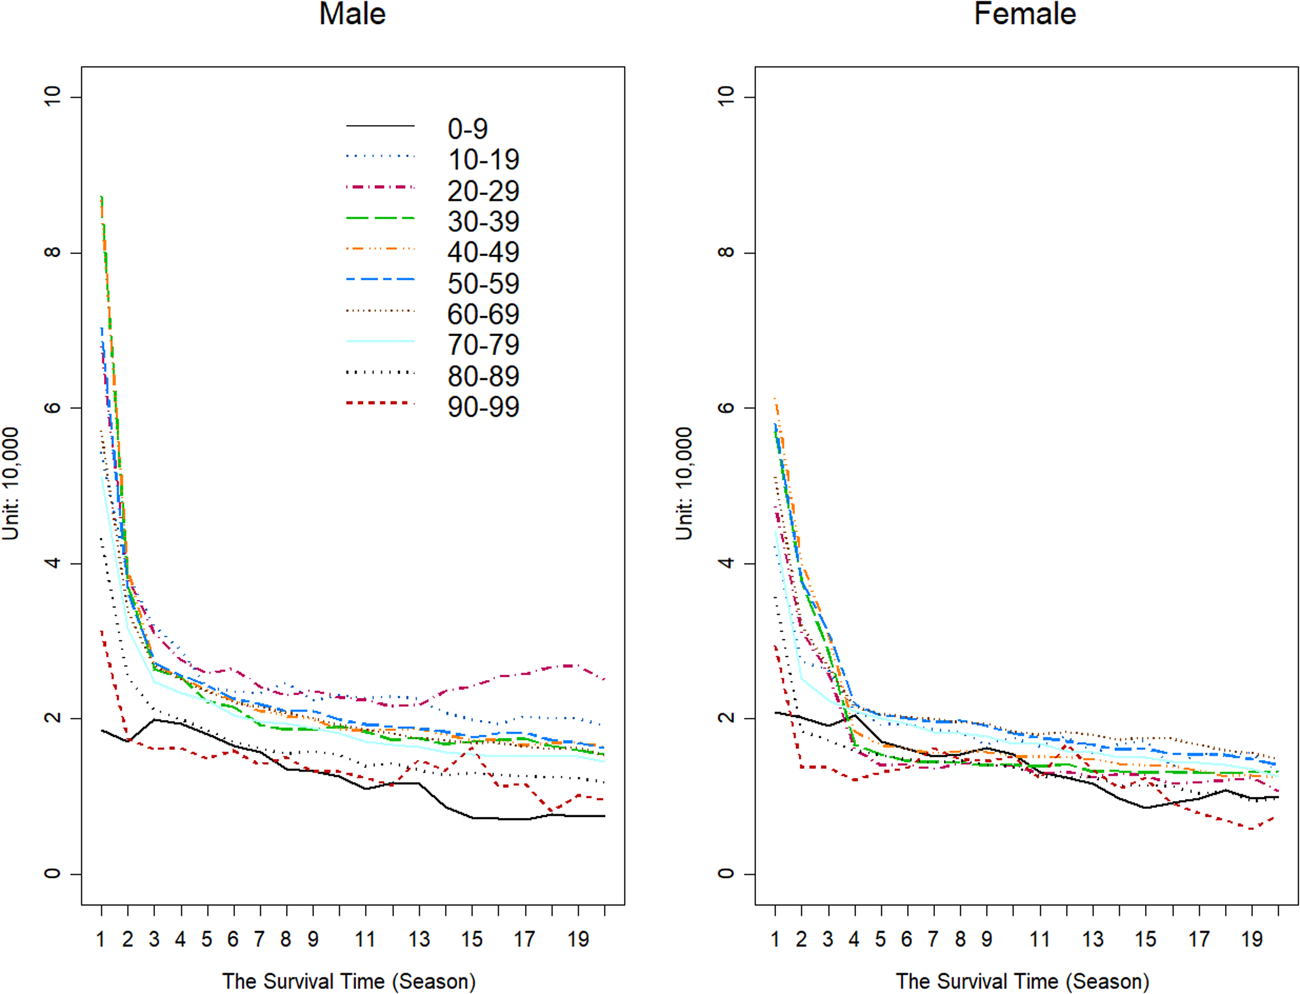
Therefore, we will first use the data from NHIRD to explore the medical expenditures of cancer patients according to years after diagnosis. Figure 11 shows the medical expenditures of outpatient visits for the first 20 seasons (or five years) after being diagnosed with cancer. Note that this gives us a better picture of the trend in medical cost by season. Outpatient expenditure reaches its peak in the first season, decreases rapidly after the first year, and levels off after the fourth year. This pattern holds for all age groups, and male outpatient expenditures are higher for all ages as well. The outpatient expenditures are the lowest for the senior age group and people aged over 85 years have the lowest relative survival, which is consistent with the results of a previous study [DeSantis et al. (Reference DeSantis, Miller, Dale, Mohile, Cohen, Leach, Sauer, Jemal and Siegel2019)].
Outpatient expenditure of cancer patient.

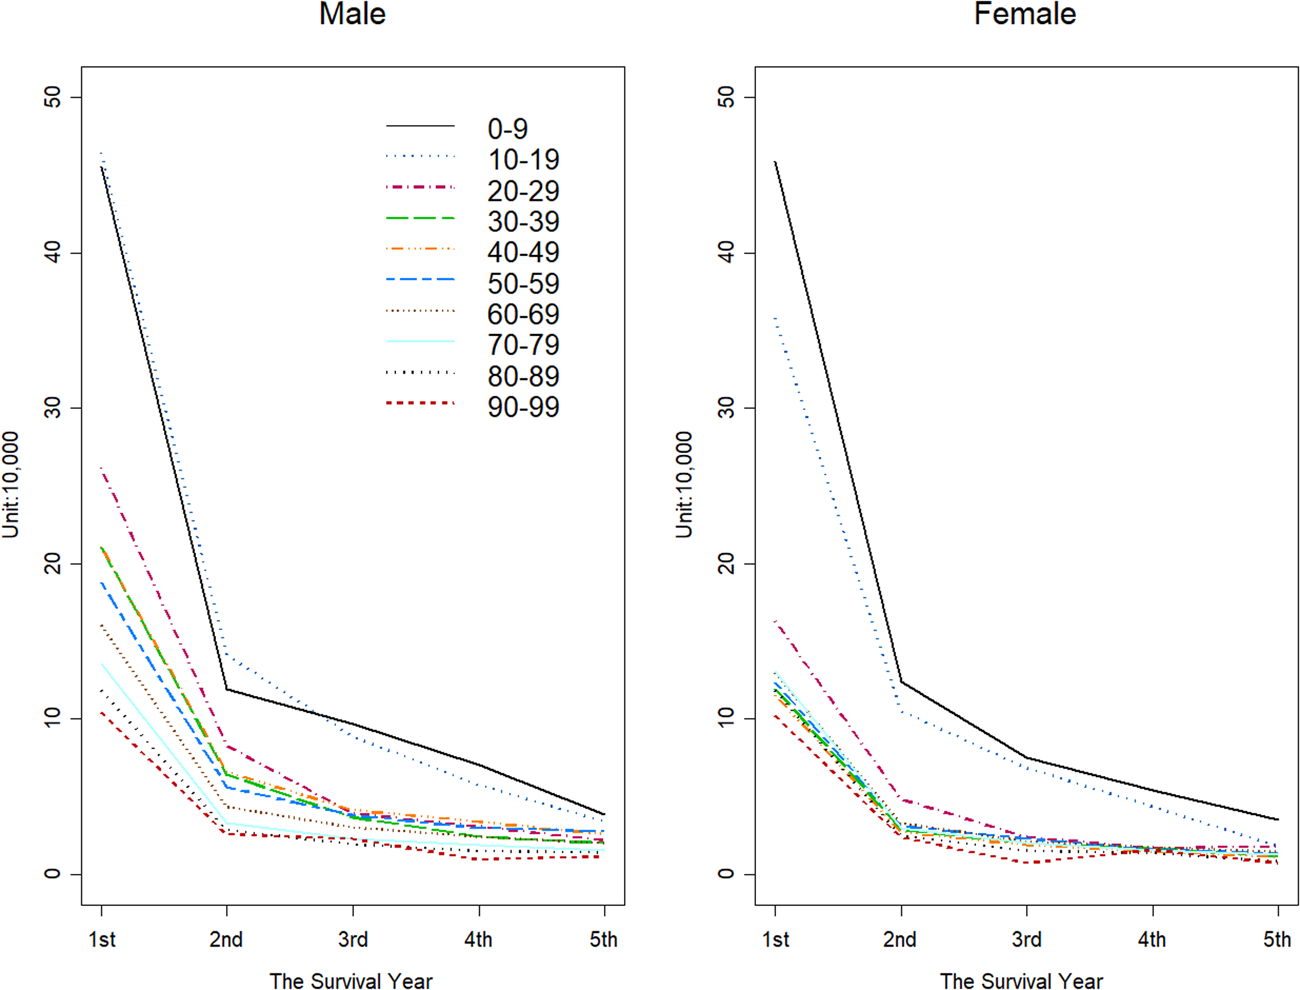
The medical expenditures of inpatient stays are shown in Figure 12. Similar to those of inpatient visits, inpatient expenditures decrease with time and are higher for males in all age groups, although the decrement in time is slower. It seems that medical needs (with respect to inpatient and outpatient expenditures) of cancer patients are concentrated in the first one or two years after they are diagnosed with cancer, and the coverage of cancer treatments at this time interval would be crucial and necessary. To be conservative, this time interval can be extended to, for example, five years. Note that if the cancer insurance only covers the first five years after the insured are diagnosed with cancer for the first time, then the insured can have at most five years of medical expenditure. This would greatly reduce the uncertainty over the number of years they could expect to receive cancer benefits and also reduce the financial risk of cancer insurance.
Inpatient expenditure of cancer patient.

The medical cost in the first five years is about 80% of all expenditures, and this means that medical care is most needed in the first five years after the patients are diagnosed with cancer. We think that, if the benefit is restricted to the first five years after diagnosis, then the insured can pay less in premiums and use the first five years of insurance benefits as a buffer for future life arrangements. Also, limiting medical expenditure to the first five years can reduce the financial risk of the insurers, since the insurers would not be bearing all the expenses of cancer patients in their lifetimes. Hence, we are of the view that limiting the period of cancer medical expenditure coverage is a preferred choice for both the insurers and the insured. However, we do not have enough years of data to acquire a reliable estimate for the medical expenditures for the first five years after cancer. As an alternative, we propose another version of a cancer product, which is to consider term insurance instead of whole life insurance. Also, in order to simplify the discussion, this insurance product only covers benefits for those suffering from cancer, paid in a lump-sum. We should use data from NHIRD to evaluate if this design is feasible in Taiwan.
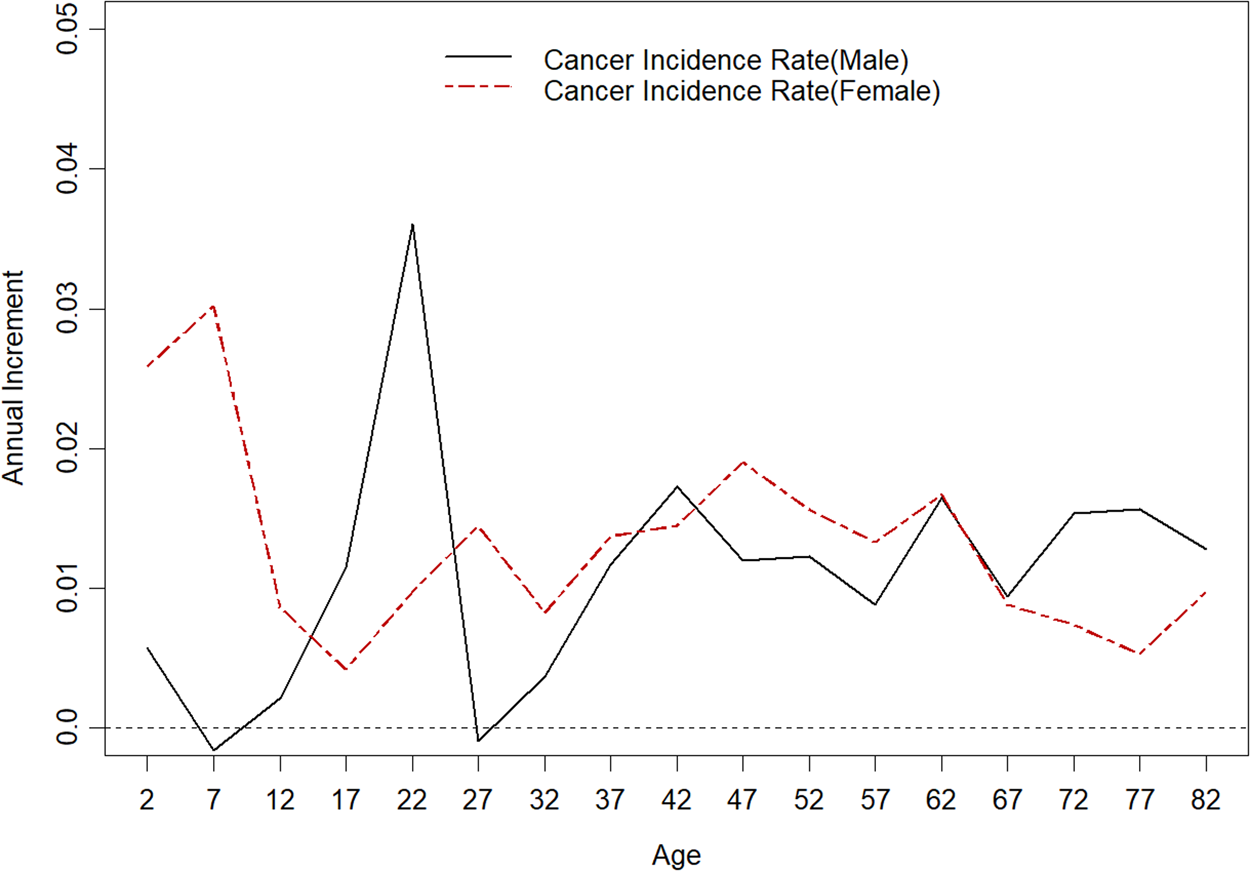
To simplify the discussion, we consider only one type of insurance benefit: a fixed amount benefit when the insured is diagnosed with cancer for the first time. This benefit can also include the first five-year medical expense after the insured is diagnosed with cancer in the form of a one-time payment. Note that mortality rates are decreasing while cancer incidence rates are increasing. Therefore, we will apply the Lee-Carter model to obtain the future values and calculate the premium of term cancer insurance. The data on mortality and incidence rates are in the format of five-year age groups, with the data period from 2003–2013. Similar to Yue and Huang (Reference Yue and Huang2011), we can treat bβ x as the annual change rate of mortality/cancer incidence rates for age x, where κ t = a + bt is the time-related parameter. We compare the annual reduction of mortality rates for Taiwan's population, people purchasing commercial insurance, and cancer patients, which are marked as national, experienced, and cancer patients in Figure 13. The annual reduction is calculated under the Lee-Carter model. If the Lee-Carter model is true, then the mortality rate of age x drops by $( 1\ndash {\rm e}^{b\beta _x}) \% \;$ annually. All three groups have negative increments, i.e., decreasing mortality rates, and the mortality rates of cancer patients have the largest reduction. Similarly, we can use the Lee-Carter model to estimate the annul increments of cancer incidence rates for all ages (Figure 14). On average, cancer incidence increases 1% annually, while the annual decrement of mortality rates is larger than 2%.
Annual reduction of mortality rates (Lee-Carter Model).

Annual increment of cancer incidence rates (Lee-Carter Model).

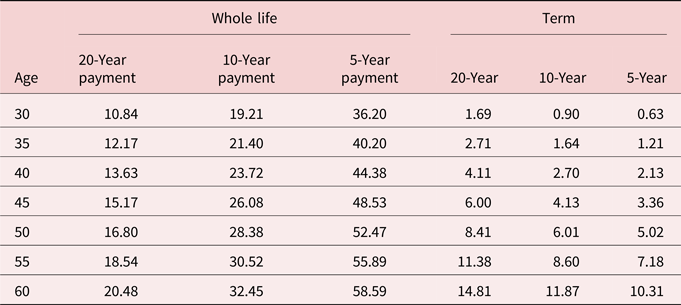
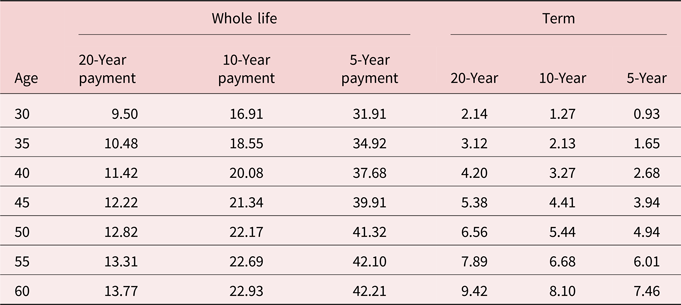
Next, we use the values acquired by the Lee-Carter model to compare the premiums of term and whole life cancer insurance. Three different settings of premium are assumed: five-year, 10-year and 20-year payment, and the interest rate is 2.25%. We treat the average of values from 2011–2013 as the baseline. Tables 2 and 3 are the premiums of term and whole life cancer insurance for males and females, respectively. As expected, the premiums of five-year term cancer insurance are the lowest among all insurance products, and limiting the benefit to the first five years after the insured's diagnosis with cancer can significantly reduce the insurance premium. Note that the premiums of term insurance are much smaller for all ages, since the mortality rates and cancer incidence rates increase with age. The differences are especially obvious for males and younger people. In other words, cancer insurance would be more affordable to consumers (and less risky to insurers) in the form of term insurance.
Male: insured amount: NT$1,000 assumed interest Rate: 2.25%

Female: insured amount: NT$1,000 assumed interest Rate: 2.25%

4. Conclusion and discussions
Lengthening lifespans have changed how we arrange our lives as we age. The illnesses older people suffer from today are quite different from those of our ancestors, and cancer is one of them. Cancer is among the leading causes of death worldwide, and researchers consider cancer to have become an obstacle for increasing life expectancy [Sung et al. (Reference Sung, Ferlay, Siegel, Laversanne, Soerjomataram, Jemal and Bray2021)]. In Taiwan, cancer insurance is a popular tool for people to deal with the threat of cancer. However, the loss ratio of cancer insurance is increasing, and more insurers are skeptical about issuing cancer insurance products. In this study, we introduce the concept of morbidity compression to evaluate the feasibility of cancer insurance. We think that the length of life with cancer is expected to increase in Taiwan since cancer survival is improving and morbidity compression may not be true in terms of cancer. In other words, the cost of cancer insurance is expected to increase if medical expenditure and post-surgery benefits for cancer patients are included.
In response to the rising cancer insurance costs, we propose two modifications of product design. The first is to limit the benefit to the first five years after a cancer diagnosis, which is like the truncated mean, avoids the risk of long-tail probability. We suggest that cancer insurance cover medical expenses for only the first five years after the insured is diagnosed with cancer to significantly reduce the financial risk of the insurers. Also, the medical cost of the first five years after a cancer diagnosis accounts for 80% of total cancer cost, and this design can cover most of the medical needs of cancer patients without the requirement of paying excessive premiums. However, there is not enough data, and we need to accumulate more data to apply stochastic models to evaluate the effect of restricting the time of insurance benefits.
Term insurance is another proposed modification of cancer insurance. Term cancer insurance can reduce the financial burden on the insured for the next few years after a diagnosis, but will create a heavier burden on them if the cancer insurance is still effective at older ages. Also, most of Taiwan's insurers set a maximum age (usually age 70 or 75) for purchasing life and health insurance products, which means that older people will not be covered by any cancer insurance if only term insurance products are available in the market.
In addition to our proposed modifications, there are other possibilities for dealing with the increasing cost of cancer insurance, and for this, we can refer to the experience with longevity risk. For example, natural hedging strategies and longevity swaps are two popular choices for managing longevity risk [Cox and Lin (Reference Cox and Lin2007), Wong et al. (Reference Wong, Sherris and Stevens2015)], but these solutions might not be applicable. Natural hedging uses decreasing death benefits to offset increasing annuity benefits, and similarly, we can use death benefits to offset cancer benefits [Su and Yue (Reference Su and Yue2022)]. However, the required benefits of life insurance are often very large in order to offset the annuity (and cancer benefits), which would be not practically feasible.
Besides using morbidity compression to evaluate cancer insurance, we suggest readers apply the SMR to explore trends in mortality rates (or incidence rates, survival rates, and medical cost), before plugging in the Lee-Carter model. In other words, this procedure of considering the SMR first and then the Lee-Carter model is strongly recommended. We expect that the results of the SMR should be consistent with those of the Lee-Carter model. The SMR is served as a possible EDA tools and applying the Lee-Carter model is one possible choice of Confirmatory Data Analysis (CDA). The results of EDA and CDA should be consistent. If they are inconsistent, then there may be problems in the process of data analysis.
Acknowledgements
The authors are grateful for the insightful comments from anonymous reviewers.
Financial support
This research was supported in part by a grant from the National Science and Technology Council in Taiwan, MOST 109-2410-H-156-002-MY2.