I. INTRODUCTION
Among all the functional materials synthesized at the nanometer scale, metal oxides are the main attractive candidates from a scientific and technological point of view. Metal oxide nanoparticles have a unique structure, high surface area, interesting and unusual redox and catalytic properties, good mechanical stability, and good biocompatibility. As a result, these materials have become important components in the field of biomedical therapeutics, bioimaging, and biosensing.Reference Matijevi1 The bactericidal effectiveness of metal oxide nanoparticles has been proposed to be due to their distinct properties. Such characteristics should allow them to interact closely with bacterial membranes rather than the effect being solely due to the release of metal ions. The mechanism by which nanomaterials may alter biological systems is dependent on their size, shape, composition, and surface properties.Reference Morones, Elechiguerra, Camacho, Holt, Kouri, RamÃrez and Yacaman2 Copper oxide (CuO) is a transition metal oxide with a p-type semiconducting material and has monoclinic crystal structure with many practical applications, such as antimicrobial,Reference Xie, Chu, Sun, Wu and Tong3,Reference Jadhav, Gaikwad, Nimse and Rajbhoj4 photothermal, and photoconductive applications,Reference Yates, Brook, Ditta, Evans, Foster, Sheel and Steele5 chemical and biological sensing,Reference Wang, Hu, Liu, Du, He and Xi6 catalysis,Reference Huang and Tsai7,Reference Zou, Chen, Liu and Lin8 application in lithium ion batteries,Reference Wang, Pan, Zhao and Chen9 field emission,Reference Liu, Zhong, Peng, Song and Chen10 gas sensing,Reference He, Jia, Meng, Li and Liu11 and solar cell.Reference Zhang and Zhang12 CuO nanoparticle synthesis has also been achieved through different methods, including reverse micelles,Reference Han, Yang, Zhu and Wang13 hydrothermal method,Reference Dar, Kim, Kim, Sohn and Shin14 thermal oxidation,Reference Kaur, Muthe, Despande, Choudhury, Singh, Verma, Gupta and Yakhmi15 microwave irradiation,Reference Zhu, Zhang, Tang and Wang16 and quick precipitation.Reference Zhu, Li, Chen, Yang, Lu and Wang17 Some of these methods have limitations because of the requirements for high temperature, expensive instruments, and special catalysis. For cost-effectiveness and simplicity of operation, quick precipitation is preferred. Among all the metal oxide nanoparticles, CuO could be mainly valuable antimicrobial agents because it is relatively cheap, easily mixed with polarized liquid (i.e., water) and polymers, and relatively stable in terms of both chemical and physical properties.Reference Ren, Hu, Cheng, Vargas-Reus, Reip and Allaker18 The antimicrobial properties of some metal oxide nanoparticles, such as zinc oxideReference Seil and Webster19 and iron oxide,Reference Zhang, Shi, Huang, Zhang, Wu and Xian20 have been previously reported. However, very little information on the possible antimicrobial activity of CuO nanoparticle is available. The purposes of this study are to synthesize and characterize chemically and physically CuO nanostructures, study the influence of different concentrations of polyvinylpyrrolidone (PVP) on the shape and size of final products, and investigate these compounds with respect to their potential antimicrobial applications.
II. EXPERIMENTAL METHODS
A. Materials
All the chemicals used in the experiment were of analytical reagent grade and were used without further purification. PVP (M w = 10,000) was provided by Sigma Aldrich (USA). The copper nitrate trihydrate [98%, Cu(NO3)2·3H2O] and sodium hydroxide (99.5%, NaOH) pellets were purchased from R & M chemicals (U.K.). Tryptone Soya Broth and Nutrient Broth (NB) were provided by Oxoid (U.K.) and Difco (France), respectively. Distilled water was used throughout the experiment.
B. Preparation of CuO nanosheets
In a typical experimental procedure, 0.5, 1, 2, and 5 g of PVP were weighed and poured into separate volumetric flasks. Distilled water was then added to bring the solution volumes to 100 mL (0.5, 1, 2, and 5 wt% PVP). A total of 1.45 g Cu(NO3)2·3H2O were dissolved in 60 mL PVP (0.5, 1, 2, and 5 wt% PVP). The solutions were added to a round-bottomed flask with stirring, and the resulting mixture color was bright blue. Solution pH was adjusted to 10 by adding NaOH (1 M), and then the solutions were kept at 60 °C for 1 h. A large amount of black precipitates were produced. After being cooled to room temperature, the particles were separated by centrifugation, washed three times with distilled water to remove impurities, and dried in an oven at 60 °C.
C. Characterization of the CuO nanosheets
The structure information of the samples was analyzed by powder x-ray diffraction (PXRD). The XRD patterns with diffraction intensity versus 2θ were recorded using a Philips PXRD (Philips, X′pert, and Cu Kα). The transmission electron microscopy (TEM) studies were carried out with a Hitachi H-7100 (Japan). A Shimadzu UV-3600 spectrophotometer (Japan) was used to record the ultraviolet-visible (UV-vis) absorption spectra. Field emission scanning electron microscopy (FE-SEM) and energy dispersive analysis of x-ray (EDAX) studies were carried out with a JEOL JSM–7600F. The compositions of the products were characterized by Fourier transform infrared (FTIR) spectroscopy with a Perkin Elmer Spectrum 100.
D. Antibacterial activity experiment
1. Disk diffusion method
The test for antimicrobial activity of the synthesized CuO nanosheets was conducted using the disk diffusion method performed on Muller Hinton Agar (M.H.A) according to Bauer et al.Reference Bauer, Kirby, Sherris and Turck21 CuO nanosheets treated differently were suspended in sterile distilled water at 5000 µg/mL and sonicated to ensure optimum nanoparticle dispersion. A Soniprep 150 MSE sonicator was used, with 3-s pulses and 6-s rests for a total of 90 s. Briefly, the sterile paper disk (6 mm) was impregnated with 20 µL CuO nanosheets and left to dry for 24 h at 37 °C in a sterile condition. Test microorganisms were cultured in NB (Difco) at 37 °C for 24 h. Sterile swabs were immersed in the microbial suspension (108 cells/mL) and applied to MHA plates. Finally, the impregnated disks were placed on inoculated agar and incubated at 37 °C for 24 h. The sensitivity of the test microorganisms to the CuO nanosheets was determined by measuring the sizes of inhibitory zones (including the diameter of the disk, which was 6 mm) on the agar surface around the disks. Experiments were performed in triplicate, and the results are reported as the average of three experiments. The pathogenic bacteria used to screen antibacterial activity in this study were as follows: Gram-positive bacteria [Staphylococcus aureus ATCC 11632, methicillin-resistant Staphylococcus aureus (MRSA), Staphylococcus epidermidis], Gram-negative bacteria (Escherichia coli ATCC 10536, Salmonella sp, Klebsiella sp), and the fungus Candida albicans. The strains were obtained from the marine microbial culture collection in UKM. They were maintained on Nutrient Agar (Difco) slants at 4 °C.
2. MBC evaluation
CuO nanoparticles at 5000, 2500, 1000, 500, 250, 100, 50, and 25 µg/mL in suspension were used to determine the lowest bactericidal concentration required to prevent the growth of bacteria after transfer onto nanoparticle-free media. Nanoparticle suspensions were prepared in tryptone soya broth (Oxoid Ltd., Basingstoke, U.K.) and sonicated as described above. Approximately 5 × 10⁷ CFU/mL of each microorganism were added to the nanoparticle suspension at a dilution of 1 in 100. Incubation was then carried out in a shaking incubator (200 rpm at 37 °C in air for 24 h). Inoculated nanoparticle-free broths were used as negative controls. Growth was then assessed by plating each nanoparticle/bacterial suspension onto tryptone soya agar (Oxoid) plates. Plates were incubated at 37 °C in air plus 10% CO2 for 24 h.
III. RESULTS AND DISCUSSION
The XRD pattern is shown in Fig. 1. All the diffraction peaks can be indexed as the monoclinic phase of CuO in whole samples. The lattice parameters were (a = 4.6837 Å, b = 3.4226 Å, and c = 5.1288 Å). The peaks at 2θ values of 32.53, 35.50, 38.67, 46.12, 48.85, 53.43, 58.31, 61.53, 66.33, 67.99, 72.41, and 75.20 correspond to the crystal planes of copper oxide 110, (002,111), (111,200), 112, 202, 020, 202, 113, 311, 113, 311, and 004, respectively, which are in good agreement with the recent observations. No peak of impurity was observed. This result indicates that pure-phase CuO was formed and the product was free from Cu2O, Cu(NO3)2, and Cu(OH)2.
XRD patterns at different concentrations of PVP: (a) 0.5 wt%, (b) 1 wt%, (c) 2 wt%, and (d) 5 wt%.

These values are consistent with the respective Joint Committee on Powder Diffraction Standards card no. 45-0937.
The optical absorption characteristics of CuO nanosheets prepared in different PVP concentrations were investigated by UV-vis spectroscopy, as shown in Fig. 2. Two peaks were observed in the absorption spectra of the samples prepared in 0.5, 1, 2, and 5 wt% PVP. In detail, the two peaks of the sample synthesized in 0.5 wt% PVP are located at 303 and 359 nm; the two peaks of the sample synthesized in 1 wt% PVP are located at 296 and 348 nm; the two peaks of the sample synthesized in 2 wt% PVP are located at 294 and 346 nm; and the two peaks of the sample synthesized in 5 wt% PVP are located at 292 and 344 nm. All of these peaks can be separated into two groups including the relatively short wave length peaks and the relatively long wave length peaks. The long wave length peaks of the samples are similar to the peaks of the sample synthesized without PVP (at 365 nm). Moreover, increasing the concentration of PVP leads to a blue shift in λmax in the relatively short wave length peaks, which reached its minimum at 5 wt% PVP. This result can be explained based on two reasons. First, the size of products obtained in different PVP concentrations decreased as the concentration of PVP increased. Semiconductor nanoparticles exhibit quantum confinement effects, which arise because in such small particles, the electronic energy levels do not form a continuous set but are discrete in nature. When electrons are excited in nanoparticles, the emitted light would have a size-dependent frequency. Higher frequency light is obtained from smaller nanoparticles.Reference Wang, Gao, Wu, Hu and Ruan22 Second, the sample synthesized in 5 wt% PVP has sharper tips than that of other samples. Chen et al.Reference Chen, Cui, Liu and Yang23 clarified that the narrower tips of CuO nanoparticles would make the gap of the energy band wider in the tip area. Accordingly, the measured absorption of the sample synthesized in 5 wt% PVP has higher energy than those of other samples. Thus, the blue shift of the relatively short wave length peaks was observed.
The UV-vis absorption spectra of CuO nanosheets prepared at different concentrations of PVP.
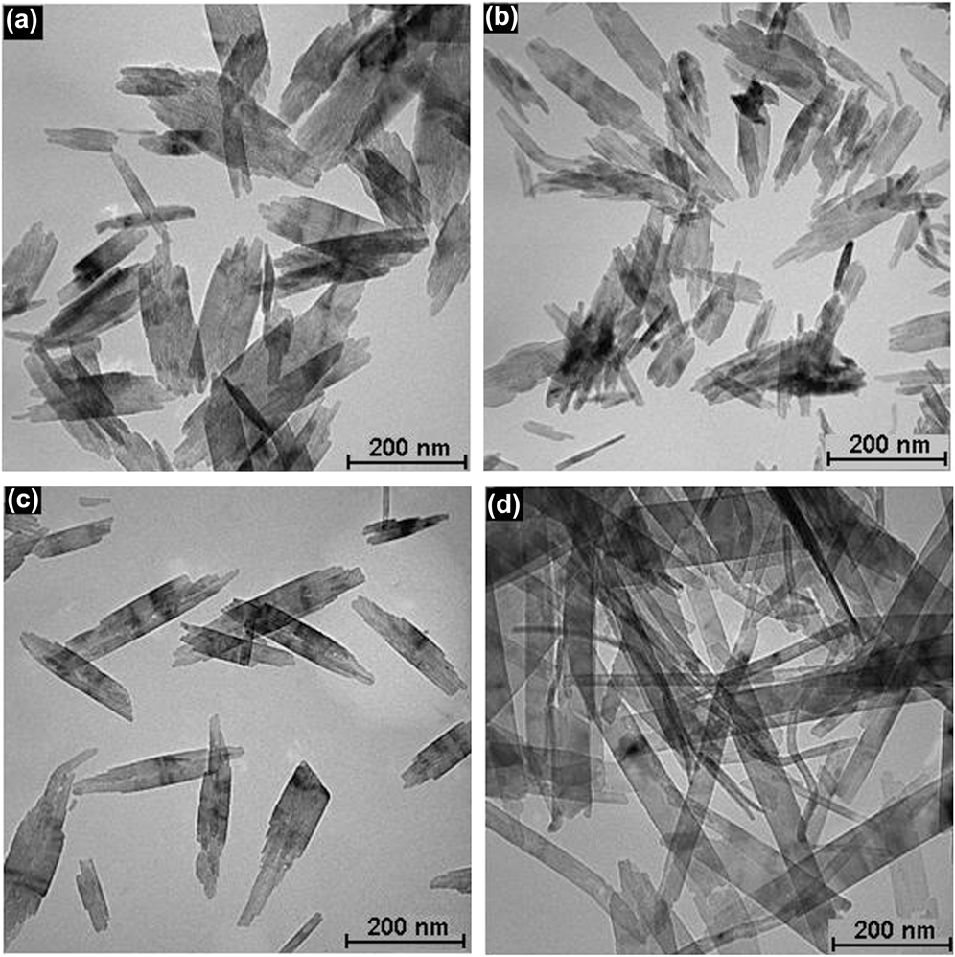
Figure 3 shows the TEM micrographs of CuO nanosheets prepared at different PVP concentrations. TEM revealed that the particles exhibit a sheet-like geometry. Figures 3(a)–3(d) reveal the formation of sheet-like CuO with the following widths and lengths, respectively: 131 ± 68 and 321 ± 175 nm for 0.5 wt% PVP; 97 ± 54 and 361 ± 155 nm for 1 wt% PVP; 82 ± 38 and 387 ± 169 nm for 2 wt% PVP; and 62 ± 26 and 506 ± 212 nm for 5 wt% PVP. The result showed that as the concentration of PVP increased, the width of the particles decreased and their length increased.
The TEM images of CuO nanostructures prepared at different concentrations of PVP: (a) 0.5 wt%, (b) 1 wt%, (c) 2 wt%, and (d) 5 wt%.
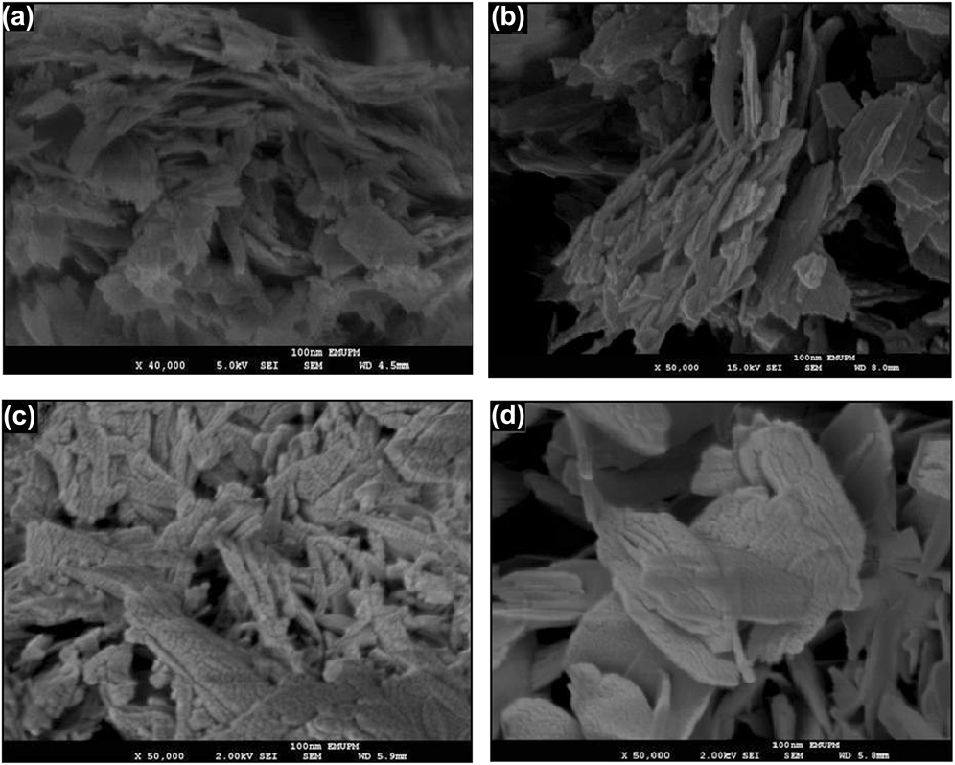
Figures 4(a)–4(d) show the respective morphology of the products obtained in 0.5, 1, 2, and 5 wt% PVP at pH 10. Figure 5 reveals that the shape of the products obtained at different PVP concentrations are sheet-like. As the concentration of PVP increased, well-defined morphologies were formed on the surface of the products.
The FE-SEM images of CuO nanosheets prepared at different concentrations of PVP: (a) 0.5 wt%, (b) 1 wt%, (c) 2 wt%, and (d) 5 wt%.
EDAX spectra of CuO nanosheets obtained at different concentrations of PVP: (a) 0.5 wt%, (b) 1 wt%, (c) 2 wt%, and (d) 5 wt%.
EDAX was carried out at 15 KeV electron energy using FE-SEM for whole samples. The EDAX spectra of the CuO nanosheets obtained in various concentrations of PVP including 0.5, 1, 2, and 5 wt% are shown in Figs. 5(a)–5(d). The results clearly indicated the existence of Cu and O peaks. Two peaks relevant to Cu were found at approximately 1 and 8 KeV in each sample. The EDAX analysis of CuO nanosheets synthesized at different concentrations of PVP also showed atomic ratio of copper in the range of 40%–49% and oxygen in the range of 41%–49% [Figs. 5(a)–5(d)]. These results are very close to the ratio expected for CuO (1:1).
FTIR is a suitable and sensitive method for detecting the interaction between two species. To confirm that the CuO nanosheets were modified by PVP, the FTIR technique was performed. Figure 6 shows the FTIR spectra for pure PVP [Fig. 6(a)], bare CuO (without PVP) [Fig. 6(b)], CuO nanosheets produced in 0.5 [Fig. 6(c)], 1 [Fig. 6(d)], 2 [Fig. 6(e)], and [Fig. 6(f)] 5 wt% PVP. In the FTIR spectrum of pure PVP, the peak at 1662 cm−1 corresponds to C=O and the peaks at 1066 and 1048 cm−1 correspond to C–N. A comparison of the curve in Fig. 6(a) with other curves showed that no peak was detected for C=O group in Fig. 6(b) but the peak of C=O shifted to 1640 cm−1 [Fig. 6(c)] and 1646 cm−1 [Fig. 6(d)], 1649 cm−1 [Fig. 6(e)], and 1652 cm−1 [Fig. 6(f)], and the peaks of C–N did not appear in the FTIR spectra of the CuO nanosheets. These results indicated that the PVP protective effect on CuO was due to O not N in PVP, which coordinated with the CuO nanosheets and formed a protective layer.Reference Wang, Qiao, Chen, Wang and Ding24 The coordination of CuO nanosheets with O in PVP and not with N is due to two main reasons. First, O is more polar than N because O is more electronegative than N. The second reason can be attributed to the shape and size of the particles. Peak shifts of the C=O group were observed in the PVP–CuO nanosheets, and the degrees of the peak shifts increased along with the decreasing PVP concentration. When the highest concentration of PVP was applied, a smaller peak shift was observed. This result can be attributed to the high amount of PVP that did not interact with the CuO nanosheets. Tu et al.Reference Tu, Zuo and Liu25 synthesized Pt nanoparticles in PVP and studied the effect of PVP on the size of the nanoparticles. They reported that when higher concentration of PVP was used, the size of the Pt nanoparticles remarkably decreased and a smaller peak shift was observed. Considering that the molar number of surfaces of the Pt nanoparticles is smaller than that of the PVP unit, only a small portion of carbonyl groups can approach the surface atom of the Pt nanoparticles. Consequently, a smaller peak shift was found in a higher amount of PVP. Metal oxide commonly gives absorption bands below 1000 cm−1.Reference Rao26 Absorption bands observed at 580 and 472 cm−1 in the Fig. 6(b) curve, at 598 and 480 cm−1 in the Fig. 6(c) curve, at 600 and 490 cm−1 in the Fig. 6(d) curve, at 602 and 500 cm−1 in the Fig. 6(e) curve, and at 603 and 505 cm−1 in the Fig. 6(f) curve are characteristic of CuO.
The FTIR spectra of pure PVP (a), bare CuO (without PVP) (b), CuO nanosheets produced with different concentrations of PVP: 0.5 wt% (c), 1 wt% (d), 2 wt% (e), and 5 wt% (f).
IV. MECHANISM
In this study, the following reactions are involved in the preparation of CuO nanosheets.
 $${\rm{Cu(N}}{{\rm{O}}_{\rm{3}}}{{\rm{)}}_{\rm{2}}} \cdot {\rm{3}}{{\rm{H}}_{\rm{2}}}{\rm{O}} + {\rm{PVP}} \to {\rm{Cu(PVP}}{{\rm{)}}^{{\rm{2 + }}}}_{{\rm{(aq)}}} + {\rm{2N}}{{\rm{O}}_{\rm{3}}}{^ - _{{\rm{(aq)}}}}\quad ,$$
 $${\rm{NaOH}} \to {\rm{N}}{{\rm{a}}^{\rm{ + }}}_{{\rm{(aq)}}} + {\rm{O}}{{\rm{H}}^ - }_{{\rm{(aq)}}}\quad ,$$
 $${\rm{Cu(PVP}}{{\rm{)}}^{{\rm{2 + }}}}_{{\rm{(aq)}}} + {\rm{2O}}{{\rm{H}}^ - }_{{\rm{(aq)}}} \to {\rm{Cu(OH}}{{\rm{)}}_{\rm{2}}}{\rm{/PVP}}\quad {\rm{,}}$$
 $${\rm{Cu(OH}}{{\rm{)}}_{\rm{2}}}{\rm{/PVP}} \to {\rm{CuO/PVP}} + {{\rm{H}}_{\rm{2}}}{\rm{O}}\quad {\rm{.}}$$
PVP has the structure of a polyvinyl skeleton with polar groups (amide group). Amide appears to be the most polar because it can donate and accept hydrogen bonds on both the O and the N. The amide group donates lone-pair electrons that form a coordinative interaction with Cu ions, thus creating a complex compound. When PVP is used as a stabilizer, the first step is the formation of a coordinative bonding between PVP and Cu ions, producing the Cu(PVP)2+ complex (Fig. 7). PVP acts as a stabilizer for dissolved metallic salts through steric and electrostatic stabilization of the amide groups of the pyrrolidone rings.Reference Soltani, Saion, Erfani, Rezaee, Bahmanrokh, Drummen, Bahrami and Hussein27 The formed complex is present in the solution.
The interaction between PVP and metal ions.
When sample pH was set to 10 by the addition of NaOH (1 M), an intense blue Cu(OH)2 formed [Eq. (3)], indicating supersaturation due to hydroxylation.Reference Oskam28 Nucleation and growth occurred immediately after supersaturation. The Cu(OH)2 crystal is formed by sheet stacking, which is composed of distorted  ${\rm{Cu(OH)}}_{\rm{6}}^{{\rm{4}} - }$ octahedra through hydrogen bonds.Reference Rodriguez-Clemente, Serna, Ocana and MatijeviÄ29 In the nucleation step, a growth unit is needed for crystals to grow on. The
 ${\rm{Cu(OH)}}_{\rm{6}}^{{\rm{4}} - }$ complex acts as a growth unit because based on the anionic coordinative polyhedral theoretical model, the cations are considered to exist in the form of a complex. The ligands of this complex are OH− ions in an aqueous solution that also form complexes with coordinative numbers equal to that of the formed crystal identified as a growth unit. In aqueous solutions, the coordination number of Cu2+ is normally six.Reference Wu, Ma, Gu and Yang30 Consequently, growth units exist in
 ${\rm{Cu(OH)}}_{\rm{6}}^{{\rm{4}} - }$ of the coordinating octahedron in the NaOH solution. At low temperatures, the
 ${\rm{Cu(OH)}}_{\rm{6}}^{{\rm{4}} - }$ complex forms hydrogen bonds, which could stabilize this complex at low temperatures. By increasing the temperature, the hydrogen bonds were broken and the growth units of
 ${\rm{Cu(OH)}}_{\rm{6}}^{{\rm{4}} - }$ were destroyed rapidly, which ultimately yielded black CuO nanostructures.
The existence of selective capping agents, such as PVP, in a reaction could control the growth rates of various faces of metal oxide nanoparticles through adsorption on these surfaces. PVP macromolecules could selectively interact with different faces of CuO nanostructures through Cu–N and Cu–O coordination bonds. According to the FTIR results, a weak chemical bond exists between the band of C=O and CuO nanosheets.Reference Zhang and Cui31 Consequently, the growth rates of some surfaces would be greatly reduced, leading to a highly anisotropic growth for the CuO nanosheets. In this study, when PVP is introduced, the selective interaction between PVP and various crystallographic planes of CuO was assumed to have the ability to greatly reduce the growth rate along the [100] direction and accordingly enhance the growth rate along the [010] direction. These results were further confirmed by TEM observations as shown by the average ratio of length to width of these nanosheets, which increased with increasing PVP concentrations. The results showed that PVP can induce rapid nucleation, which results in smaller particles. It is worth noting that further increasing the PVP concentration beyond 5% does not result in the production of smaller particles because the reaction system becomes so viscous, and it is challenging to collect the CuO nanosheets.
V. ANTIMICROBIAL ACTIVITY OF THE SYNTHESIZED CUO NANOSHEETS
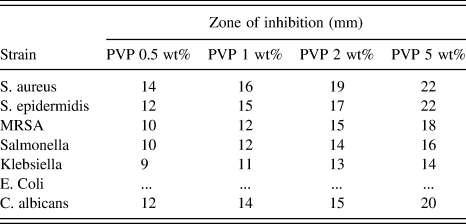
The antimicrobial activities of the synthesized CuO nanosheets (5000 µg/mL) were screened against seven human pathogenic bacteria by disk diffusion method (see Fig. 8). The CuO nanosheets with different PVP concentrations showed stronger antimicrobial activity against Gram-positive bacteria and the fungus C. albicans with the average inhibition zone of 10–22 mm compared with Gram-negative bacteria (9–16 mm, Table I). The results of the disk diffusion method showed that the highest activity was observed against S. aureus and S. epidermidis with a zone of inhibition of 22 mm in 5 wt% PVP, and the lowest activity was observed against Klebsiella sp and Salmonella sp in 0.5 wt% PVP (9 and 10 mm, respectively). Table I shows that increasing the PVP concentration in the CuO nanosheets results in an increase in the antimicrobial activity of these particular nanosheets. The CuO nanosheets did not inhibit E. coli.
The pictures show disk diffusion (inhibition zone).
Antimicrobial activity of CuO nanosheets at different concentrations of PVP.
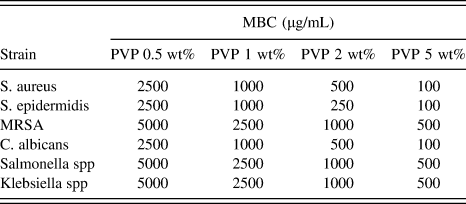
According to the disk diffusion results, minimum bactericidal concentration (MBC) of CuO was carried out for the microorganism activity that CuO can inhibit. The MBC results of the CuO nanosheets also confirmed that the antimicrobial activity of the CuO nanosheets at different PVP concentrations increased as the concentration of PVP increased (Table II). The MBC value of CuO for Gram-positive bacteria and C. albicans ranged between 5000 and 100 µg/mL. For Gram-positive bacteria and C. albicans, the highest MBC value of 5000 µg/mL was determined for MRSA in 0.5 wt% PVP and 500 µg/mL in 5 wt% PVP. The MBC values for S. aureus, S. epidermidis, and C. albicans were between 2500 and 100 µg/mL for 0.5 and 5 wt% PVP, respectively. The MBC values were dependent on the particle size. The MBC results also confirmed that Gram-negative bacteria are more resistant to CuO nanosheets compared with Gram-positive bacteria and C. albicans.
MBC of CuO nanosheets synthesized at different concentrations of PVP against human pathogens.
Table I (zone of inhibition) indicates that CuO nanosheets showed greater antimicrobial activity against Gram-positive bacteria. The variation in the resistance and sensitivity to both Gram-negative and Gram-positive bacteria populations could be due to the differentiation in the metabolism, cell structure, physiology, or degree of contact of the bacteria with the nanoparticles. For instance, greater sensitivity among Gram-positive bacteria such as S. aureus to the CuO nanosheets can be attributed to the greater abundance of carboxyl groups and amines on their cell surface and greater affinity of Cu toward these groups. Meanwhile, Gram-negative bacteria have a special cell membrane structure that possesses a major ability to resist antimicrobial agents. In addition, other factors such as the diffusion rate of nanoparticles could also affect bacterial strain differently.Reference Azam, Ahmed, Oves, Khan and Memic32 In conclusion, CuO nanoparticles at different PVP concentrations show good antimicrobial activities against Gram-positive and Gram-negative bacteria as well as C. albicans as fungus compared with Gram-negative bacteria. Both disk diffusion and MBC methods confirmed that the potency of the antimicrobial activity of CuO nanosheets is dependent on different PVP concentrations, given that with increasing PVP concentration, its antimicrobial activity likewise increased. This result can be explained based on the size of the products obtained at different PVP concentrations because the size of CuO decreased when the concentration of PVP increased, as described above.
Ren et al.Reference Ren, Hu, Cheng, Vargas-Reus, Reip and Allaker18 reported that CuO nanoparticles were effective in killing a range of bacterial pathogens that are hospital-acquired, but a high concentration of nano-CuO is required. A few studies have been performed to elucidate the mechanism of bactericidal action of nanoparticles. Kim et al.Reference Kim, Kuk, Yu, Kim, Park, Lee, Kim, Park, Park and Hwang33 reported that the Gram-positive bacteria S. aureus are more resistant to silver nanoparticles compared with the Gram-negative bacteria E. coli and explained that this might be due to the thickness of the peptidoglycan layer in the Gram-positive bacterial cell wall, which may prevent, to some extent, the action of nanoparticles. However, Ruparelia et al.Reference Ruparelia, Chatterjee, Duttagupta and Mukherji34 demonstrated that some E. coli strains were more resistant than S. aureus to silver nanoparticles. Hence, the bactericidal efficiency of nanoparticles and CuO nanosheets is not solely dependent on the structure of the bacterial membrane. CuO may also bind with DNA molecules and lead to the disorder of the helical structure by cross-linking within and between the nucleic acid strands. Cu ions inside bacterial cells also disrupt biochemical processes. The exact mechanism behind the bactericidal effect of CuO nanoparticles is not known and needs further studies.
VI. CONCLUSION
CuO nanosheets were successfully fabricated in PVP by the quick precipitation method. The effect of different PVP concentrations on the shape and size of particles was investigated. Different sizes and shapes of CuO nanosheets could be obtained by simple variations of PVP concentration. The XRD results confirmed the formation of pure-phase CuO with monoclinic structure. TEM results showed that the average ratio of length to width of these nanosheets increased with increasing PVP concentration. Considering the quantum size effect, CuO nanosheets exhibited a blue shift in the UV-vis spectra. FE-SEM analysis showed that as the concentration of PVP increased, well-defined morphologies formed in the surface of the products. EDAX clearly confirmed the presence of Cu and O with an atomic ratio 1:1. FTIR results showed that C=O in PVP coordinated with CuO nanosheets and formed a protective layer. The as-prepared CuO nanosheets were tested for antibacterial activity against both Gram-positive and Gram-negative bacteria and a fungus. The results showed that all the CuO nanosheets exhibited an inhibitory effect against both Gram-negative and Gram-positive bacteria, except E. coli. The antibacterial activity of the CuO nanosheets was found to be size-dependent. Moreover, the CuO nanosheets indicated greater antimicrobial activity against Gram-positive bacteria. The maximum inhibition zone for all microorganisms was reached using CuO nanosheets synthesized in 5 wt% PVP.
ACKNOWLEDGMENT
The authors are also grateful to staff of Microscopy unit of Institute of Bioscience UPM for technical support.