1 Introduction
The problem of electromagnetic (EM) emission at the plasma frequency from a spatially extended beam-plasma system is of interest for both space and laboratory research. In type II and III solar radio bursts (Henri et al. Reference Henri, Sgattoni, Briand, Amiranoff and Riconda2019; Yao et al. Reference Yao, Muñoz, Büchner, Zhou and Liu2021), emissions at the plasma frequency $\omega _p$ and its second harmonic are often comparable in intensities, although the escape of $\omega _p$
 -radiation from the generation region should be significantly complicated by the proximity to the cutoff frequency of EM waves. Recently, the processes of transformation of electrostatic plasma oscillations into EM ones near the cutoff frequency have been actively discussed with regard to generation of powerful terahertz pulses (Hur et al. Reference Hur, Ersfeld, Noble, Suk and Jaroszynski2017; Miao, Palastro & Antonsen Reference Miao, Palastro and Antonsen2017; Kwon et al. Reference Kwon, Kang, Song, Kim, Ersfeld, Jaroszynski and Hur2018; Volchok, Timofeev & Annenkov Reference Volchok, Timofeev and Annenkov2019; Kalmykov, Elle & Schmitt-Sody Reference Kalmykov, Elle and Schmitt-Sody2020). A similar problem of generating narrowband THz radiation of a multimegawatt power level is being solved today in laboratory beam-plasma experiments (Arzhannikov et al. Reference Arzhannikov, Burdakov, Burmasov, Gavrilenko, Ivanov, Kasatov, Kuznetsov, Mekler, Polosatkin and Postupaev2014, Reference Arzhannikov, Burdakov, Burmasov, Ivanov, Kasatov, Kuznetsov, Makarov, Mekler, Polosatkin and Popov2016) in order to create a powerful radiation source that can be used in fundamental science (Dhillon et al. Reference Dhillon, Vitiello, Linfield, Davies, Hoffmann, Booske, Paoloni, Gensch, Weightman and Williams2017). In particular, in recent experiments at the GOL-PET (Arzhannikov et al. Reference Arzhannikov, Ivanov, Kasatov, Kuznetsov, Makarov, Mekler, Polosatkin, Popov, Rovenskikh and Samtsov2020) facility, the power of EM emission in the vicinity of the plasma frequency $\omega _p$
 is found to increase tens of times if the preliminary plasma created by a high-voltage discharge contains quasiperiodic density gradients directed across the guiding magnetic field. Since the development of the two-stream instability for the typical parameters of this experiment is always accompanied by small-scale longitudinal modulation of the ion density due to the modulation instability of the dominant plasma wave, the main feature that distinguishes a stratified discharge in these experiments from an unstratified one is the appearance of a periodic density perturbation with the wavevector ${\boldsymbol q}$
 directed at an angle to the magnetic field.
It is well known that the efficiency of beam-to-$\omega _p$ -radiation power conversion can reach very high values (${\sim }10\,\%$
 ) (Annenkov, Volchok & Timofeev Reference Annenkov, Volchok and Timofeev2016b; Annenkov, Timofeev & Volchok Reference Annenkov, Timofeev and Volchok2016a) due to the mechanism of plasma antenna. The original idea has supposed that an electron beam propagating through a plasma with a strong enough magnetic field typical to laboratory experiments drives electrostatic oscillations via the two-stream instability. If the plasma density is modulated along the magnetic field with the period close to the wavelength of the most unstable beam-driven mode and the plasma thickness is of the same scale, this electrostatic mode can couple with oblique EM oscillations escaping in vacuum. In this formulation, the mechanism of plasma antenna (Timofeev, Volchok & Annenkov Reference Timofeev, Volchok and Annenkov2016; Annenkov et al. Reference Annenkov, Berendeev, Volchok and Timofeev2019a) explains the high efficiency of radiation at $\omega _p$
 harmonics in experiments with narrow subrelativistic beams (Burdakov et al. Reference Burdakov, Arzhannikov, Burmasov, Ivanov, Ivantsivsky, Kandaurov, Kuznetsov, Kurkuchekov, Mekler and Polosatkin2013; Postupaev et al. Reference Postupaev, Burdakov, Ivanov, Sklyarov, Arzhannikov, Gavrilenko, Kandaurov, Kasatov, Kurkuchekov and Mekler2013; Annenkov, Timofeev & Volchok Reference Annenkov, Timofeev and Volchok2019b), but it is not suitable for describing emission processes in thick turbulent plasmas driven by wide-aperture beams of gigawatt power (Arzhannikov et al. Reference Arzhannikov, Ivanov, Kasatov, Kuznetsov, Makarov, Mekler, Polosatkin, Popov, Rovenskikh and Samtsov2020). The first attempts to obtain high radiation efficiency due to the antenna mechanism in thick plasma were based on the transition to the regime of its complete transparency (Timofeev, Berendeev & Dudnikova Reference Timofeev, Berendeev and Dudnikova2017) for the generated EM radiation. In this regime, there is a window in the longitudinal modulation wavenumber $q_{\|}$
 , inside which EM oscillations emerging into vacuum propagate through the magnetized plasma as ordinary and extraordinary eigenmodes. In the regime of plasma transparency, radiation can indeed be generated in the entire volume of the plasma (not only in the near-boundary skin layer of finite thickness), but, for strictly longitudinal density modulation, an increase in the plasma thickness does not lead to an increase in the radiation power, since the longitudinal radiating current that pumps energy into the plasma eigenmodes does not have the same transverse periodic structure as these modes and effectively interacts with only one half-wave of these oscillations.
In this paper, we will show that due to the transition to oblique modulation of the plasma density, the current of the long-wavelength satellite of the most unstable beam wave can be modulated in the transverse direction with any predetermined wavenumber $q_{\bot }$ , providing the possibility of resonance with eigenmodes of magnetized plasma. In this case, the beam is able to pump a resonant eigenmode over the entire width of the plasma column, due to which its amplitude increases linearly with increasing plasma thickness. To describe this regime, we generalize the theory of the beam-plasma antenna (Timofeev et al. Reference Timofeev, Volchok and Annenkov2016) to the case of arbitrary oblique density modulation (§ 2) and find the regions in ${\boldsymbol q}$
 -space where the maximum radiation efficiency is achieved. Such a theory, however, goes beyond the scope of its applicability when the plasma width $2l$
 increases to dimensions comparable to the beam relaxation length $L$
 . To understand how efficiently the resonance between the satellite and natural plasma oscillations can work in a wider plasma, we construct a theoretical model for the opposite limiting case ($2l\gg L$
 ). In addition, in § 3.2, we numerically simulate the phenomenon in the intermediate regime ($L\sim 2l$
 ) using a particle-in-cell (PIC) model which allows us to analyse the radiation output not only across, but also along the plasma column.
Another mechanism that appears in the case of oblique density modulation is associated with the fact that the long-wavelength satellite $(\omega,{\boldsymbol k}-{\boldsymbol q})$ by itself (having a non-zero magnetic component in this case) can be considered as an unstable eigenmode of the beam-plasma system. Yoon & Wu (Reference Yoon and Wu1994) based on the linear analysis of the beam-plasma instability in a density-modulated unmagnetized plasma showed that an unstable satellite can couple with an EM branch, which opens up the possibility of its linear conversion into an EM wave during its propagation into a less dense plasma. In our PIC simulations, the plasma density is, on average, homogeneous; therefore, a similar conversion is observed only at sharp lateral boundaries of the plasma column and only when the instability develops in the immediate vicinity of these boundaries (§ 3.3). In the longitudinal direction, a strongly localized region of intense beam relaxation is followed by a stable plasma; therefore, in a realistic situation typical to laboratory experiments, the mechanism of linear conversion of a satellite into an EM wave must pass through intermediate excitation of natural oscillations of this plasma. We will show that the relaxation region in this case serves as an antenna for oscillations that can propagate along the plasma column. Therefore, with a sufficiently strong localization of the pumping region, the antenna mechanism can work even in the absence of full resonance between the satellite and the natural plasma oscillations.
2 Antenna theory for arbitrary orientation of density modulation
Let us consider the problem of injection of a monoenergetic electron beam with a density $n_b$ and velocity $v_b$
 into a cold magnetized plasma with a density $n_0$
 and magnetic field $B_0$
 . The magnitude of this stationary magnetic field is characterized by the ratio of the electron cyclotron frequency to the plasma one $\varOmega =\varOmega _e/\omega _p$
 ($\varOmega _e=eB_0/(m_e c)$
 , $\omega _p=\sqrt {4{\rm \pi} e^2 n_0/m_e}$
 , where $c$
 is the speed of light, $e$
 and $m_e$
 are the charge and mass of the electron) and the direction coincides with the direction of beam motion (axis $z$
 ). For convenience of comparison with two-dimensional PIC simulations, we will assume that the plasma is an infinite plane layer with a finite thickness $2l$
 along the $x$
 axis. If a periodic density perturbation $n_e({\boldsymbol r})/n_0=1+\delta n \cos ({\boldsymbol q \cdot \boldsymbol r})$
 with the wavevector ${\boldsymbol q}=(q_{\bot },0,q_{\|})$
 is previously created in the plasma, the most unstable plasma wave $(\omega,{\boldsymbol k})$
 with the electric field

driven by the beam via the Cherenkov resonance ${\boldsymbol k}=(0,0,k_b)$ , generates satellites $(\omega, {\boldsymbol k}\pm {\boldsymbol q})$
 . Since the superluminal phase velocity can be achieved only by long-wavelength oscillations $(\omega, {\boldsymbol k}-{\boldsymbol q})$
 , emission of EM waves in vacuum with the same frequency and longitudinal wavenumber, $\mathcal {K}_{\|}=k_b-q_{\|}$
 , as the satellite has, is produced by the electric current

Hereinafter, we use dimensionless quantities: distances and times are measured in units of $c/\omega _p$ and $\omega _p^{-1}$
 ; wavenumbers and frequencies in $\omega _p/c$
 and $\omega _p$
 ; number and current densities in $n_0$
 and $en_0c$
 ; and electric and magnetic fields in $m_e c\omega _p/e$
 . Oscillations of the electric field excited by this current in the plasma will be sought in the form

Maxwell's equations in this case are reduced to the same system of differential equations that was obtained in Timofeev et al. (Reference Timofeev, Volchok and Annenkov2016),


with the only difference that the driving force for these oscillations is now modulated across the magnetic field with the wavenumber $q_{\bot }$ . As before, the solution of the system (2.4)–(2.5) can be represented as the sum of the eigenmodes of cold magnetized plasma (a general solution of homogeneous equations) and forced oscillations $\mathcal {E}_{y,z}$
 , which we call a long-wavelength satellite (a particular solution of an inhomogeneous system),


where $\varkappa _1$ and $\varkappa _2$
 are the transverse wavenumbers of eigenmodes satisfying the dispersion equation

Unlike the case of longitudinal density modulation $q_{\bot }=0$ , when the satellite is a strictly electrostatic wave with $\mathcal {E}_z=-\textrm {i}\mathcal {J}/(\omega \eta )$
 , oscillations scattered by the oblique density perturbation become electromagnetic,


If the satellite gets into resonance with one of the eigenmodes (for example, $q_{\bot }=\varkappa _1$ ), this mode continues to be pumped by the beam during its propagation over the entire width of the plasma, therefore, a term appears in its amplitude that increases linearly with $x$
 :


At the boundaries of the plasma column $x=\pm l$ , the tangential electric and magnetic fields found inside the plasma must be matched with the fields of vacuum EM waves,


where $\mathcal {K}_{\bot }=\sqrt {\omega ^2-\mathcal {K}_{\|}^2}$ is the transverse wavenumber of vacuum EM waves. Finding the constants $C_i$
 from the boundary conditions (see Appendix A) and calculating the component of the Poynting vector normal to the boundary, we obtain the radiation power $P_{\textrm {rad}}$
 , which in units of the beam power $P_b$
 takes the form

It is assumed here that the amplitude of the most unstable beam-driven wave $E_0(z)$ depends on the longitudinal coordinate, although this dependence is considered negligible on scales comparable to not only the wavelength, but also plasma width. For estimates in order of magnitude, by the integral $\int E_0^2\,\textrm {d}z$
 we mean the quantity $E_0^2L$
 in which the characteristic field of the beam-driven wave is found from the equality of the bounce frequency of electrons trapped in the wave and the growth rate of the two-stream instability $\varGamma$
 ,

and the beam relaxation length is estimated at $L\approx 3v_b/\varGamma$ . The frequency $\omega$
 and the wavenumber $k_b$
 of the pump wave under the Cherenkov resonance condition are given by the expressions

However, as it was shown earlier by Timofeev et al. (Reference Timofeev, Berendeev and Dudnikova2017), in the state of nonlinear saturation, $k_b$ slightly increases in comparison with the prediction of the linear theory due to a lower velocity of the trapped beam. Moreover, in the problem of continuous beam injection, we are dealing with a wave packet localized in space instead of a plane wave. Thus, the Fourier spectrum of such a packet has a finite width. Further PIC simulations show that the value $k_b\approx 1.1\omega /v_b$
 can be chosen as the characteristic longitudinal wavenumber in this packet.
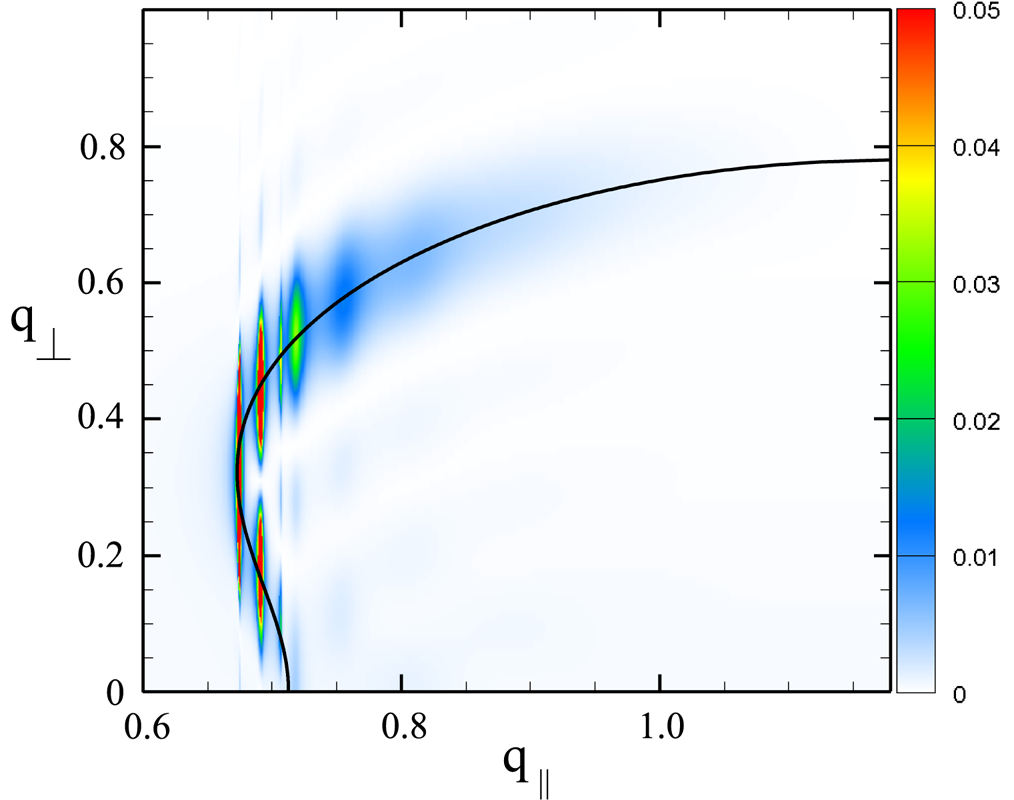
The results of calculating the efficiency of beam-to-radiation power conversion for various wavenumbers of density modulation $q_{\bot }$ and $q_{\|}$
 are shown in figure 1. It can be seen that, along $q_{\|}$
 , the region of effective $\omega _p$
 -emission ($\mathcal {P}>1\,\%$
 ) is localized in the region of plasma transparency, when at a given frequency $\omega$
 and a longitudinal wavenumber $\mathcal {K}_{\|}$
 there are two undamped eigenmodes $\varkappa _1$
 and $\varkappa _2$
 at once. It can also be seen that, for any selected value of $q_{\|}$
 , the radiation efficiency reaches a maximum when the satellite with the transverse wavenumber $q_{\bot }$
 falls into resonance with one of the eigenmodes of the magnetized plasma ($q_{\bot }=\varkappa _1$
 or $q_{\bot }=\varkappa _2$
 ). The finite width of the plasma limits the spectrum of possible oscillations to a discrete set of modes $\varkappa _{1,2}={\rm \pi} N/l$
 with integer values $N$
 , and therefore high efficiency on the resonance curve is achieved only for some individual values of $q_{\bot }$
 .
Efficiency of beam-to-radiation power conversion $\mathcal {P}$ calculated by the formula (2.17) for the maximal plasma thickness $2l=40$
 that can be considered by such a theory ($n_b=0.01$
 , $v_b=0.9$
 , $\varOmega =0.4$
 , $\delta n=0.025$
 , $k_b=1.18$
 ). The solid line shows the location of resonances $q_{\bot }=\varkappa _{1,2}$
 .

According to the predictions of our theory, outside resonances, the radiation efficiency should decrease with increasing plasma width as $\mathcal {P}\propto l^{-1}$ (which has already been observed in the particular case of strictly longitudinal modulation Timofeev et al. (Reference Timofeev, Berendeev and Dudnikova2017)). When the satellite gets in resonance with plasma eigenmodes, the efficiency, on the contrary, should increase according to the law $\mathcal {P}\propto l$
 . Thus, the theory described above indicates that the most efficient regimes for generating $\omega _p$
 -radiation should be sought in a thick plasma, but the region of applicability of this theory is limited by the condition $2l\ll L$
 requiring the plasma to be thin compared with the size of the longitudinal localization of the pump wave. To find the level at which the growth of the radiation efficiency in a thick plasma saturates, we consider the problem in the opposite limiting case $2l\gg L$
 .
In this regime, one can neglect the presence of lateral boundaries of the plasma layer and consider the beam relaxation region elongated along $x$ as an antenna emitting EM eigenmodes into the surrounding plasma with the same frequency and the same transverse wavenumber as in the satellite of the beam-driven mode. Assuming that the amplitude of the radiating current (2.2) $\mathcal {J}(z)$
 now depends on the longitudinal coordinate and is localized in the region $z\in (0,L)$
 , we will seek solutions to Maxwell's equations in the form

These equations can be reduced to the single fourth-order differential equation for the amplitude $E_y(z)$ ,

where


Longitudinal wavenumbers of plasma eigenmodes ($\pm \kappa _1$ , $\pm \kappa _2$
 ) for given values of $\omega$
 and $q_{\bot }$
 are found from the dispersion equation

For the parameters chosen for subsequent PIC simulations, two solutions ($\pm \kappa _2$ ) turn out to be purely imaginary and correspond to oscillations exponentially decaying on both sides of the relaxation zone. A particular solution of the inhomogeneous equation (2.21) for a wave travelling towards the beam has the form

Outside the relaxation region ($z>L$ ), this solution describes the plasma eigenmode $E_y=A\exp (\textrm {i}\kappa _1 z)$
 with an amplitude

For the longitudinal flow of EM energy (in units of $n_0 m_e c^3$ ) carried by this eigenmode, we obtain

Taking into account the coefficient of linear transformation $T$ of this mode into a vacuum EM wave at the plasma boundary, the radiation efficiency is calculated as

For subsequent comparison with simulation data, we will describe the spatial distribution of the beam-driven wave amplitude in the relaxation zone $z\in (0,L)$ using a model profile

In this case, for the integral in (2.27), one can obtain an analytical expression

Note that the radiation efficiency in thick plasma ceases to depend on its thickness. Another interesting consequence of formula (2.28) is that, in a thick plasma, the maximum radiation efficiency begins to depend on the relative beam density. Really, while in a thin plasma the radiation power constitutes a constant fraction of the power pumped by the beam into unstable plasma oscillations ($\mathcal {P} \propto E_0^2 L/n_b \propto 1$ ), in a thick plasma the amplitude of radiated EM wave $E_{\textrm {rad}}$
 ceases to be governed by the local values of plasma wave amplitude, but continues to grow along the whole relaxation length ($E_{\textrm {rad}} \propto \int E_0 \,\textrm {d}z$
 ). It leads to the scaling $\mathcal {P} \propto (E_0 L)^2/n_b \propto n_b^{-1/3}$
 describing the decrease of radiation efficiency with the growth of $n_b$
 .
For the set of parameters of interest to us ($E_0=0.1$ , $L=40$
 , $n_b=0.01$
 , $v_b=0.9$
 , $\varOmega =0.4$
 , $\delta n=0.05$
 , $k_b=1.18$
 ), the efficiency of generation of $\omega _p$
 -radiation in the ${\boldsymbol q}$
 -space for $T=1$
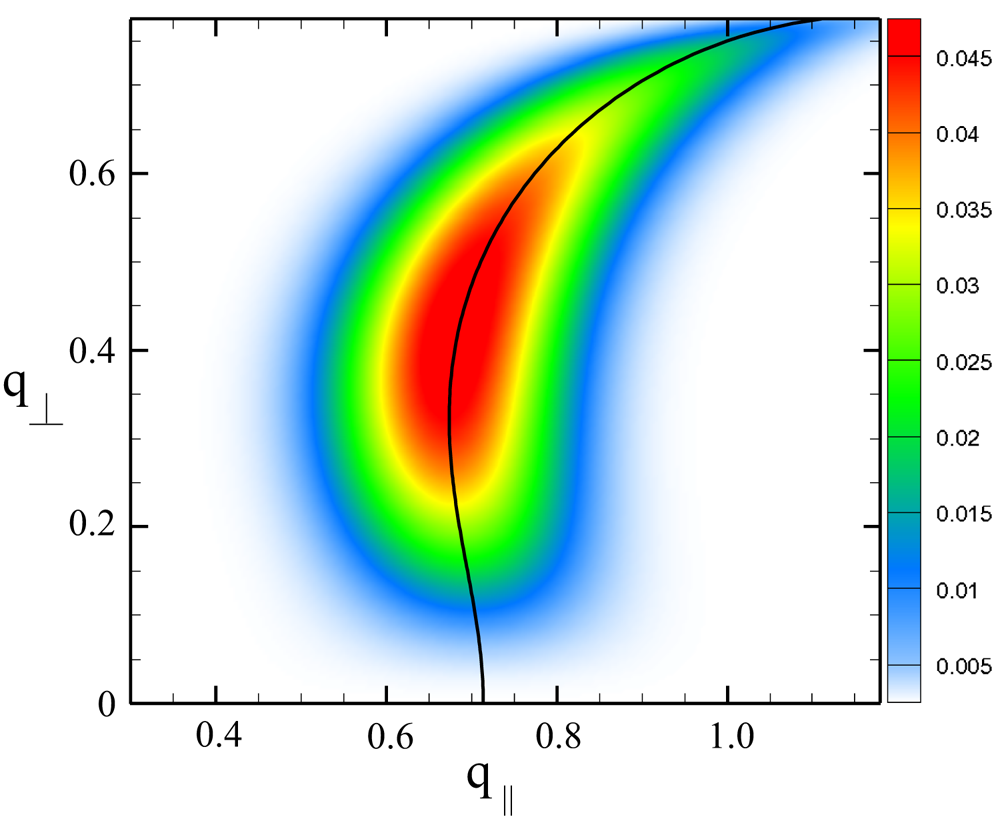
 is shown in figure 2. It can be seen that the maximum values are still achieved under the resonance of the satellite with the natural plasma oscillations, but, due to the strong localization of the beam relaxation region, this resonance turns out to be rather wide.
Efficiency of beam-to-radiation power conversion $\mathcal {P}$ calculated by the formula (2.28) in a thick plasma ($2l\gg L$
 ) as a function of modulation wavenumbers $q_{\bot }$
 , $q_{\|}$
 . The solid line shows the location of resonance $\mathcal {K}_{\|}=\kappa _{1}$
 .

3 PIC simulations
In experiments at the GOL-PET facility, the diameter of the beam-plasma system is comparable to the relaxation length of the beam; therefore, it is of interest to investigate the intermediate regime $L\sim 2l$ lying at the junction of applicability regions of our theoretical models. According to the theory, already in this regime, we should achieve the maximum radiation efficiency that is insensitive to a further increase in the transverse dimensions of the beam and plasma. To verify the conclusions of the theory about the possibility of achieving an efficiency of generation of $\omega _p$
 -radiation at a level of several per cent in a thick plasma due to the hit of the long-wavelength satellite in resonance with the plasma eigenmodes, we will numerically simulate the injection of an electron beam into a magnetized plasma using the PIC method.
3.1 Numerical model
We use our own parallel 2D3V (two spatial dimensions and three velocity components) PIC code in which the calculation of the self-consistent dynamics of particles and fields is based on the standard Boris (Boris Reference Boris1970) and Yee (Yee Reference Yee1966) algorithms, and the currents are calculated according to the Esirkepov scheme (Esirkepov Reference Esirkepov2001).
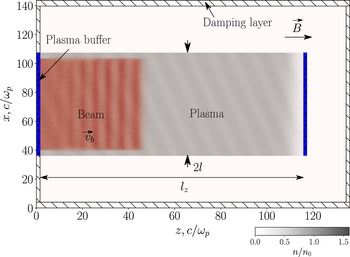
A schematic view of the computational domain is shown in figure 3. In the centre of this region there is a plasma which, in the two-dimensional Cartesian $(x,z)$ geometry, is assumed to be homogeneous and infinite along the $y$
 axis. At the initial moment of time, electrons are distributed uniformly over the spatial grid, and the weight of each macroelectron changes in accordance with the selected inhomogeneous plasma density distribution $n_e(x,z)$
 (ions are considered to be a stationary compensating background). In the momentum space, electrons have a Maxwellian distribution $f_e \propto \exp (-{\boldsymbol p}^2/(2 m_e T_e))$
 with the temperature $T_e=80$
 eV. Plasma is immersed in a uniform magnetic field with $\varOmega =eB/(m_e c\omega _p)=0.4$
 directed along the $z$
 axis. In the longitudinal direction, the plasma layer is limited by special buffers (Annenkov et al. Reference Annenkov, Berendeev, Timofeev and Volchok2018) which provide open boundary conditions at both ends of the plasma.
Layout of computational domain in PIC simulations.

At the initial moment of time, an electron beam with the transverse size 8 units less than the plasma width starts to be injected from the left buffer. The beam is characterized by a shifted Maxwellian distribution $f_b\propto \exp (-({\boldsymbol p}-{\boldsymbol p}_b)^2/(2m_eT_b))$ with the temperature $T_b=64$
 keV, average velocity $v_b=0.9$
 directed along the guiding magnetic field, and constant relative density $n_b=0.01$
 . The injected electrons are deleted in the right buffer.
There is a vacuum gap between the right buffer and the boundary of the computational domain, which is necessary for analysing the radiation emerging along the axis of the system. However, due to the small length of the plasma limited by our available computing resources, the region of intense beam oscillations can reach a sharp jump in density near the output buffer, which leads to the generation of non-physical radiation in the longitudinal direction. To minimize this spurious radiation in all simulations, the plasma density near its right edge decreases according to the law

where the modulated density on a homogeneous section is given by the expression

with the modulation depth $\delta n=0.05$ , $k, a, b, d$
 are the constants ($k=0.91$
 , $a=1.93$
 , $b=9.65$
 , $d=1.6$
 ). Here $l_z=114$
 and $2l=71$
 are the longitudinal and transverse sizes of plasma. The large density gradient described by (3.1) is localized in a region with a size $\Delta z \approx 16$
 near the right edge of the plasma, which disrupts the development of the two-stream instability in this place and prevents local generation of $\omega _p$
 -radiation by unstable electrostatic oscillations.
To prevent reflections of radiation from the boundaries of the system, we use absorbing layers (Annenkov et al. Reference Annenkov, Berendeev, Timofeev and Volchok2018). At each time step, the EM fields inside these layers are multiplied by a coefficient that changes from 0 to 1 as they approach the edge of the system.
In the presented simulations, the spatial and temporal steps were chosen equal to ${\textrm {d} x}=\textrm {d}z=0.04$ and $\tau =0.02$
 , and the number of macroparticles of each type (plasma and beam electrons) with a parabolic kernel per cell was 36.
3.2 Efficient regimes of $\omega _p$ -emission

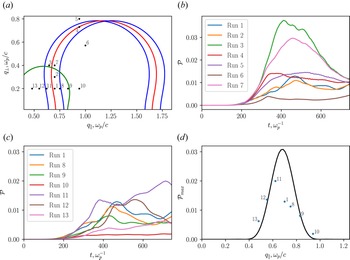
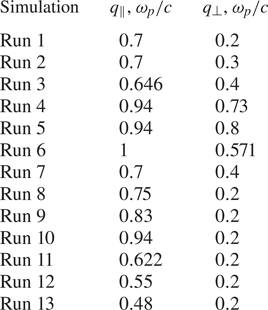
To analyse the efficiency of conversion of the beam power into the power of EM radiation at the plasma frequency, we will carry out PIC simulations in which the beam is injected into a plasma modulated with different wavevectors ${\boldsymbol q}$ covering both resonant and non-resonant conditions. The list of calculations is given in table 1.
To visualize the proximity of each simulation run to the resonances between the first two satellites of the beam-driven wave ${\boldsymbol k}-n{\boldsymbol q}$ ($n=1,2$
 ) and plasma eigenmodes, we show the position of these resonant curves $q_{\bot }=\varkappa _{1,2}/n$
 (or $q_{\|}=(k_b-\kappa _1)/n$
 ) on the plane $(q_{\bot },q_{\|})$
 (figure 4a). Since the amplitude of the wave pumped by the beam is limited in the longitudinal direction (2.29), the line of the Cherenkov resonance $k=k_b$
 is broadened in the $k$
 -space by $Q$
 . From run 1 (figure 5) one can see, that, in the region of the most intense oscillations, the amplitude of the beam-driven wave obtained using Fourier filtering can be approximated by the dependence (2.29) with $L=40$
 ($Q\approx 0.16$
 ). Thus, to illustrate the broadening of the resonance in figure 4(a), in addition to the curve $\varkappa _{1,2}(q_{\|})$
 built for $k_b=1.18$
 , we also plot the same curves for $k_b=1.18\pm Q/2$
 . Note that at the intersection of the green and red curves there is a region in the $q$
 -space where eigenmodes can be excited simultaneously at two resonances $n=1$
 and $n=2$
 .
The power of the radiation emerging from the plasma in PIC simulations: (a) positions of resonances $q_{\|}=(k_b-\kappa _1)/n$ ($q_{\bot }=\varkappa _{1,2}/n$
 ) between the satellites of beam-driven wave and plasma eigenmodes in $q$
 -space (red and green curves are the resonances $n=1$
 and $n=2$
 for $\omega =0.963$
 and $k_b=1.18$
 , blue curves indicate the resonance $n=1$
 for $k_b=1.1$
 and $k_b=1.26$
 , individual points corresponds to simulation runs from table 1); (b,c) EM radiation power in units of beam power measured at the boundaries of the computational domain as a function of time in various runs; (d) maximum relative radiation power achieved in simulations with $q_\perp =0.2$
 (points are results of simulations, black curve is the theoretical power (2.28) calculated for $E_0=0.1$
 and $L=40$
 without taking into account the transformation ratio of natural plasma oscillations at the boundary).

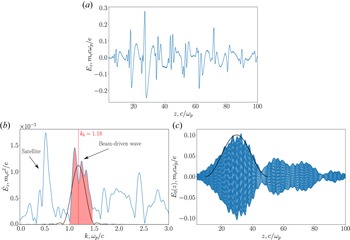
Approximation of the beam-driven wave amplitude: (a) profile of the field $E_z(z)$ at the centre of the plasma at the moment of the most intense $\omega _p$
 -emission; (b) Fourier spectrum of $E_z$
 (highlighted in red is the band corresponding to the wave excited by the beam at the Cherenkov resonance, black curve is the spectrum of the wave with $k_b=1.18$
 and the envelope (2.29) for $L=40$
 and $E_0=0.1$
 ); (c) spatial distribution of the field of the beam wave reconstructed from the selected part of the spectrum in different moments of time during one period of oscillation (black curve is the approximation by the model profile (2.29) for $E_0=0.1$
 and $L=40$
 ).

List of simulation runs with different $q_{\bot }$ and $q_{\|}$
 .

Let us investigate whether generation of $\omega _p$ -radiation becomes more efficient if the simulation runs fall into the obtained resonance band. Figure 4(b,c) show the histories of the radiation power (in units of the beam power) measured in vacuum at the absorbing boundaries of the computational domain. It is seen that all runs lying in the immediate vicinity of the indicated resonances demonstrate a high radiation efficiency $\mathcal {P}\geq 1\,\%$
 . Far from resonances (runs 6 and 10), this efficiency drops by a factor of 3–10. The maximum radiation power at the level $3\,\%$
 –$3.5\,\%$
 of the beam power is achieved in runs 3 and 7 where the plasma eigenmodes are in resonance with two satellites of the beam-driven mode ${\boldsymbol k}-{\boldsymbol q}$
 and ${\boldsymbol k}-2{\boldsymbol q}$
 .
To determine the width of the resonance $q_{\|}=k_b-\kappa _1$ and then quantitatively compare simulation and theoretical results, we will carry out a series of runs with a fixed transverse wavenumber $q_{\bot }=0.2$
 and different $q_{\|}$
 . The relative radiation powers as a function of time in these simulations are shown in figure 4(c). By showing in figure 4(d) only the maximum powers that are attained for each $q_{\|}$
 , we obtain a dependence describing the broadening of the resonance $q_{\|}=k_b-\kappa _1$
 . To obtain a similar dependence in theory, it is necessary to know the amplitude $E_0$
 of the longitudinal wave with ${\boldsymbol k}=(0,0,k_b)$
 driven by the beam via the Cherenkov resonance. In order of magnitude, the level of nonlinear saturation of this amplitude can be estimated by the formula (2.18a,b) ($E_0\approx 0.05$
 for the selected parameters). However, for a more detailed comparison, this value can be obtained from the actual distribution of the field $E_z(z)$
 which is formed by the time of the most intense $\omega _p$
 -emission. In run 1, the longitudinal field profile contains the contributions not only of the wave of interest to us, but also of its satellites (figure 5a). To reconstruct the spatial distribution of $E_z$
 in a beam-driven mode, let us leave only its own contribution in the Fourier spectrum (figure 5b). The envelope (2.29) describes well the most intense part of the relaxation area if the maximum field equals to $E_0=0.1$
 (figure 5c). The radiation efficiency calculated by the formula (2.28) at $T=1$
 is shown in the figure 4(d). It can be seen that, up to the transformation coefficient $T$
 the results of PIC simulations agree with the theory.
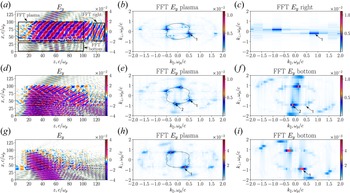
More detailed information on the generation of EM radiation in resonant regimes (runs 1, 3 and 4) is presented in figure 6. From the Fourier spectrum of $E_y$ -field calculated from the plasma volume (figure 6b,e,h), it can be seen that the dominant role in each case is played by the eigenmodes of the plasma falling into resonance with the first ($n=1$
 ) or the second ($n=2$
 ) satellite of the unstable beam wave. When reaching the end of the plasma column or its lateral boundaries, these eigenmodes are transformed into vacuum EM waves with conservation of either $k_{\bot }$
 or $k_{\|}$
 , which is proved by the Fourier spectra calculated from vacuum gaps (figure 6c, f,i). As already noted, run 3 is characterized by the highest radiation efficiency. In this case, figure 6(e, f) show that most of the transversely radiated power is associated with the buildup of the eigenmodes by the second satellite ($n=2$
 ).
Results of PIC simulations for run 1 (a–c), run 3 (d–f) and run 4 (g–i). Maps of electric field $E_y(x,z)$ at time $t=411$
 (a,d,g), spatial Fourier spectra (implemented by the fast Fourier transform (FFT) algorithm) calculated from the plasma volume (b,e,h), $k$
 -spectra calculated from the vacuum gaps indicated on the $E_y$
 map (c, f,i). The numbers indicate the numbers of resonances ($n=1$
 or $n=2$
 ) with the first or second satellite of the beam wave. Black curves in the $k$
 -spectra show the plasma eigenmodes at $\omega =0.963$
 .

3.3 Conversion of a satellite in non-resonant regime
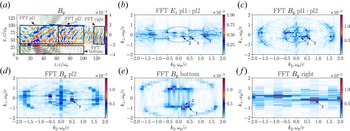
Let us consider run 10 in which the plasma eigenmodes lie far from the satellite ${\boldsymbol k-\boldsymbol q}$ (figure 7). In this case, the $k$
 -spectrum of $B_y$
 calculated from the volume of the plasma column contains not only a strictly longitudinal beam-driven wave (mode 1 in figure 7b) and a mode corresponding to a satellite (mode 2 in figure 7b,c), but also the eigenmode of the magnetized plasma, which has the same transverse wavenumber as the satellite (mode 3). One can see that the Fourier amplitude of mode 3 turns out to be larger than the amplitude of the satellite. This is due to the fact that the satellite can exist only in a relatively compact region of beam relaxation, while the eigenmode emitted from this region by the antenna mechanism fills the whole plasma volume. If the Fourier transform is performed not over the entire volume of the plasma, but only over the part lying downstream of the zone of intense beam pumping, then the peak corresponding to the satellite in the resulting $k$
 -spectrum almost disappears (figure 7d). However, the satellite dominates over the eigenmode locally in the relaxation zone, and it is precisely its conversion at the sharp lateral boundary of the plasma that is responsible for EM emission across the plasma column. It explains why EM waves with the same longitudinal wavenumber as in the satellite dominate in the $k$
 -spectrum calculated from the lower vacuum gap (figure 7e). The longitudinal flux of radiation, in which $k_{\bot }$
 is conserved, is obviously the result of the transformation of an eigenmode on the density gradient existing at the end of the plasma column (figure 7f).
Results of PIC simulations in the non-resonant regime (run 10): (a) map of the magnetic field $B_y(x,z)$ at time $t=411$
 ; (b–f) spectra of the fields $E_z$
 and $B_y$
 calculated from the spatial regions indicated in panel (a). Black curves in panels (b–d) show plasma eigenmodes with the frequency $\omega =0.963$
 , numbers denote: (1) the most unstable beam-driven wave; (2) satellite $\boldsymbol {k}-\boldsymbol {q}$
 ; and (3) plasma eigenmode.

4 Summary
The theory of the beam-driven plasma antenna developed earlier for calculating the radiation power in the process of collective interaction of an electron beam with a density-modulated magnetized plasma is generalized to the case of an arbitrary angle of the modulation vector with respect to the magnetic field. It is shown that, when the long-wavelength satellite of the beam-driven unstable wave gets into resonance with the eigenmodes of the magnetized plasma, the maximum efficiency of the generated $\omega _p$ -radiation is achieved in a plasma whose width turns out to be greater than not only the radiation wavelength, but also the beam relaxation length ($2l\gg L$
 ). Particle-in-cell simulations have shown that, already in the regime of moderate plasma widths $2l\sim L$
 , the power of the radiation escaping from the plasma reaches $1\,\%\unicode{x2013}3\,\%$
 of the injected beam power. The presence of such an effective mechanism in a thick beam-plasma system opens the way to achieving a gigawatt power level of narrow-band EM radiation in the terahertz frequency range.
Acknowledgements
Simulations were performed using the computing resources of the Center for Scientific IT-services ICT SB RAS and ‘Govorun’ supercomputer in JINR.
Editor A.C. Bret thanks the referees for their advice in evaluating this article.
Funding
The work is supported by the Foundation for the Advancement of Theoretical Physics and Mathematics ‘BASIS’.
Declaration of interests
The authors report no conflict of interest.
Appendix A
The constants $C_i$ are determined from the conditions of continuity of the fields $E_y$
 , $E_z$
 , $B_y$
 and $B_z$
 at the plasma–vacuum interfaces $x=\mp l$
 :


The EM waves in vacuum with transverse electric and transverse magnetic polarization propagating against the direction of motion of the satellite $(\omega,{\boldsymbol k}-{\boldsymbol q})$ have the following amplitudes:


The amplitudes of vacuum EM waves copropagating with the satellite are determined by the expressions


In the case of $q_{\bot }\neq \varkappa _1\neq \varkappa _2$ , the fields of the long-wavelength satellite in the plasma are represented as


In the case of resonance $q_{\bot }=\varkappa _1$ , these fields can be represented in the form