


INTRODUCTION
Exotic fish introductions are frequent in freshwater ecosystems, and in many cases, introduced fishes have had adverse effects on native species (Vitule et al. Reference Vitule, Freire and Simberloff2009; Cucherousset and Olden, Reference Cucherousset and Olden2011). In Europe, one of the most successful introduced fishes is the pumpkinseed (Lepomis gibbosus). Native to eastern and central North America, the species was first introduced into European waters in the late 1890s, and is now established in 28 European countries (Copp and Fox, Reference Copp, Fox and Gherardi2007). The pumpkinseed is considered to be invasive in several southern and central European locations (Copp et al. Reference Copp, Fox, Przybylski, Godinho and Vila-Gispert2004), and it is classified as a ‘species likely to cause biological imbalances’ in France (Pascal et al. Reference Pascal, Lorvelec and Vigne2006).
In its native geographical range in North America, at least 129 parasite taxa have been recorded infecting the pumpkinseed (Hoffman, Reference Hoffman1999). Among them, Triaenophorus nodulosus (Pallas, 1781) is a cestode that has a complex life cycle with three potential hosts. The first intermediate host, always a copepod and mainly a species from the genus Cyclops (Kuperman and Smirnova, Reference Kuperman and Smirnova1970; Kuperman, Reference Kuperman1973; Stromberg and Crites, Reference Stromberg and Crites1974; Pasternak et al. Reference Pasternak, Pulkkinen, Mikheev, Hasu and Valtonen1999; Lahnsteiner et al. Reference Lahnsteiner, Kletzl and Weismann2009) is infected by consuming coracidium, the free swimming stage (ciliated larva) of T. nodulosus. Subsequently, the infected copepods are eaten by fish (the second intermediate host) and procercoid T. nodulosus perforate the fish intestine and develop into the plerocercoid stage, mainly in fish liver, where it becomes encapsulated by a host tissue response. The only known final host is the northern pike (Esox lucius) (Kuperman, Reference Kuperman1973). When infected fish are eaten by northern pike, the plerocercoids leave the tissue of the second intermediate host and develop into an adult tapeworm in the pike intestine. Eggs are released by the infected northern pike that develop into free swimming coracidian larvae (Kuperman, Reference Kuperman1973).
The geographic distribution of the tapeworm T. nodulosus is circumpolar (Kuperman, Reference Kuperman1973) and more than 60 fish species have been described as possible second intermediate hosts (Kuperman, Reference Kuperman1973). The Eurasian perch, Perca fluviatilis, is the most suitable second intermediate host for T. nodulosus (Kuperman, Reference Kuperman1973). The pumpkinseed is known as an intermediate host both in its native North American distribution (Kuperman, Reference Kuperman1973), and in its introduced range (Brinker and Hamers, Reference Brinker and Hamers2000: Germany, Kuchta et al. Reference Kuchta, Vlčková, Poddubnaya, Gustinelli, Dzika and Scholz2007; Košuthová et al. Reference Košuthová, Koščo, Letková, Košuth and Manko2009: Slovakia).
We report here for the first time, data on the occurrence of plerocercoids of the cestode T. nodulosus in sympatric populations of pumpkinseed and Eurasian perch. In species of Triaenophorus, the plerocercoid stage is the most pathogenic form of the parasite, and T. nodulosus is considered to be the most pathogenic species of this genus (Kuperman, Reference Kuperman1973).
In this study, we compare T. nodulosus infection in a native (Eurasian perch) and an introduced (pumpkinseed) piscine host in different types of aquatic ecosystems, and we also compare the effects of the parasite on body condition and reproductive allocation of the two species. The two species are competitors in Europe (Fobert et al. Reference Fobert, Fox, Ridgway and Copp2011), and the pumpkinseed has been demonstrated to adversely affect the growth of the yellow perch (Perca flavescens), a congener of the Eurasian perch, in North America (Hansen and Leggett, Reference Hansen and Leggett1985). We investigated in particular (1) if pumpkinseed would be more infected in water bodies containing northern pike, the final host of the parasite and (2) if the parasite reduces fitness of this introduced fish species.
MATERIALS AND METHODS
Study area
Sampling sites were selected along the Moselle River catchment according to their connectivity with the river. The headwaters of the Moselle River originate in the Vosges Mountains region (vicinity of Bussang, altitude 731 m), and the river flows north for 545 km through France, Luxembourg and Germany to its mouth in the River Rhine (Fig. 1). The hydrological regime of the river is driven mainly by the amount and timing of rainfall received in the catchment, as the contribution of snowmelt is minimal (Garnier et al. Reference Garnier, Billen and Palfner1999).
Map of the Moselle River basin, France, with the 17 study sites indicated by numbers (see Tables 1 and 2) and sampled between 2009 and 2011. 1: Saulxures/Moselotte Pond; 2: St-Nabord Pond; 3: Châtel/Moselle Pond; 4: Chamagne Pond; 5: Flavigny/Moselle Pond; 6 and 7: Pont-à-Mousson backwater and Pond; 8: Jouy Canal; 9: Metz Chanel; 10 and11: La Maxe Canal and Pond; 12: Argancy Pond; 13: Mondelange Pond; 14: Moselle River at Uckange; 15: Mirgenbach Reservoir; 16: Sentzich Pond; 17: Berg/Moselle backwater.

Seventeen sites covering most of the north–south range of the French portion of the Moselle River catchment were selected for this study. Four of these sites were located on the river Moselle (Site 17 on Fig. 1), and its side channels (subsequently referred to as ‘connected’ sites). One of them, the Canal La Maxe (Site 10), is directly connected to the Moselle River and receives heated effluent from a power plant. The second site at La Maxe (Site 11) is one of the ten gravel pit ponds adjacent to the river, filled with groundwater and managed for recreation. The gravel pit ponds are not connected to the Moselle. These sites were mined before 1980 (Basias data, BRGM), and have since been rehabilitated, colonized by fish through either natural vectors such as waterbirds and river overflow during flooding, or by angler introductions. The ponds vary in surface area from 0·1 to 20·3 ha, and with the exception of the most upstream site (Saulxures, Site 1), mean depths were always <4 m (Tables 1 and 2). The Mirgenbach Reservoir (Site 15) is located several kilometres from the Moselle Valley and receives a constant discharge of heated water (5 m3 s−1) from the Cattenom Nuclear Power Station. Two other sites have limited connection with the Moselle River (subsequently referred to as ‘semi-connected’ sites). The Pont-à-Mousson backwater (Site 6) has a 4 m wide downstream connection and no upstream connection with the River Moselle. The Canal de Jouy (Site 8) is 6 m wide, >10 km in length and has no downstream connection with the River Moselle.
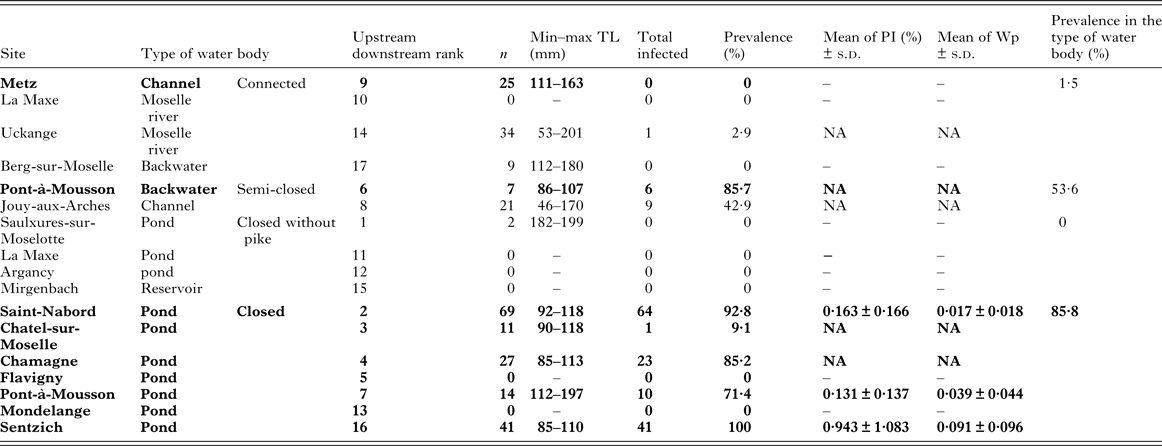
Distribution of perch Perca fluviatilis in the 17 sampling sites along the Moselle River basin. Fish number (n), minimum and maximum total length (min–max TL), prevalence, mean PI and mean total weight of parasites (Wp). The location of study sites is given in Fig. 1, with sites numbered in order of their upstream–downstream position. ‘Connected’ sites are locations over water. ‘Semi-closed’ water bodies are only weakly connected with the Moselle River downstream (Pont-à-Mousson) or upstream (Jouy-aux-Arches). ‘Closed’ water bodies are gravel pit ponds disconnected from the river and filled with backwater. A ‘backwater’ is a section of the Moselle River that lies alongside the main channel and is not navigable, whereas a ‘channel’ is a navigable section alongside the river

Lines in bold indicate sampling sites with pike present. NA: information not available.
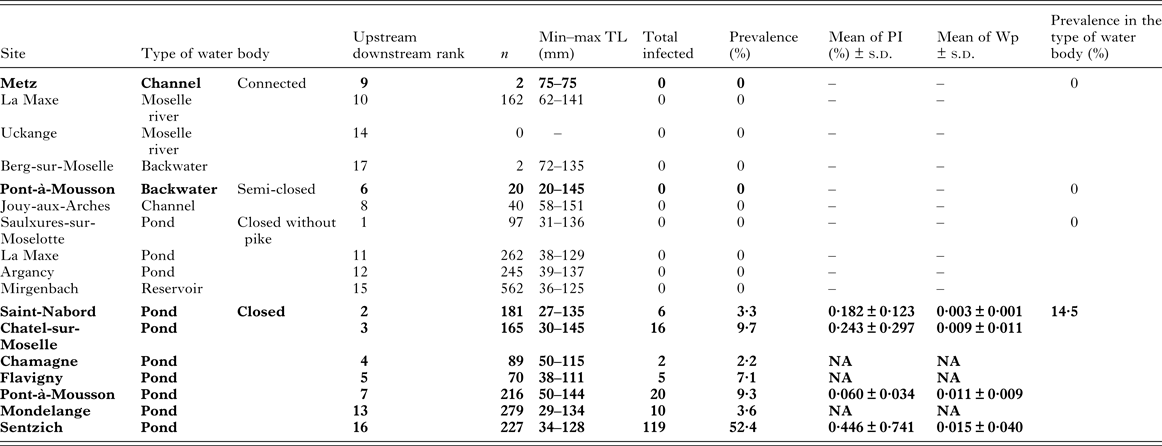
Distribution of pumpkinseed L. gibbosus in the 17 sampling sites along the Moselle River basin. Number of fish sampled (n), minimum and maximum total length (min–max TL), prevalence, mean PI and mean total weight of parasites (Wp). Definitions of water body type are given in Table 1.

Lines in bold indicate sampling sites with a pike population. NA: information not available.
All study sites were characterized by the presence of vegetated areas with clear water that favours the presence of northern pike. The presence or absence of pike in the sampled sites was assessed from data previously collected by the Office National de l'Eau et des Milieux Aquatiques, and/or observed during the fishing period and confirmed by angling associations that permitted us access to their fishing areas.
Fish sampling
Eurasian perch and pumpkinseed were sampled at the end of spring and early summer between 2009 and 2011 (Fig. 1). A total of 2599 pumpkinseed and 251 perch were collected by electrofishing. Beach seines and fyke nets were also used to sample these species in the Sentzich gravel pit. After sampling, fish were transported live to the laboratory and euthanized by an overdose of carbon dioxide and transection of the spinal cord. They were immediately dissected or frozen at −20 °C for later processing. Total length (TL) and total wet weight (TW) of each fish were measured to the nearest millimetre and centigram, respectively. Gonads, liver and digestive tract were removed from the fish to be weighed to the nearest mg, and sex and maturity were identified by visual inspection. Maturity was assessed in female pumpkinseed using the colour and appearance of the ovary and the presence or absence of yolk granules as per Burns (Reference Burns1976). A female was classified as immature when the ovary was translucent or pink and not well developed, and mature when the ovary was yellowish or orange, with veins and yolk granules visible under a binocular microscope. For males, maturity was also determined macroscopically during dissections: immature individuals have spermiducts barely visible and not developed or separated spermiducts yellow in colour, whereas in mature individuals spermiducts are swollen with a milky white colour (Craig, Reference Craig1987).
Data analysis
The prevalence (percentage of infected fish) of T. nodulosus in each species was calculated for each site. To determine whether body size was a factor influencing the degree of parasitism of each species, the sampled individuals from each species were pooled and divided into 10 mm TL categories. Log-likelihood chi-square statistics were computed for the number of infected and uninfected individuals after first combining size categories into 40 mm bins. To evaluate the effect of parasite mass, we calculated a parasitism index (PI) as per Arme (Reference Arme1968) and Vanacker et al. (Reference Vanacker, Masson and Beisel2012): PI = Wp × 100/TW where Wp is the mass of T. nodulosus in the fish, and TW is the total mass of the fish.
To investigate the reproductive or physiological impact of the parasite on the pumpkinseed, we used data from the Sentzich gravel pit pond, the site that had the highest infection rate (Table 2, n = 227 sampled fish; 119 infected with T. nodulosus). According to Chubb (Reference Chubb1964) and Lahnsteiner et al. (Reference Lahnsteiner, Kletzl and Weismann2009), the development of the parasite is seasonally limited to approximately 1 month in copepods, and developed plerocercoids are generally present in fish between March and June. For this reason, we used only data collected during this interval for this part of our study. During the same field collection, 41 Eurasian perch were sampled, but all were infected and we observed a high prevalence in samples collected elsewhere too. Consequently, we compared pumpkinseed collected in Sentzich with Eurasian perch collected in all study sites to assess the physiological impact of T. nodulosus between infected and uninfected perch and between the two species (Table 1, n = 260; 155 infected). For these comparisons, we calculated a hepatosomatic index (HSI), a gonadosomatic index (GSI), and a condition index (CI). HSI and GSI were calculated as follows: HSI = (LW−Wp) × 100/TW and GSI = GW × 100/TW, where LW is the liver mass and GW is the gonad mass (Delahunty and de Vlaming, Reference Delahunty and de Vlaming1980). The liver of a fish infected by T. nodulosus was first weighed with parasites and cysts, and then the parasites were removed and the fish reweighed to obtain the weight of the liver alone (LW−Wp). Fulton's CI was calculated using the following equation (Le Cren, Reference Le Cren1951): CI = TW × 100/TLb where the constant b was determined for the both species from the relationship TW = a × TLb.
We used an information theoretic approach (Burnham and Anderson, Reference Burnham and Anderson2002) to investigate biotic and abiotic factors that could best explain the variation in prevalence of the T. nodulosus infection in each species across study sites. The biotic factors considered were the means by site of body length, body mass, HSI, CI and GSI. Surface area, mean depth and maximum depth were used as the continuous abiotic variables in the analysis, and pike presence (presence/absence), connectivity (four levels), extent of vegetation cover (four levels) were considered as ordinal variables. Length and mass were assessed in separate models to avoid problems with co-linearity, as were mean and maximum water depth. Length and mass were the only biotic variables tested on perch, as HIS, CI and GSI were unavailable. Two-way interaction terms were tested only when the main factors produced models with strong support, and when the interactions were biologically relevant. Prevalence in both species was loge (1+x) – transformed prior to model testing to correct for non-normality.
Models were evaluated with Akaike's information criterion corrected for small sample bias (AICc); the best model for each dependent variable was considered to be that with the lowest AICc. Models with an AICc difference (Δi) < 2 from the best model were considered to have strong support, whereas those with 2 < ΔI < 4 were considered to have moderate support (Burnham and Anderson, Reference Burnham and Anderson2002).
To test for potential differences between infected and uninfected individuals, HSI, GSI and CI were arcsine-transformed and assessed with two-way analysis of variance (ANOVA) (infection status × sex) for both species, followed by Tukey's HSD post-hoc tests. This approach was also used to test for differences in PI between species and sex. Correlation analyses were used to test for associations between the mass of parasite (Wp) and the body length of its host using individuals collected from Sentzich only. All tests were performed with Statistica 7.0 software (Statsoft Inc., Tulsa, USA) or JMP 10 software (SAS Institute Inc., Cary, North Carolina, USA), with the level of statistical significance set as P < 0·05.
RESULTS
Infected pumpkinseed or Eurasian perch were only collected in semi-closed and closed sites (Tables 1 and 2), with the exception of a single Eurasian perch sampled in the Moselle River (Table 1). In sites where northern pike were known to be present, the percentage of perch infected with T. nodulosus averaged 79% in semi-connected sites and 86% in ponds. In contrast, 99% of the Eurasian perch sampled in connected sites were not infected (Table 1). In the case of pumpkinseed, no infected individual was found in any of the connected or semi-connected sites (Table 2). However, some pumpkinseed were infected in all of the ponds where pike were present (mean prevalence of 15%). Even in these cases, the percentage of infected pumpkinseed was low (between 2 and 10%, except in Sentzich Pond, where 52% of pumpkinseed were infected).
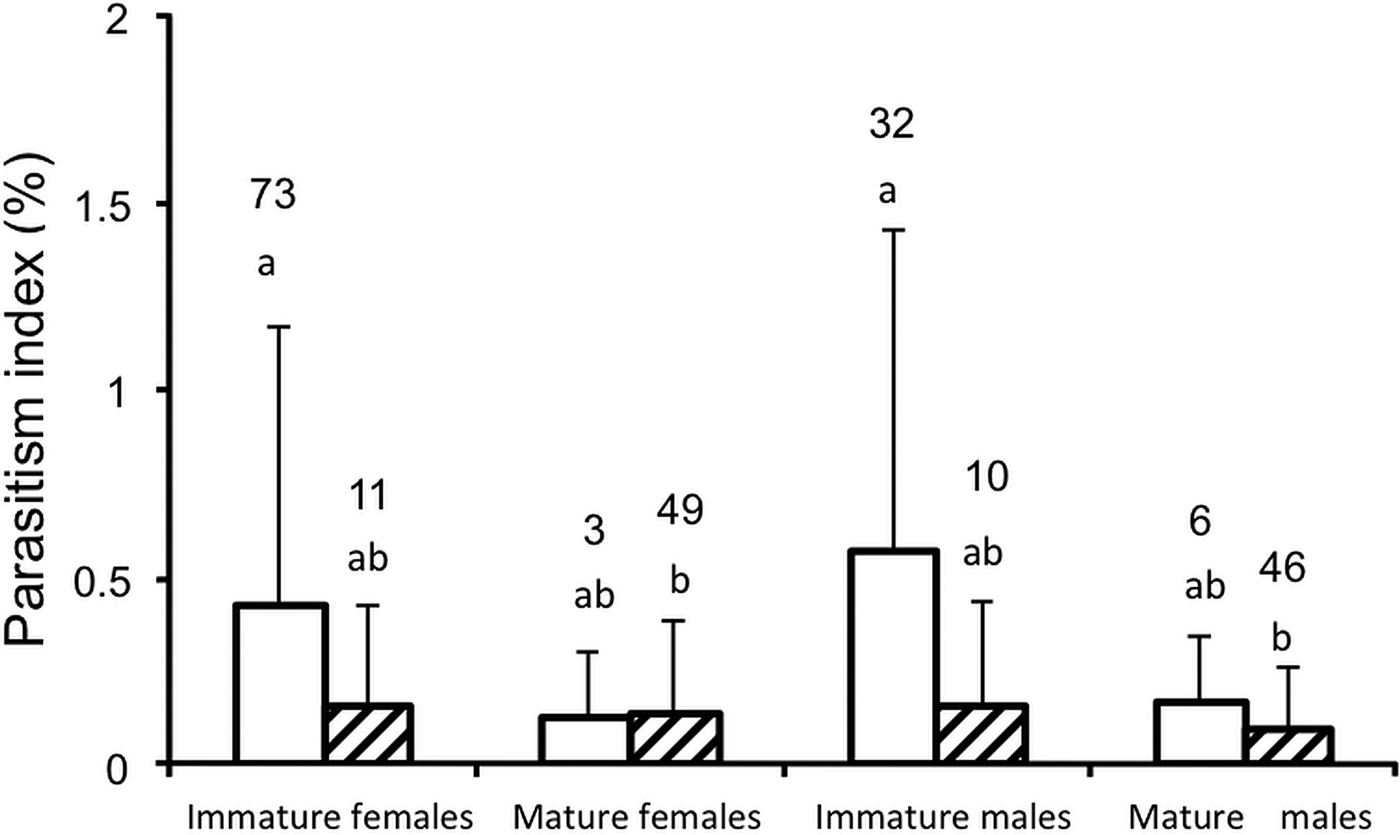
The prevalence of T. nodulosus was higher in Eurasian perch than in pumpkinseed at every site except the Châtel-sur-Moselle Pond (9·7% in pumpkinseed and 9·1% in perch; Tables 1 and 2). Although both Wp and PI values were higher, on average, in Eurasian perch than in pumpkinseed, there was no significant difference between the two species (Fig. 2, P = 0·368 for PI).
Length distribution of infected (black bars) and uninfected (white bars) Eurasian perch (A) and pumpkinseed (B) sites where the parasite Triaenophorus nodulosus was found in one or both of the species. Data shown are pooled across sites.

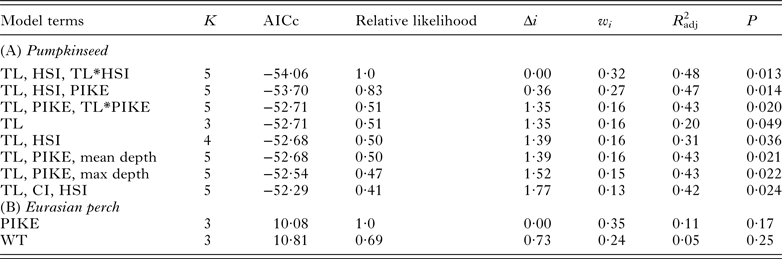
The strongest models for predicting the prevalence of T. nodulosus in sites containing pumpkinseed included body length, HSI, the presence or absence of pike and water depth (Table 3). Prevalence of the parasite decreased with mean pumpkinseed length, and increased in the presence of pike and with mean HSI. While mean and maximum depths were factors in two of the strong models, this factor was weak and unstable in these models (s.e. > coefficient). In the highest ranked model, body length, HSI and their interaction accounted for 47% of the variation in the prevalence of T. nodulosus in study sites. In general, mean length of pumpkinseed was a better predictor of prevalence than mean mass, and neither mean GSI, level of connectivity nor extent of vegetation cover was a factor in any of the models with strong support.
Model selection results from an analysis of the influence of biotic and abiotic variables on the prevalence of T. nodulosus (log e (x + 1)-transformed) in (A) pumpkinseed and (B) Eurasian perch. The biotic variables for pumpkinseed are the site means of TL, body mass (m), HSI, GSI and CI; the abiotic variables are surface area, mean depth, maximum depth, presence or absence of pike (PIKE), degree of connectivity and extent of vegetation cover. Variables are the same for Eurasian perch, less HSI, GSI and CI, as these data were not available. Candidate models are ranked by the Akaike information criterion corrected for small sample size (AICc), with the differences between models shown as Δi. The models displayed are those classified as strong (Δi ≤ 2). Also shown for each model are the number of model parameters (K), relative likelihood, Akaike weight (w i ), and proportion of variation explained by the model, adjusted for the number of variables (R 2), and the probability of significance for the model (P)

The strongest models for predicting the prevalence of T. nodulosus in sites containing Eurasian perch contained either the presence or absence of pike, or the mean weight of perch as independent variables. However, even the strongest models for predicting prevalence of the parasite in Eurasian perch were weak (lower R 2) relative to the models for predicting prevalence in pumpkinseed.
When individuals were pooled across sites, the percentage of fish parasitized was also shown to be size-dependent in both species (likelihood ratio tests, P < 0·001 for Eurasian perch; P = 0·010 for pumpkinseed). Eurasian perch 80–110 mm TL showed the highest rates of infection, and lower infection rates were observed in the smallest perch (<80 mm) and in individuals larger than 160 mm (Fig. 3A). The highest infection rates in pumpkinseed occurred in individuals <80 mm TL (Fig. 3B). Overall, the mass of parasites carried by the fish showed a weak but significant negative relationship with body length in both species (Sentzich Pond: Eurasian perch Rs = −0·31, P = 0·047, n = 122; pumpkinseed Rs = −0·19, P = 0·016, n = 165).
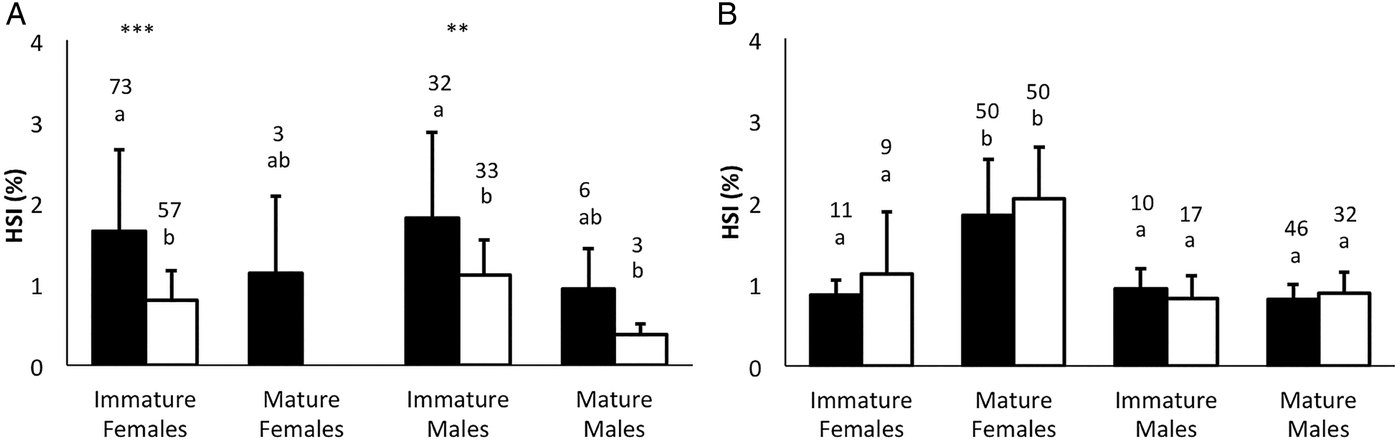
Mean Heptosomatic Index (HSI, %) values (with SD) according to gender, maturity stage and species for Eurasian perch (A) and pumpkinseed (B). Black bars correspond to infected fish, and white bars to uninfected fish. Numbers above histograms refer to the sample size. Different letters above the bars denote significantly different values (Tukey's HSD test, P < 0.05). Asterisks show significant differences between uninfected and infected fish of the same sex and maturity status (** P < 0.01, ***P < 0.001).

Very few mature Eurasian perch were collected because samples were taken after their breeding season. Therefore, no comparisons of HSI, CI or GSI could be made between infected and uninfected mature perch. HSI in infected immature perch was significantly higher than in mature perch of both sexes (males: P = 0·008; females: P < 0·001; Fig. 4).
Mean Parasitism Index (PI, %) values (with SD) by gender, maturity stage and species for Eurasian perch (white bars) and pumpkinseed (hatched bars). Numbers above histograms refer to the sample size. Different letters above the bars denote significantly different values (Tukey's HSD, P > 0.05 in all cases).

In pumpkinseed, no significant differences in HSI were found between infected and uninfected individuals of either sex. No significant differences between infected and uninfected individuals were observed in CI or GSI of either species; this was the case in mature and immature individuals of both sexes (Table 4).
Mean GSI ± s.d. and CI between genders, maturity stage, for individual Eurasian perch and pumpkinseed infected and uninfected with T. nodulosus. P-values were obtained with a two-way ANOVA

DISCUSSION
Occurrence and prevalence of the parasite
Infected pumpkinseed was found in all of the seven ponds studied (mean prevalence of 15%), systems where the northern pike, the final host of T. nodulosus, is present. Nevertheless, the proportion of pumpkinseed containing T. nodulosus was low in six of the ponds (2–10%), and was only high (52%) in the one pond where all sampled Eurasian perch were found to be infected. Košuthová et al. (Reference Košuthová, Koščo, Letková, Košuth and Manko2009) found a maximum prevalence of the cestode in pumpkinseed of 35% in an oxbow of the Tissa River, Slovakia. In our study, no infected pumpkinseed was found in any of the connected or semi-connected water bodies sampled, despite the presence of pike and perch.
Native Eurasian perch were frequently infected by T. nodulosus, with 79% of individuals infected on average in semi-connected water bodies and 86% in closed water bodies. Only one infected perch was found in a connected site, and no infected pumpkinseed was found in any of the connected sites sampled. The Eurasian perch is known to be one of the major second intermediate hosts for T. nodulosus (Kuperman, Reference Kuperman1973) and infection occurs most frequently in stagnant waters and in small reservoirs (Kuperman and Smirnova, Reference Kuperman and Smirnova1970). Such waters are abundant in the Moselle watershed, which supports over 10 000 ha of ponds, gravel pits, channels and reservoirs. These systems produce the copepods necessary for the life cycle of the parasite. If the pike is present, the co-occurrence of perch and pumpkinseed could undoubtedly favour the presence of the parasite in confined environments.
The transmission of parasites from non-native to native fish, and also the reverse, from native to non-native species, may facilitate parasite dispersion (Košuthová et al. Reference Košuthová, Koščo, Letková, Košuth and Manko2009). Thus, the infection of T. nodulosus in a non-native pumpkinseed population may facilitate the transmission to the final host, considering that pumpkinseed is known as a major prey for the northern pike in Europe (Guti et al. 1991in Brinker and Hamers, Reference Brinker and Hamers2000). However, there is no definitive evidence that the transmission of T. nodulosus can occur from pumpkinseed to pike in Europe (Brinker and Hamers, Reference Brinker and Hamers2000).
In Europe, few studies have reported parasites from pumpkinseed but overall, 21 parasite species have been found in this exotic species (Piasecki and Falandysz, Reference Piasecki and Falandysz1994; Brinker and Hamers, Reference Brinker and Hamers2000; Sterud and Jorgensen, Reference Sterud and Jorgensen2006; Kuchta et al. Reference Kuchta, Vlčková, Poddubnaya, Gustinelli, Dzika and Scholz2007; Pilecka-Rapacz and Sobecka, Reference Pilecka-Rapacz and Sobecka2008; Košuthová et al. Reference Košuthová, Koščo, Letková, Košuth and Manko2009; Hockley et al. Reference Hockley, Williams, Reading, Taylor and Cable2011; Djikanović et al. Reference Djikanović, Paunović, Nikolic, Simonović and Cakić2012). Only two cestodes were observed: Proteocephalus percae infecting the intestine of pumpkinseed (Košuthová et al. Reference Košuthová, Koščo, Letková, Košuth and Manko2009), and T. nodulosus in the liver (Brinker and Hamers, Reference Brinker and Hamers2000; Kuchta et al. Reference Kuchta, Vlčková, Poddubnaya, Gustinelli, Dzika and Scholz2007; Košuthová et al. Reference Košuthová, Koščo, Letková, Košuth and Manko2009). Both are naturally present in Europe, and this study constitutes the first report of non-native pumpkinseed in France infected with the tapeworm T. nodulosus.
Size-dependence of the infection
Several authors have demonstrated that the size of Eurasian perch did not significantly affect its susceptibility to infection by T. nodulosus (Chubb, Reference Chubb1964; Balling and Pfeiffer, Reference Balling and Pfeiffer1997). In the aforementioned studies, old and young perch had the same probability of consuming an infected copepod because no food competition occurred between young and old fish (Hartman and Nümman, 1977 in Balling and Pfeiffer, Reference Balling and Pfeiffer1997). In our study, we found that the infection rate differed among size classes of perch, with the highest infection rate occurring in individuals between 80 and 110 mm TL. Infection rates decreased in larger perch, a pattern also observed by Shaw et al. (Reference Shaw, Grenfell and Dobson1998). One possible explanation is that perch are more susceptible to be infected by T. nodulosus in small sizes because younger individuals are more planctonophagous, making them more prone to contract a parasite. The dearth of larger infected perch may be due to high mortality of infected individuals. This, in turn could be due to the infection making young perch more susceptible to predators, as parasites with complex life cycles often modify the behaviour and/or the appearance of their intermediate hosts in ways that appear to increase trophic transmission to final hosts (Moore, Reference Moore2002). Young, uninfected individuals that survive to an older age consume little or no plankton at that stage, and thus have a lower probability of becoming infected with T. nodulosus.
While pumpkinseed also showed size-related differences in infection rate, these rates were more even across size classes than was the case with perch. High infection rates occurred in small pumpkinseed (42% in the 30 mm size class), and also in large individuals (50% in the 140 mm size class). In contrast, Brinker and Hamers (Reference Brinker and Hamers2000) found only one pumpkinseed over 90 mm infected with T. nodulosus. The lack of an increase in infection rate with size in both species could also be due to an ontogenetic change in feeding regime, with consumption of zooplankton decreasing with age (e.g., Keast, Reference Keast1978).
No strong significant relationship was found between fish length and parasite weight in pumpkinseed or Eurasian perch. Chubb (Reference Keast1964) found no tendency for older perch to be more infected by this parasite. In Upper Lake Constance, Brinker and Hamers (Reference Brinker and Hamers2007) found in young perch up to the age of 700 days larger perch to be more infected than smaller one, presumably because larger fish consumed more plankton and thus have a greater risk of infection. In comparison, older pike in Lake Constance were potentially more susceptible to infection by T. nodulosus than younger pike due to the fact that the oldest pike eat larger fish such as perch, which is the principal intermediate host of the parasite. In contrast, the youngest pike ate mainly cyprinids and loach, which are the only potential hosts (Shaw et al. Reference Shaw, Grenfell and Dobson1998). A relationship between body size and level of infection (mean abundance, prevalence and parasite load per fish) has also been observed in whitefish, Coregonus lavaretus, (Pulkkinen and Valtonen, Reference Pulkkinen and Valtonen1999), and white bass, Morone chrysops (Stromberg and Crites, Reference Stromberg and Crites1974), where older zooplanktivorous fish were the most infected.
Pathogenicity of the parasite
The plerocercoid stage of T. nodulosus is its most pathogenic form (Kuperman and Smirnova, Reference Kuperman and Smirnova1970) causing inflammation, atrophy, necrosis, hyperaemia and haemorrhage, and dropsy in the liver (Kuperman, Reference Kuperman1973). Plerocercoids can be pathogenic for fish, and heavy infections may even result in mortality of young trout, perch or other heavily infected species (Kuperman and Smirnova, Reference Kuperman and Smirnova1970). We observed that several perch and pumpkinseed were heavily parasitized by the plerocercoid, and the most parasitized were found in perch, with four individuals reaching a PI > 2%, including one female of 92 mm with a PI of 5·6%. During its life cycle, the parasite may be sufficiently transmitted to the final host if only a few host specimens become heavily infected (Balling and Pfeiffer, Reference Balling and Pfeiffer1997; Brinker and Hamers, Reference Brinker and Hamers2007). If only a small part of the intermediate host population weaken from the parasite load, they constitute easy prey for pike, and thus assist in its further transmission (Balling and Pfeiffer, Reference Balling and Pfeiffer1997). In contrast to Eurasian perch, only one pumpkinseed had a PI > 1%, despite there being no significant difference in PI between the two fish species. For the final host, T. nodulosus is less pathogenic in that it does not cause the death of pike even at a very high intensity (up to 200 individuals per host) (Izvekova and Solovyev, Reference Izvekova and Solovyev2012).
As previously noted, few mature perch were collected because they breed earlier in the year than the pumpkinseed. Despite the small size of this sample, no significant differences in biological parameters, HSI, GSI and CI, were observed between mature and immature perch. In immature perch, HSI was significantly different between infected and uninfected fish, showing that the liver mass grew despite the presence of plerocercoids. In contrast, HSI was not significantly different between infected and uninfected pumpkinseed. In the latter species, T. nodulosus plerocercoids frequently were deformed, discoloured and had incompletely developed hooks (Brinker and Hamers, Reference Brinker and Hamers2007); these deficiencies were not observed by these authors in perch. These results suggest that pumpkinseed react more strongly than perch to T. nodulosus, and may therefore be more able to resist the infection. Plerocercoids are encapsulated into cysts in the fish liver produced by the host in order to establish a relative physiological equilibrium between host and parasite. In some livers, plerocercoids create macroscopic tunnels that increase with their size (Brinker and Hamers, Reference Brinker and Hamers2007). We observed that pumpkinseed produced fewer cysts than perch, and the cysts were thinner and weaker.
Finally, we were unable to demonstrate a significant effect of T. nodulosus on the GSI of either species, which suggests that plerocercoids do not affect the sexual development of its host. In our study, T. nodulosus also had no significant effect on CI, suggesting that the growth of plerocercoids have no impact on host health. This is consistent with other studies where plerocercoids do not affect the size of the body and the weight of their host (Kuperman and Smirnova, Reference Kuperman and Smirnova1970). We conclude that T. nodulosus is not strongly pathogenic in either species, likely because it would adversely affect its own life cycle if it strongly weakened, castrated or killed its host (Krone, Reference Krone2007).
ACKNOWLEDGEMENTS
The authors thank Electricité de France and all of the angling associations that provided access to their reservoirs and ponds, as well as ONEMA (Délégation Régionale 3; Champagne-Ardennes-Lorraine-Alsace and the individuals of local districts: 54, 57 and 88) for technical support (electrofishing), which made this study possible. E. Valente, A. Pedon, N. Dubost and P. Wagner provided technical support in the field, and E. Valente assisted in the processing of fish samples. J.N. Beisel is grateful to the National University Council (CNU 67) for supporting a sabbatical through CRCT-2013.
FINANCIAL SUPPORT
The study was funded by the ONEMA (Office National de l'Eau et des Milieux Aquatiques).