I. INTRODUCTION
Interest in the structure and properties of nanoparticles continues to exist in the materials-science community. This interest is being driven by the promise of novel materials and their properties that are composed of these nanosized particles. These are findings used in a variety of applications such as coatings, paints, cosmetics, ceramics, polymers, catalysis, and drug delivery. There is therefore a strong requirement for the facile and accurate characterization of nanoparticles. X-ray diffraction (XRD) is one of the most powerful non-destructive methods to identify and quantify the crystalline phases present in a powder sample. Normally crystallite size and/or microstrain information are derived from Bragg diffraction peaks by studying peak broadening (Balzar et al., Reference Balzar, Audebrand, Daymond, Fitch, Hewat, Langford, Le Bail, Louër, Masson, McCowan, Popa, Stephens and Toby2004). However, when crystallite size falls below a certain limit, conventional methods, such as structural modeling of powder-diffraction patterns with the Rietveld method (Rietveld, Reference Rietveld1969), start to lose accuracy because of severe peak broadening and consequent peak overlap. For example, overestimated cell parameters are determined by Rietveld refinement for nano-anatase, with particle sizes about 4 nm and below, owing to the presence of titanium vacancies (Grey and Wilson, Reference Grey and Wilson2007). As a result, a new definition has recently been made: ultrasmall nanoparticles (USNPs) with dimensions equal or less than 3 nm, which have unique physical and chemical properties (catalytic activity, fluorescence, etc.) because of the large surface area and the predominance of surface atoms (Kim et al., Reference Kim, Hackett, Park and Hyeon2014).
The characterization of this type of samples becomes increasingly challenging at decreasing particle-size because of the reduction in structural coherence of the diffraction domains. One approach that can be applied is to combine complementary techniques, some that are found on a single multipurpose X-ray platform. The adopted techniques and the corresponding extracted information are: (1) small-angle X-ray scattering (SAXS), for particle-size distribution and specific surface area (SSA); (2) XRD, for phase identification, quantification, and crystallite size; (3) in situ heating XRD experiments to determine thermal properties; and (4) total scattering for pair-distribution function (PDF) analysis of the short- and long-range structural order.
SAXS probes the electron-density distribution typically in the range from 1 to 100 nm, and is then ideally suited for the characterization of nanoparticles. The PDF provides the probability of finding atoms separated by a certain distance. PDF analysis requires the use of total-scattering data, which takes into account both Bragg and diffuse scattering. Data collection to high scattering-vector, Q (where Q = 4π sin θ/λ, θ is the diffraction angle, and λ is the wavelength), is needed for the PDF analysis of total-scattering data. This is achieved on laboratory systems by measuring to the highest 2θ angle with Mo and Ag tubes, which allow Q max of 17.1 and 21.7 Å−1, respectively (Reiss et al., Reference Reiss, Kharchenko and Gateshki2012), to be reached. The PDF method had initially been developed to characterize the local structure of liquids and glasses, and is now also applied to disordered crystalline structures, nanosized, and amorphous materials (Egami and Billinge, Reference Egami and Billinge2012).
Such a multi-technique approach on an in-house diffractometer has been described by Sommariva (Reference Sommariva2013) for the characterization of TiO2 nanoparticles with dimensions ranging from 7 to 10 nm. These materials had been similarly characterized by the techniques mentioned above, with the addition of in situ variable-temperature SAXS and high-temperature PDF. The current paper reports the investigation of the structural properties of a similar class of materials, but with the analysis of more challenging dimensions to the lower limit of 1 nm (USNPs), where standard powder diffraction is of limited use. Since both SAXS and PDF are techniques that interpret scattering data, their sensitivity is not restricted to the lattice periodicity and can be exploited to their full benefit in this setting. At the lowest particle-size dimensions, it is important to validate the results obtained from X-ray scattering techniques. To this end, high-resolution transmission electron microscopy (TEM) has been used to validate the size distribution obtained by SAXS data, and also to obtain complementary information, like the elemental analysis of the samples, using energy-dispersive X-ray (EDX) analysis.
II. EXPERIMENTAL
A. Samples
Two TiO2 nanopowders were purchased from PlasmaChem GmbH: sample 1, with nominal composition of rutile and particle size of 2 ± 1 nm, and sample 2, with nominal composition of anatase and particle size of 6 ± 2 nm. Sample 1 was measured as-received and also after ex situ heating at 120 °C in a furnace for 4 h. The samples appeared worth studying because of their property to be easily dispersed in water, which is normally not the case for such small nanoparticles.
B. Sample preparation, data collection, and analysis
1. SAXS
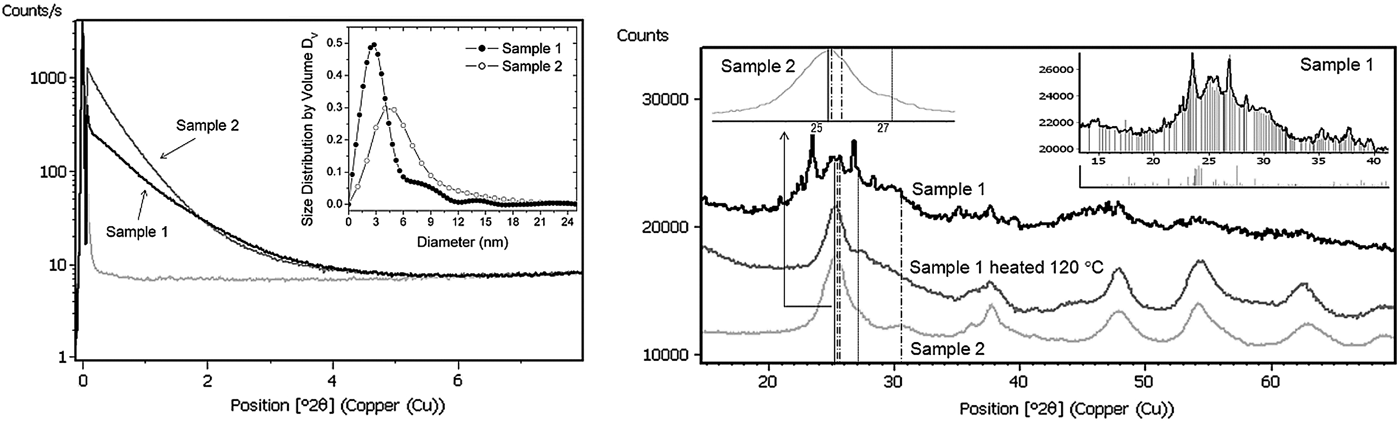
The nanopowders were dispersed in deionized water to a dilution level of 1 wt% and then loaded into a capillary. Dispersing the particles in this way is intended to prevent agglomeration that typically occurs when such small nanoparticles are measured in the powder state. A multipurpose X-ray diffractometer (PANalytical Empyrean), able to be configured for various experimental setups, was used for SAXS as well as for all the other X-ray measurements described in this work. In this case the diffractometer was equipped with a SAXS–WAXS camera with evacuated beam-path (ScatterX78), a focusing mirror for Cu radiation, and a solid-state detector (PIXcel3D). Each SAXS measurement was performed within 10 min, measuring from −0.11° to 8.00°2θ; see Figure 1(a). The derived volume-weighted particle-size distributions, D V, are shown in the inset of Figure 1(a) and were calculated by indirect Fourier-transformation (EasySAXS software).
(a) Left: SAXS curves of samples 1 and 2 measured as liquid dispersions, signal from water and particle-size distributions (inset). (b) Right: Ambient XRD patterns of (from top to bottom) the as-received sample 1, sample 1 heated at 120 °C and sample 2. The solid, dot-dashed, and dotted lines indicate the positions of the most intense and overlapping peaks of anatase, brookite, and rutile TiO2 phases, respectively. The inset on the right shows the assignment of the sharp peaks in the diffractogram of the as-received sample 1 to the monoclinic HTi8Cl9O12(H2O)31 phase (titanium hyrdoxychloride).

2. Ambient XRD
The samples were prepared on zero-background Si sample-holders and measured with a standard Bragg–Brentano XRD setup (CuKα radiation). The scans are shown in Figure 1(b) and were used for the subsequent phase-analysis (HighScore Plus software).
3. Non-ambient XRD
The thermal evolutions of the diffraction patterns collected for both samples in Bragg–Brentano configuration with CuKα radiation were followed in situ, while heating with a high-temperature chamber (Anton Paar HTK 1200N) installed on the diffractometer. The measurements were performed at increasing steps of 20 °C from room temperature to 1000 °C, allowing five min stabilization time before initiating the XRD data collection. The non-ambient data [Figure 2(a)], were sequentially analyzed using the Rietveld method (Rietveld, Reference Rietveld1969) within HighScore Plus.
(a) Left: iso-line view of the in situ XRD patterns of sample 1, recorded from room temperature to 1000 °C at steps of 20 °C. The inset shows a detail of the similar iso-line view of the in situ measurements of sample 2, showing the changes of the most intense peaks of anatase and rutile as a function of temperature. (b) Right: Rietveld refinements of nanocrystalline anatase measured at 400 °C (R p = 3.5%, R wp = 4.5%) and crystalline rutile at 1000 °C (R p = 3.1%, R wp = 3.8%).
4. Total-scattering data and PDF analysis
The two TiO2 samples were loaded into glass capillaries and measured for 20 h each using AgKα radiation, irradiated by using a fixed-divergence slit, sample 1 after heating ex situ at 120 °C was measured with MoKα radiation using a focusing X-ray mirror. The X'Celerator line detector was used in all instances. A data-collection strategy based on a gradual increase of counting time at increasing 2θ angles was adopted, in order to improve the counting statistics at high Q values as described by te Nijenhuis et al. (Reference te Nijenhuis, Gateshki and Fransen2009).
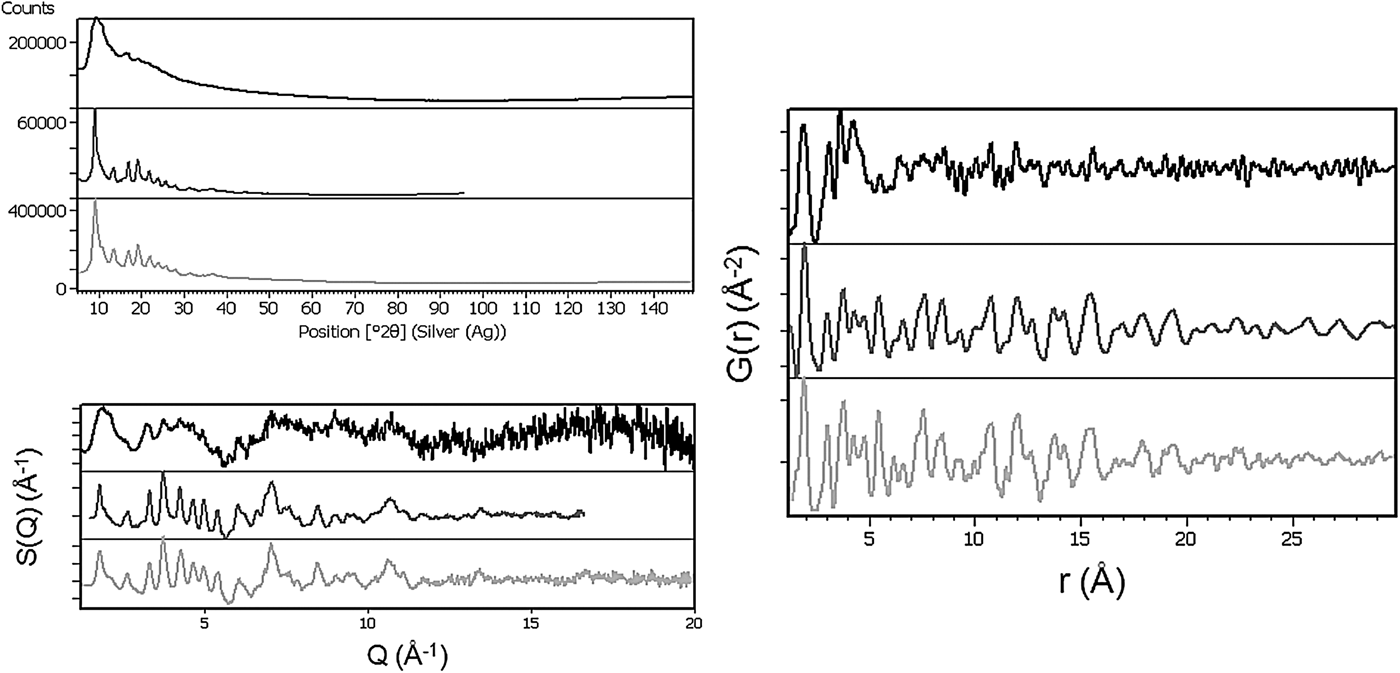
The PDF analysis consisted of four main steps: (1) data merging and background subtraction (in HighScore Plus); (2) calculation of the S(Q) structure functions (with PDFgetX3 software, by Juhás et al., Reference Juhás, Davis, Farrow and Billinge2013); (3) Fourier transformation to generate the PDFs (PDFgetX3); and (4) PDF simulations and/or fits (PDFgui software, by Farrow et al., Reference Farrow, Juhás, Liu, Bryndin, Bozin, Bloch, Proffen and Billinge2007). The corresponding graphs of the first three steps are shown in Figure 3.
(a) Top left: raw total-scattering data of sample 1 (top scan = AgKα), the heated sample 1 (middle = MoKα, angles converted to the wavelength of the Ag anode for comparison), and sample 2 (bottom = AgKα). (b) Bottom left: structure function, S(Q), obtained after correction and normalization of the raw data (from top to bottom, sample 1, heated sample 1 and sample 2). (c) Right: PDF, G(r), calculated from Fourier transformations of S(Q) (from top to bottom, sample 1, heated samples 1 and 2).
5. WD-X-ray fluorescence (XRF)
The chemical composition of samples 1 and 2 was determined by WD-XRF (PANalytical AxiosmAX spectrometer, Rhodium tube) and standardless analysis based upon a fundamental-parameters approach (Omnian software). The measurements (Figure 4) were performed under an He atmosphere on the loose powders prepared between two foils (6 μm polypropylene supporting-film).
(Color online) WD-XRF scans for Cl and Ti (inset) performed on samples 1 and 2.
6. High-resolution TEM
The high-resolution images were obtained using a Tecnai™ G2 F30 S-TWIN TEM (FEI), equipped for EDX analysis. The microscope was operated at an acceleration voltage of 300 kV (Schottky field emitter) with a TEM point-resolution of 2 Å and a line resolution of 1.02 Å. Small amounts of the TiO2 nanopowders were dispersed in ultrapure water and ultrasonicated for approximately 15 min, and then 10 μl of the diluted solution was placed onto a perforated, C-coated Cu grid. All samples were freshly prepared prior to analysis. The histograms of the particle number-weighted size distributions were obtained by measuring ~150 nanocrystallites for each sample.
III. RESULTS AND DISCUSSION
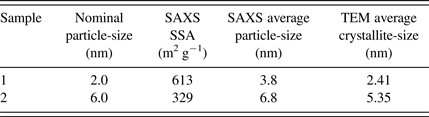
The analysis performed from the SAXS data for both samples 1 and 2 highlight two size distributions, D V, that are distinct for each of the samples. The distribution of sample 1, ranging from 1 to 5 nm, is much narrower than that of sample 2, which consists of larger sizes from 2 to about 10 nm. The average diameters and the SSA are reported in Table I.
Overview of SSA (from SAXS), particle and crystallite sizes from SAXS and TEM.
The SSA values were derived from the surface-to-volume ratios (S/V) calculated with EasySAXS software assuming a TiO2 density of 3.89 g cm−3. The size distributions determined by SAXS are in good agreement with the size distributions determined by TEM [see Figure 5(c)]. Importantly, the SAXS data are determined by irradiating substantial sample-volumes. As expected, D N is shifted to lower dimensions compared with D V of spherical nanoparticles, according to the known relationship: D V(R) ~ R 3D N(R).
(Color online) From left to right: (a) EDX analysis showing Ti and O elements, together with Cl in the as-received sample 1. The insets on the top-right corner show the reduction of Cl in sample 1 after heat treatment and the absence of Cl in sample 2. (b) High-resolution TEM image of sample 1 showing the agglomerates made by nanocrystallites of sizes comprised between 2 and 3 nm. (c) The histograms of crystallite-size distributions, D N, weighted on the number (N) of nanocrystallites for samples 1 and 2.
As mentioned earlier, one expects very broad Bragg-diffraction peaks when measuring materials with ultrasmall particle sizes. It is therefore surprising that the XRD pattern of sample 1 shows sharp diffraction peaks that cannot originate from the TiO2 nanoparticles [see Figure 1(b)]. TEM–EDX measurements shown in Figure 5(a) indicated the presence of Cl in sample 1. This result was confirmed by XRF, with a quantification of 20% of Cl (Figure 4). The elemental analysis helped to identify the impurity phase in the XRD pattern (titanium hyrdoxychloride; ICDD PDF-4+ 04-011-2755, ICDD, Reference Kabekkodu2013). This phase is no longer present in the sample after heating at 120 °C. The departure of the unwanted phase is observed in both the TEM–EDX spectrum of sample 1 after heat treatment, and in the in situ temperature series of diffraction patterns shown in Figure 2(a).
When studying the powder diffractograms, it is not possible to unambiguously identify the presence of anatase or brookite, the metastable and low-temperature polymorphs of TiO2, because of extreme broadening and subsequent overlap of diffraction peaks [see Figure 1(b)]. From the point-of-view of the application of the material, it is in general important to determine which of the TiO2 polymorphs is present, particularly anatase because of its high photocatalytic activity (Ermokhina et al., Reference Ermokhina, Nevinskiy, Manorik, Ilyin, Novichenko, Shcherbatiuk, Klymchuk, Tsyba and Puziy2013). This ambiguity is valid especially for sample 1. However, the presence of nano-sized brookite in sample 2 can be indicated by a broad signal at around 31°2θ, the only intense brookite peak which does not overlap with the peaks of the other TiO2 polymorphs. The intensity of the brookite peak increased with the temperature up to 450 °C, indicating crystallization, and then the reflection disappeared [see Figure 2(a)]. The pattern of sample 1 does not show a clear diffraction signal at 31°2θ, and is also complicated by the presence of the Cl-containing phase, which is a residual synthesis product.
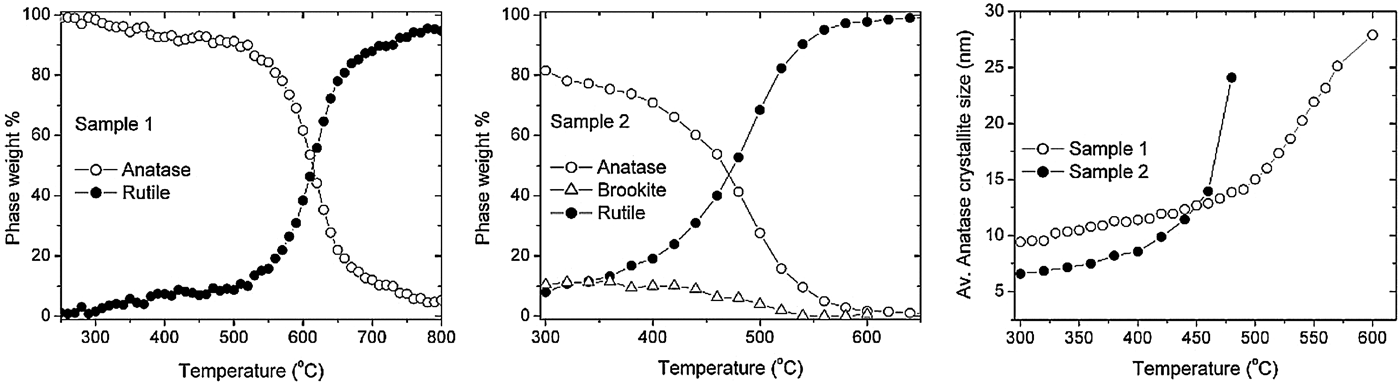
During heating the samples gradually crystallized to a point at which Rietveld refinement can easily be performed to extract structural and crystallite-size information [see Figure 2(b)]. Anatase slowly converted to the rutile phase, the stable high-temperature polymorph. Anatase, brookite, and rutile phases can be modeled all together in the patterns of sample 2. The weight factions and average crystallite-sizes in function of the temperature are reported in Figure 6.
From left to right: Thermal trends of the weight percentages of the TiO2 phases calculated by sequential Rietveld refinements, for (a) sample 1 and (b) sample 2. (c) The trends of the different growths of the crystallite sizes of anatase induced by the heating of samples 1 (white circles) and 2 (black circles), determined by Rietveld refinements.
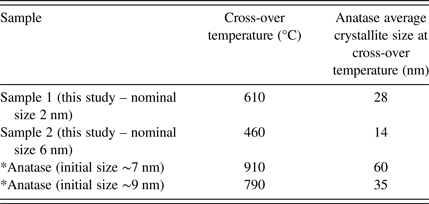
The anatase/brookite to rutile conversion happens within a certain temperature interval that also depends on the starting crystallite size as reported in the literature (Ding et al., Reference Ding, Liu and He1996; Hanaor and Sorrell, Reference Hanaor and Sorrell2011). In Table II, the cross-over temperatures at which the amount of anatase is equal to the one of rutile are reported for the investigated samples.
Temperatures at which anatase and rutile amounts are equal (* in Sommariva, Reference Sommariva2013).
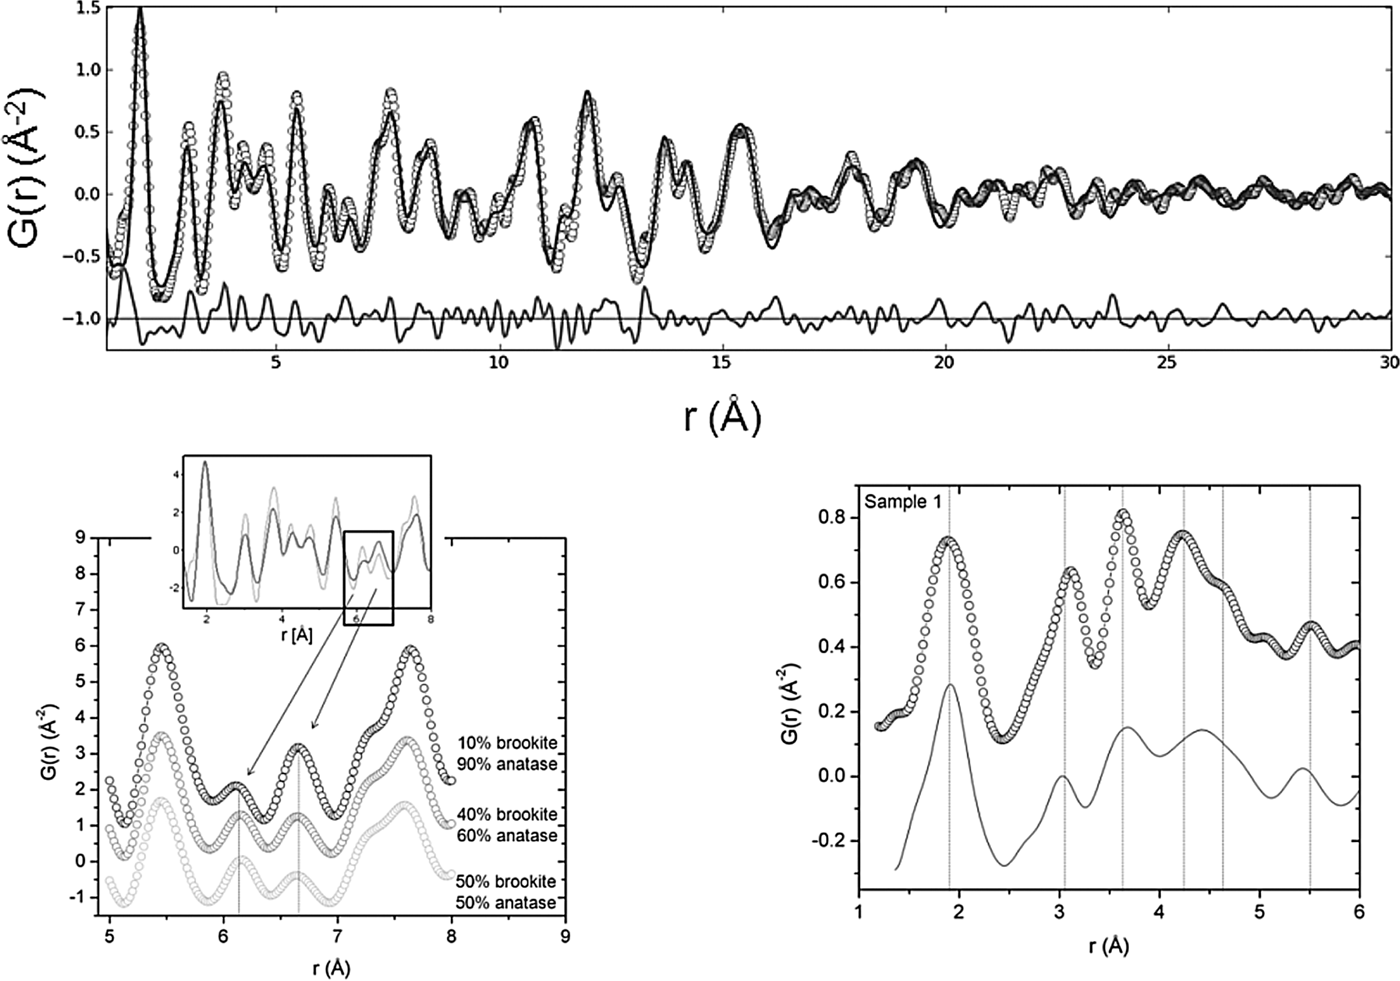
The nanoparticles with initial smaller crystallite-size convert to rutile at higher temperature. A similar effect was observed for a different series of TiO2 nanoparticles studied in a previous work by Sommariva (Reference Sommariva2013). PDF helps considerably in the structural analysis of the materials investigated here. Total scattering (i.e., Bragg as well as diffuse scattering) is measured and, after Fourier transformation, models of the materials are generated in real space rather than reciprocal space and are therefore clearer than models generated from the interpretation of diffraction patterns with broad and overlapping peaks. While interpreting the PDFs, interatomic distances characteristic of the anatase and brookite phases are identified. For sample 1, this is mainly true for the sample heated to 120 °C which displays a PDF very similar to the one of sample 2, suggesting that thermal treatment to 120 °C almost completely removes the Cl phase. As mentioned previously, the loss of Cl is confirmed by the TEM–EDX and XRF analysis. Moreover, PDF of the heated sample 1 and of sample 2 confirm the presence of the brookite in addition to the main anatase phase, and a small amount of rutile. Simulations of different brookite:anatase ratios (with fixed amount of rutile) modeled using the PDFgui software highlight the sensitivity of the technique to determine relative amounts of brookite compared with anatase. A variation of brookite from 10 to 50% changes the amplitudes of the Ti–Ti distances at 6.2 and 6.6 Å, respectively, as shown in Figure 7(b). The simulation with 10% of brookite is consistent with the PDF of the heated sample 1, whereas the case with 50% of brookite is consistent with the PDF of sample 2.
(a) Top: fit of the PDF of sample 2 indicating the presence of anatase, brookite, and a small amount of rutile. Open circles are the experimental atomic PDF, the solid line is the calculated fit. The difference curve between experimental and calculated points is shown along the bottom. (b) Bottom left: simulations of different amounts of brookite and anatase (with fixed rutile), leading to different amplitudes of the Ti–Ti distances at 6.2 and 6.6 Å, respectively. Inset shows an overlay of the experimental PDFs of the heated sample 1 (dark gray) and of sample 2 (light gray). Bottom right: PDF of sample 1 compared with the simulation performed with PDFgui of the mixture of anatase, brookite, and the monoclinic hydrate phase hydrogen titanium oxide chloride.
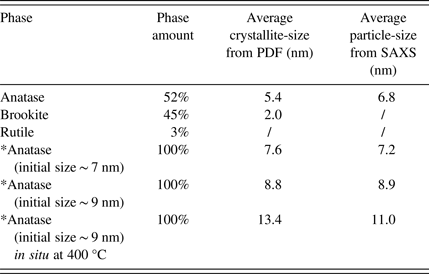
In general, a PDF also contains information about the crystallite size, since the amplitude decays differently for different crystallite-size dimensions. In Figure 7(a), there is a clear and rapid decrease of the PDF amplitude, which is due to the finite crystallite size. For spherical nanoparticles, an envelope function (Howell et al., Reference Howell, Proffen and Conradson2006) that estimates the crystallite size from the amplitude decay is implemented in PDFgui. After the determination of the parameter that describes the amplitude decrease because of instrumental resolution (that had previously been determined from a PDF fit of a crystalline-anatase sample), the spherical diameters for the phases contained in sample 2 have been calculated (Table III). The small amount of rutile does not allow a stable refinement of the spherical diameter. The crystallite size obtained for anatase from the PDF fit is in good agreement with the particle and crystallite sizes determined from SAXS data and TEM, respectively (see also Table I).
Phase amounts and average crystallite-sizes determined from PDF fit of anatase, brookite, and rutile in sample 2 (* in Sommariva, Reference Sommariva2013).
For comparison, Table III also reports the results of the nano TiO2 samples previously studied. The discrepancy between the dimensions determined from in situ high-temperature PDF and SAXS data (last row of Table III) is due to the different measurement time: the growth during the heating is larger in the former case since the total-scattering measurements are much longer than the SAXS scans. The PDF of the as-received sample 1 is complicated by the presence of broad features up to a limited range (20 Å). This can be ascribed to the presence of hydrogen titanium oxide chloride, of which the hydration level is not well known. A complete fit has not been performed but a simulation with anatase, brookite, and rutile phases with crystallite sizes of 2 nm, together with the chloride phase, has been produced and results in a profile similar to the PDF of sample 1; see Figure 7(b).
IV. CONCLUSION
In this work, two TiO2 nanopowders with particle sizes ranging from 1 to 10 nm were studied using a multipurpose in-house X-ray diffractometer. The combination of XRD and scattering techniques is critical for the determination of structural properties of USNPs. By in situ heating XRD experiments the thermal properties of the materials were determined, but in this case conventional Bragg diffraction technique is unable to conclusively establish the composition of the pristine materials and distinguish between brookite and anatase phases. However, PDF analysis provided information that made the distinction possible. Moreover, SAXS and PDF analysis produced reliable values of the particle and crystallite sizes, which were validated by high-resolution TEM. XRF spectroscopy and TEM-based EDX diffraction were used to determine the elemental composition.
ACKNOWLEDGEMENTS
The authors thank Dragana Č. Radenović (PANalytical) and Nick Kleise (University of Applied Sciences, SAXION, Enschede, The Netherlands) for the XRF measurements and analysis. Peter Munk and Natalia Dadivanyan (PANalytical) are acknowledged for the critical reading of the manuscript.